| Param | Original file | Final file |
|---|---|---|
| Filename | modeM0/AS1A05_175T01_9000002894_19511cztM0_level2.evt | modeM0/AS1A05_175T01_9000002894_19511cztM0_level2_quad_clean.evt |
| Size (bytes) | 466,600,320 | 72,207,360 |
| Size | 445.0 MB | 68.9 MB |
| Events in quadrant A | 3,439,072 | 448,055 |
| Events in quadrant B | 3,434,279 | 452,603 |
| Events in quadrant C | 3,440,072 | 423,553 |
| Events in quadrant D | 3,387,148 | 419,852 |
| Mode M9 | |||
|---|---|---|---|
| Quadrant | BADHDUFLAG | Total packets | Discarded packets |
| A | 0 | 19 | 0 |
| B | 0 | 20 | 0 |
| C | 0 | 20 | 0 |
| D | 0 | 20 | 0 |
| Mode M0 | |||
|---|---|---|---|
| Quadrant | BADHDUFLAG | Total packets | Discarded packets |
| A | 0 | 13907 | 3 |
| B | 0 | 13853 | 2 |
| C | 0 | 13891 | 2 |
| D | 0 | 13893 | 2 |
| Mode SS | |||
|---|---|---|---|
| Quadrant | BADHDUFLAG | Total packets | Discarded packets |
| A | 0 | 128 | 0 |
| B | 0 | 128 | 0 |
| C | 0 | 128 | 0 |
| D | 0 | 128 | 0 |
| Quadrant | Total seconds | Saturated seconds | Saturation percentage |
|---|---|---|---|
| A | 6341 | 101 | 1.592809% |
| B | 6341 | 101 | 1.592809% |
| C | 6341 | 113 | 1.782053% |
| D | 6341 | 81 | 1.277401% |
Noise dominated data is calculated using 1-second bins in cleaned event files. If a bin has >2000 counts, and if more than 50% of those come from <1% of pixels, then it is considered to be noise-dominated and hence unusable.
| Quadrant | # 1 sec bins | Bins with >0 counts | Bins with >2000 counts | High rate bins dominated by noise | Noise dominated (total time) | Noise dominated (detector-on time) | Marked lightcurve |
|---|---|---|---|---|---|---|---|
| A | 7641 | 6342 | 5 | 5 | 0.07% | 0.08% | 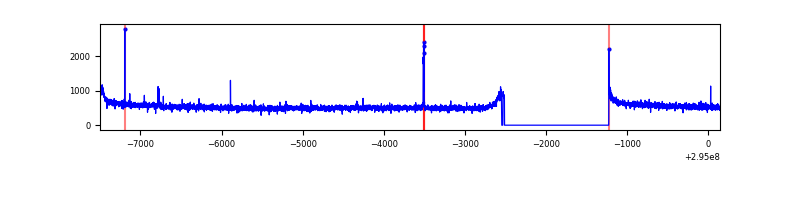 |
| B | 7641 | 6343 | 0 | 0 | 0.00% | 0.00% | 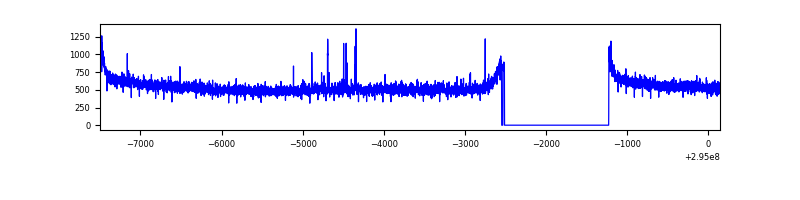 |
| C | 7641 | 6343 | 0 | 0 | 0.00% | 0.00% | 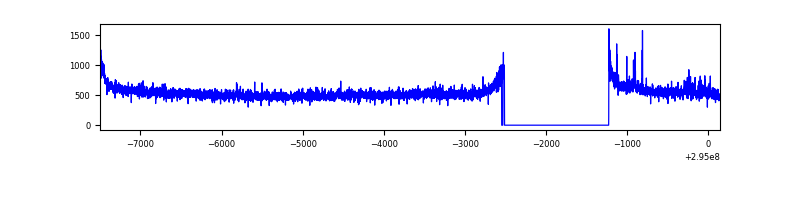 |
| D | 7641 | 6342 | 19 | 19 | 0.25% | 0.30% |  |
Top three noisy pixels from each quadrant. If the there are fewer than three noisy pixels in the level2.evt file, extra rows are filled as -1
| Pixel properties | Quadrant properties | ||||||
|---|---|---|---|---|---|---|---|
| Quadrant | DetID | PixID | Counts | Sigma | Mean | Median | Sigma |
| A | 4 | 2 | 42959 | 240.47 | 882 | 868 | 175.0 |
| A | 0 | 226 | 7634 | 38.65 | 882 | 868 | 175.0 |
| A | 13 | 254 | 6613 | 32.82 | 882 | 868 | 175.0 |
| B | 12 | 111 | 19342 | 112.92 | 872 | 853 | 163.7 |
| B | 11 | 111 | 17059 | 98.98 | 872 | 853 | 163.7 |
| B | 14 | 111 | 15643 | 90.33 | 872 | 853 | 163.7 |
| C | 14 | 238 | 131112 | 689.8 | 823 | 830 | 188.9 |
| C | 9 | 221 | 63808 | 333.45 | 823 | 830 | 188.9 |
| C | 3 | 233 | 30950 | 159.48 | 823 | 830 | 188.9 |
| D | 5 | 222 | 115113 | 562.93 | 844 | 823 | 203.0 |
| D | 12 | 218 | 62553 | 304.05 | 844 | 823 | 203.0 |
| D | 1 | 52 | 30363 | 145.5 | 844 | 823 | 203.0 |
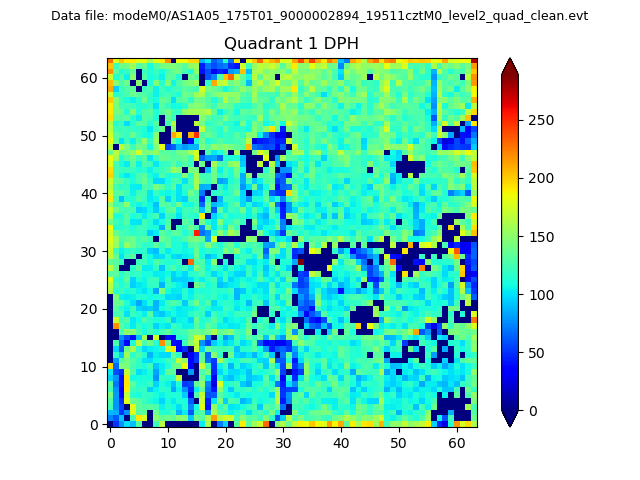
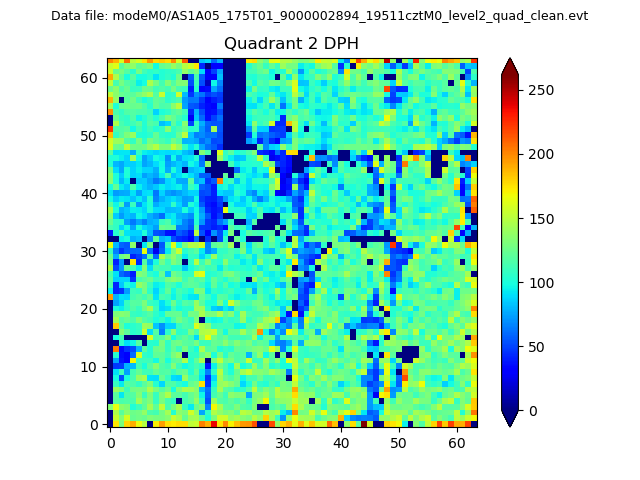
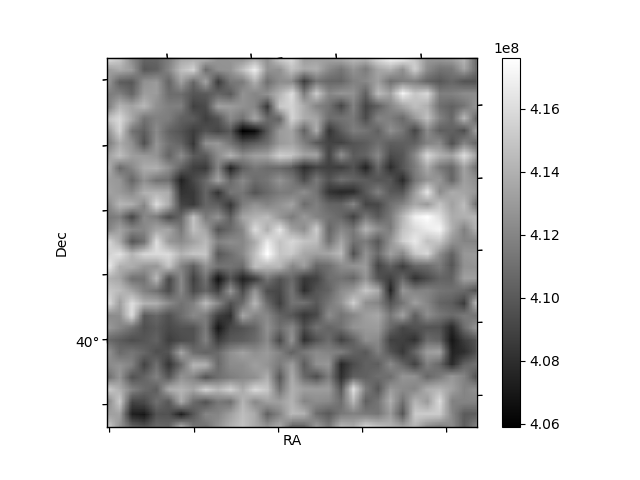
Histogram calculated using DETX and DETY for each event in the final _common_clean file
| Quadrant A | 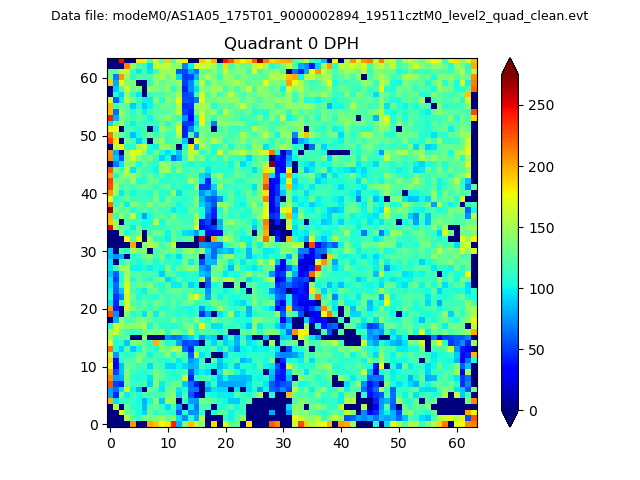 |
 |
Quadrant B |
|---|---|---|---|
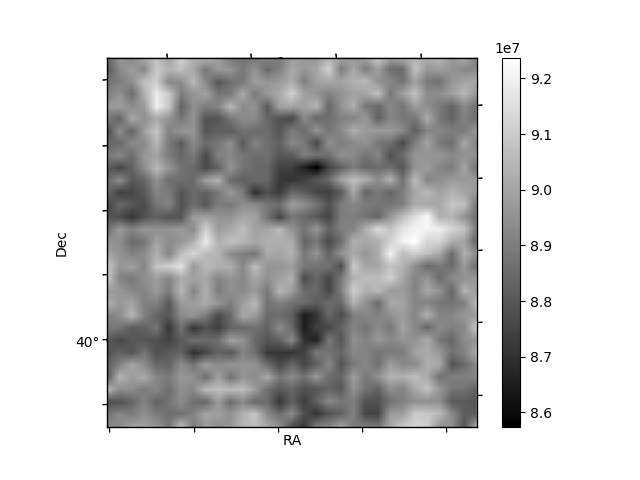
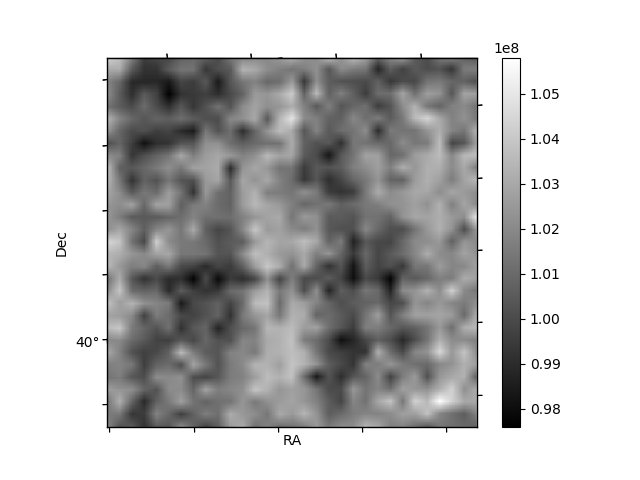
| Quadrant D | 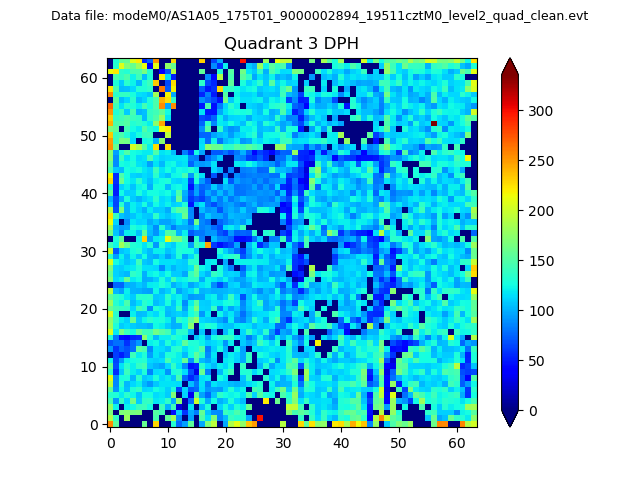 |
 |
Quadrant C |
| Plot type | Count rate plots | Images |
|---|---|---|
| Comparison with Poisson distribution Blue bars denote a histogram of data divided into 1 sec bins. Red curve is a Poisson curve with rate = median count rate of data. |
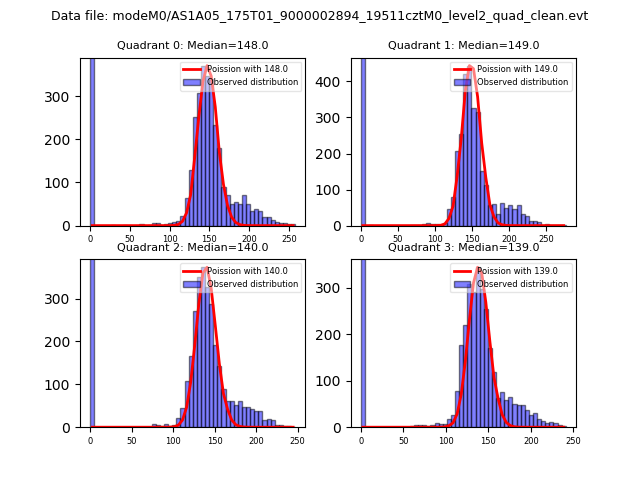 |
 |
| Quadrant-wise count rates Data is divided into 100 sec bins |
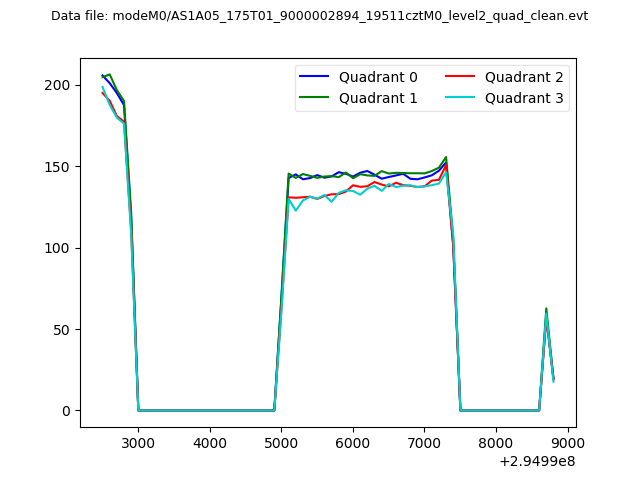 |
|
| Module-wise count rates for Quadrant A Data is divided into 100 sec bins |
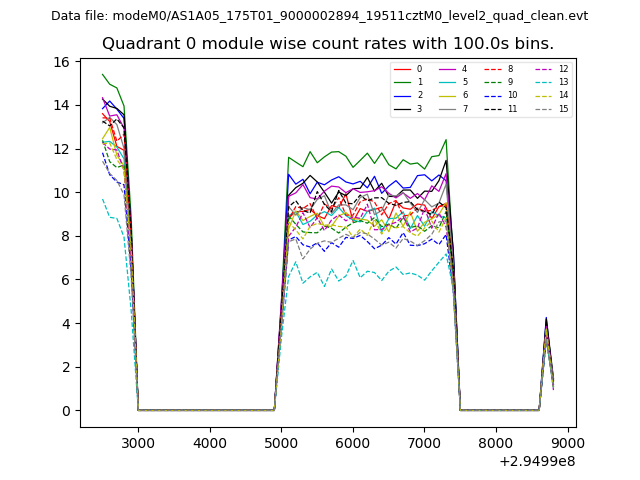 |
 |
| Module-wise count rates for Quadrant B Data is divided into 100 sec bins |
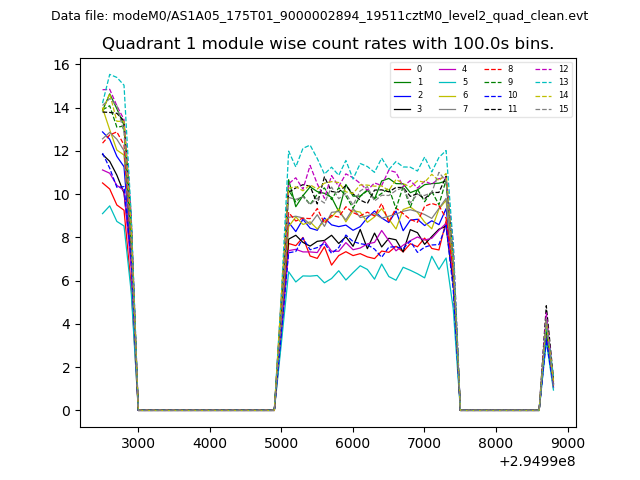 |
 |
| Module-wise count rates for Quadrant C Data is divided into 100 sec bins |
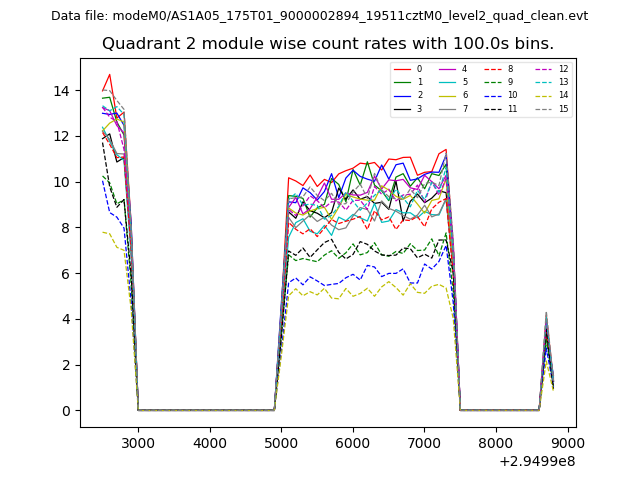 |
 |
| Module-wise count rates for Quadrant D Data is divided into 100 sec bins |
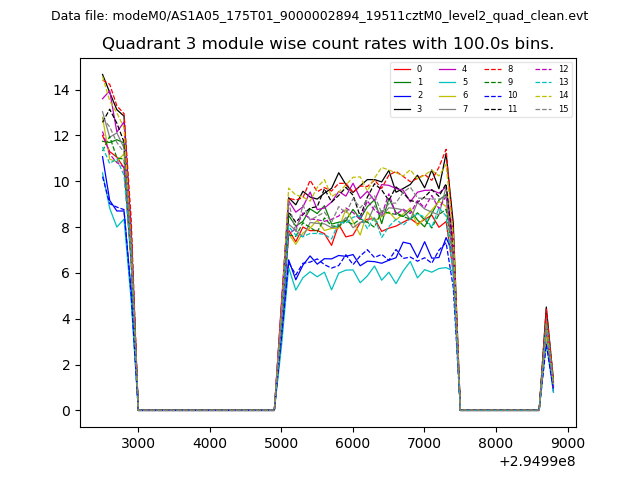 |
 |
| Parameter | Plot |
|---|---|
| CZT HV Monitor | 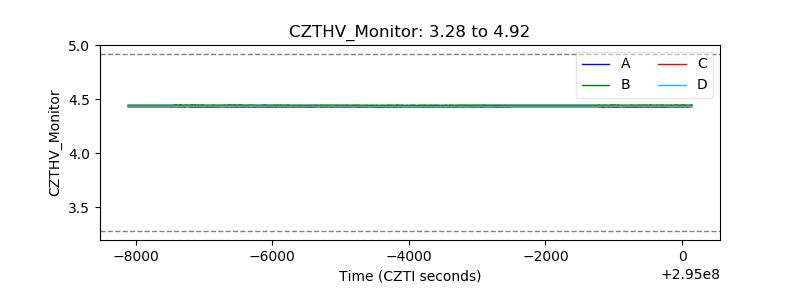 |
| D_VDD | 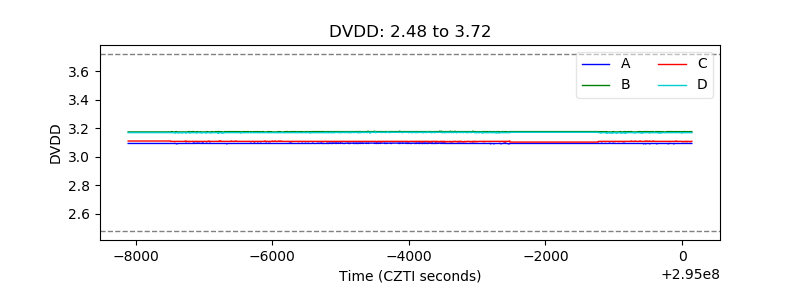 |
| Temperature 1 | 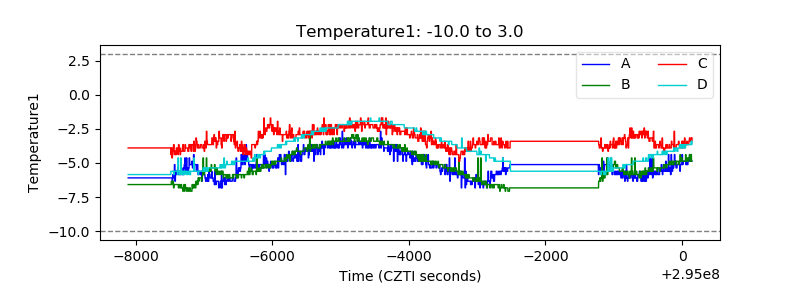 |
| Veto HV Monitor | 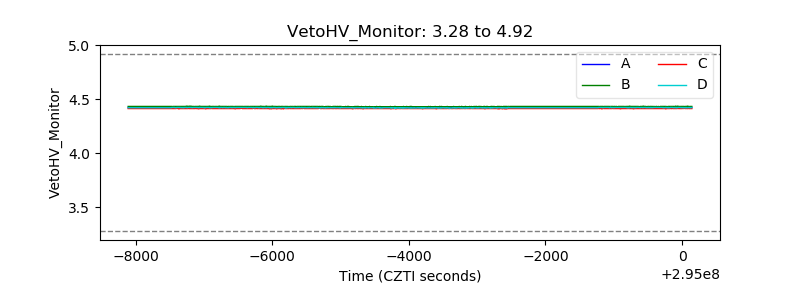 |
| Veto LLD | 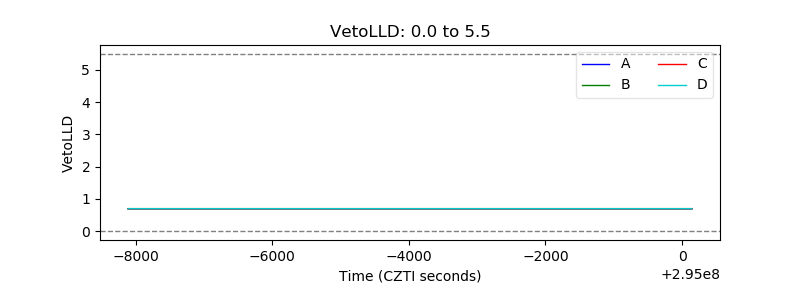 |
| Alpha Counter | 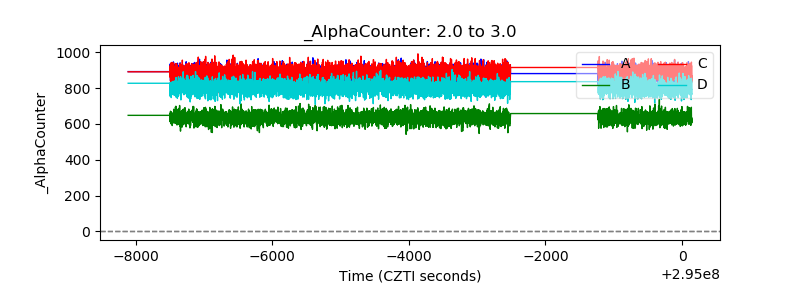 |
| _CPM_Rate | 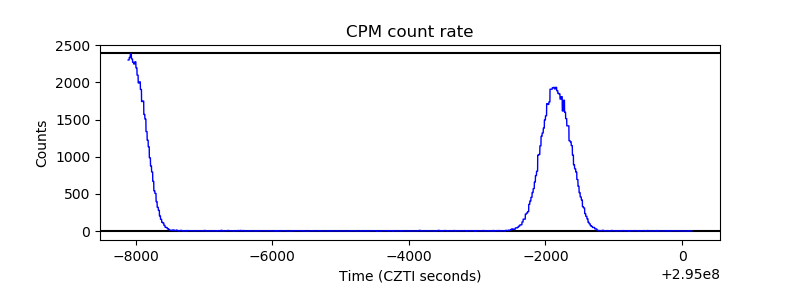 |
| CZT Counter | 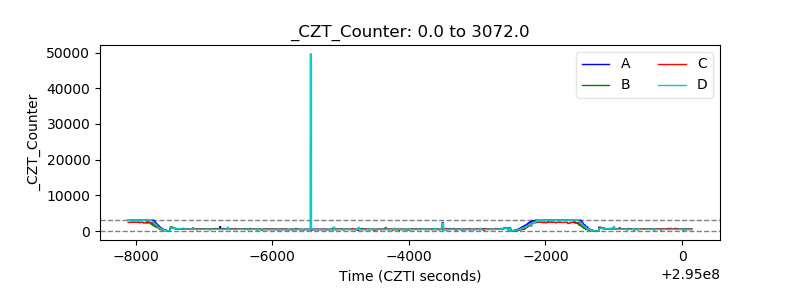 |
| +2.5 Volts monitor |  |
| +5 Volts monitor |  |
| _ROLL_ROT | 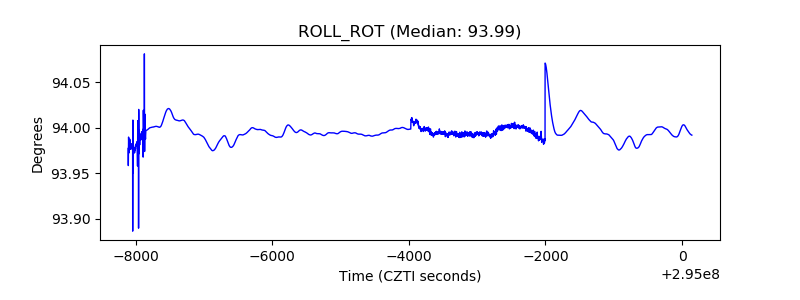 |
| _Roll_DEC | 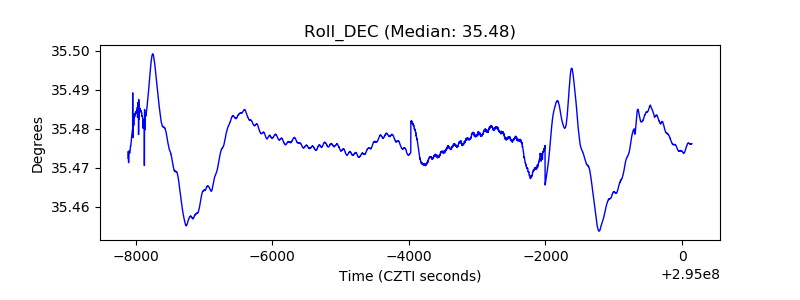 |
| _Roll_RA | 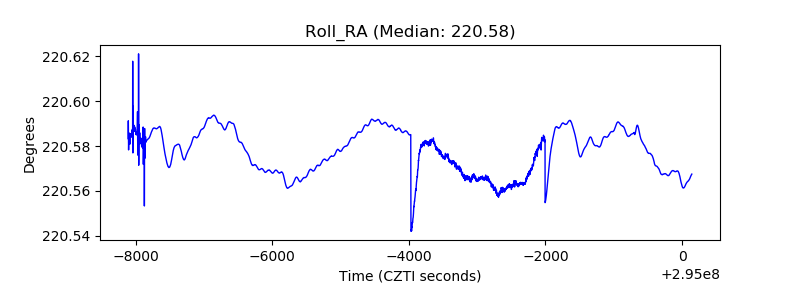 |
| Veto Counter | 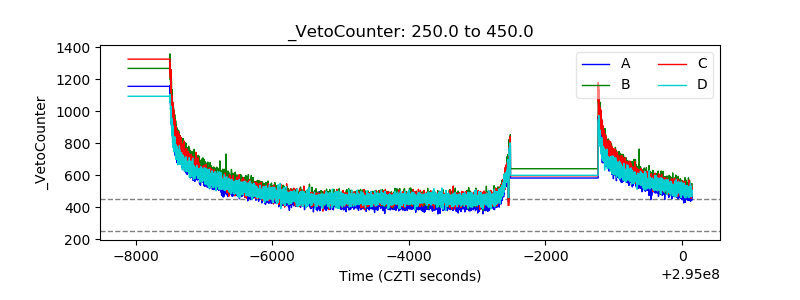 |