| Param | Original file | Final file |
|---|---|---|
| Filename | modeM0/AS1A05_175T01_9000002894_19512cztM0_level2.evt | modeM0/AS1A05_175T01_9000002894_19512cztM0_level2_quad_clean.evt |
| Size (bytes) | 498,392,640 | 68,440,320 |
| Size | 475.3 MB | 65.3 MB |
| Events in quadrant A | 3,425,999 | 419,737 |
| Events in quadrant B | 3,462,339 | 423,618 |
| Events in quadrant C | 3,521,195 | 394,777 |
| Events in quadrant D | 4,250,709 | 388,341 |
| Mode M9 | |||
|---|---|---|---|
| Quadrant | BADHDUFLAG | Total packets | Discarded packets |
| A | 0 | 16 | 0 |
| B | 0 | 17 | 0 |
| C | 0 | 17 | 0 |
| D | 0 | 17 | 0 |
| Mode M0 | |||
|---|---|---|---|
| Quadrant | BADHDUFLAG | Total packets | Discarded packets |
| A | 0 | 13811 | 2 |
| B | 0 | 13897 | 2 |
| C | 0 | 14165 | 2 |
| D | 0 | 16605 | 2 |
| Mode SS | |||
|---|---|---|---|
| Quadrant | BADHDUFLAG | Total packets | Discarded packets |
| A | 0 | 130 | 0 |
| B | 0 | 130 | 0 |
| C | 0 | 130 | 0 |
| D | 0 | 130 | 0 |
| Quadrant | Total seconds | Saturated seconds | Saturation percentage |
|---|---|---|---|
| A | 6395 | 111 | 1.735731% |
| B | 6394 | 113 | 1.767282% |
| C | 6394 | 127 | 1.986237% |
| D | 6394 | 303 | 4.738818% |
Noise dominated data is calculated using 1-second bins in cleaned event files. If a bin has >2000 counts, and if more than 50% of those come from <1% of pixels, then it is considered to be noise-dominated and hence unusable.
| Quadrant | # 1 sec bins | Bins with >0 counts | Bins with >2000 counts | High rate bins dominated by noise | Noise dominated (total time) | Noise dominated (detector-on time) | Marked lightcurve |
|---|---|---|---|---|---|---|---|
| A | 7675 | 6396 | 1 | 1 | 0.01% | 0.02% | 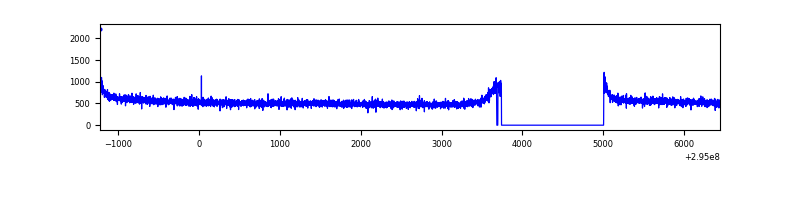 |
| B | 7674 | 6395 | 6 | 6 | 0.08% | 0.09% | 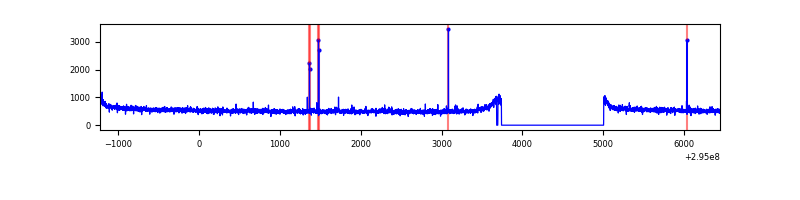 |
| C | 7674 | 6395 | 0 | 0 | 0.00% | 0.00% | 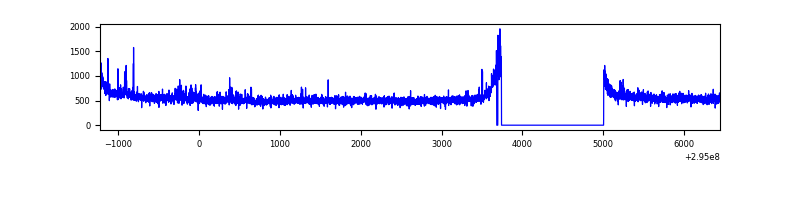 |
| D | 7674 | 6395 | 201 | 201 | 2.62% | 3.14% | 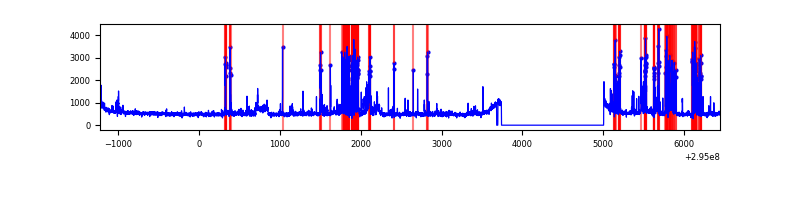 |
Top three noisy pixels from each quadrant. If the there are fewer than three noisy pixels in the level2.evt file, extra rows are filled as -1
| Pixel properties | Quadrant properties | ||||||
|---|---|---|---|---|---|---|---|
| Quadrant | DetID | PixID | Counts | Sigma | Mean | Median | Sigma |
| A | 13 | 254 | 8195 | 41.78 | 888 | 871 | 175.3 |
| A | 0 | 226 | 7774 | 39.37 | 888 | 871 | 175.3 |
| A | 3 | 137 | 6580 | 32.56 | 888 | 871 | 175.3 |
| B | 12 | 111 | 19176 | 112.05 | 874 | 855 | 163.5 |
| B | 11 | 111 | 17049 | 99.04 | 874 | 855 | 163.5 |
| B | 14 | 111 | 15479 | 89.44 | 874 | 855 | 163.5 |
| C | 14 | 238 | 132479 | 688.66 | 827 | 834 | 191.2 |
| C | 9 | 221 | 89975 | 466.32 | 827 | 834 | 191.2 |
| C | 3 | 233 | 52088 | 268.12 | 827 | 834 | 191.2 |
| D | 12 | 218 | 460054 | 2292.75 | 839 | 816 | 200.3 |
| D | 5 | 222 | 375229 | 1869.26 | 839 | 816 | 200.3 |
| D | 10 | 50 | 122602 | 608.02 | 839 | 816 | 200.3 |
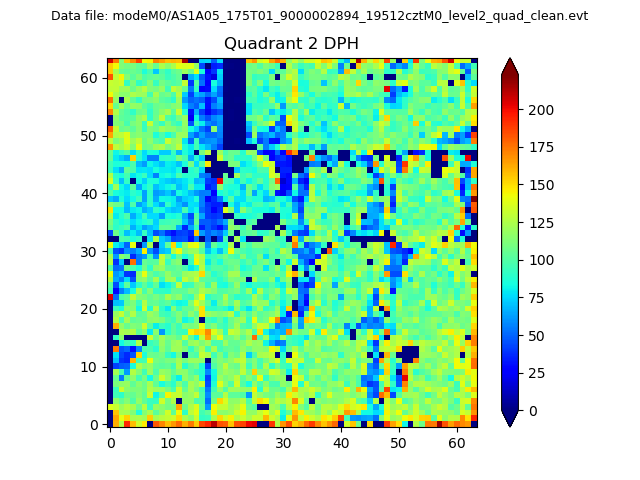
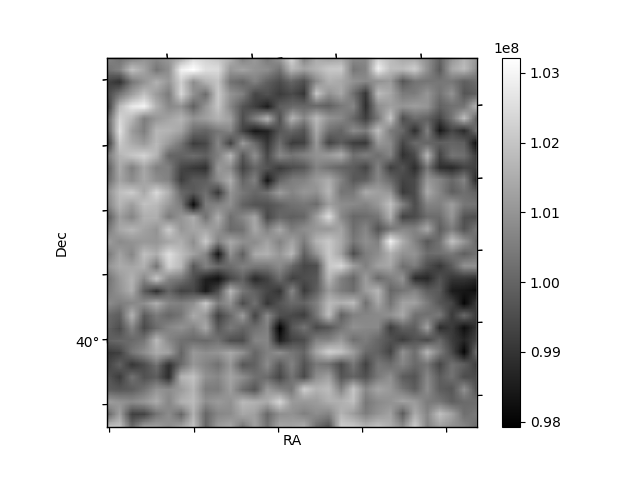
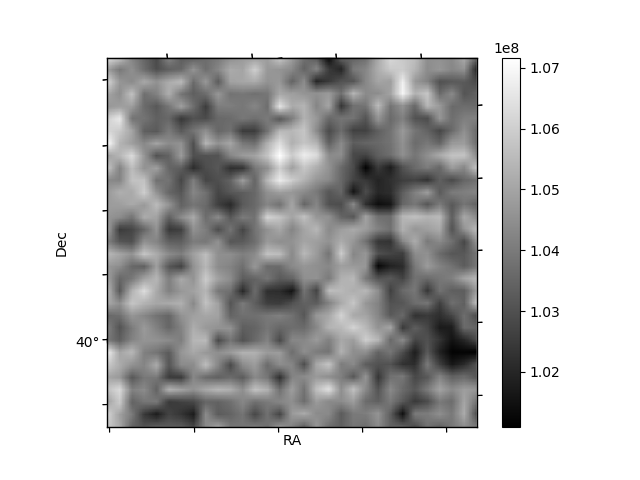
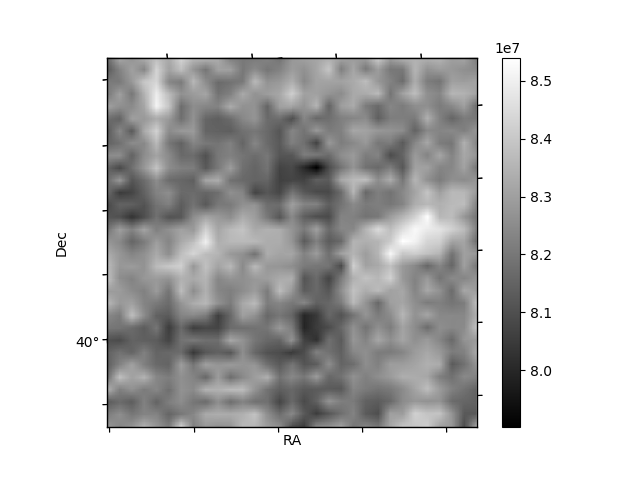
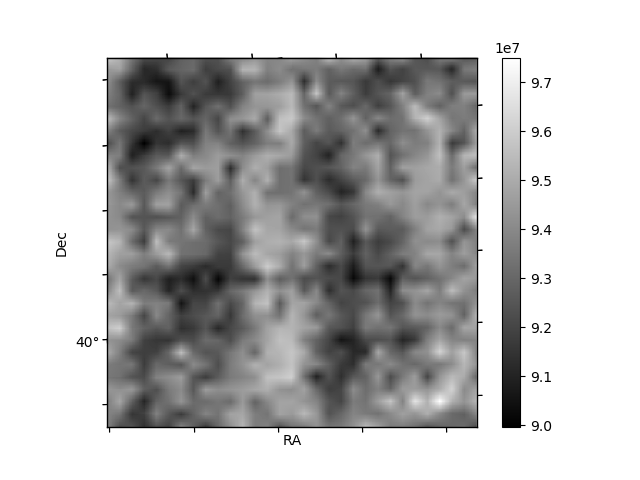
Histogram calculated using DETX and DETY for each event in the final _common_clean file
| Quadrant A |  |
 |
Quadrant B |
|---|---|---|---|
| Quadrant D | 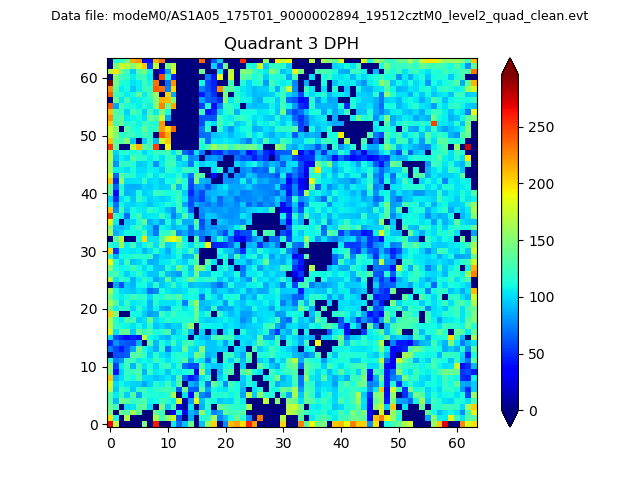 |
 |
Quadrant C |
| Plot type | Count rate plots | Images |
|---|---|---|
| Comparison with Poisson distribution Blue bars denote a histogram of data divided into 1 sec bins. Red curve is a Poisson curve with rate = median count rate of data. |
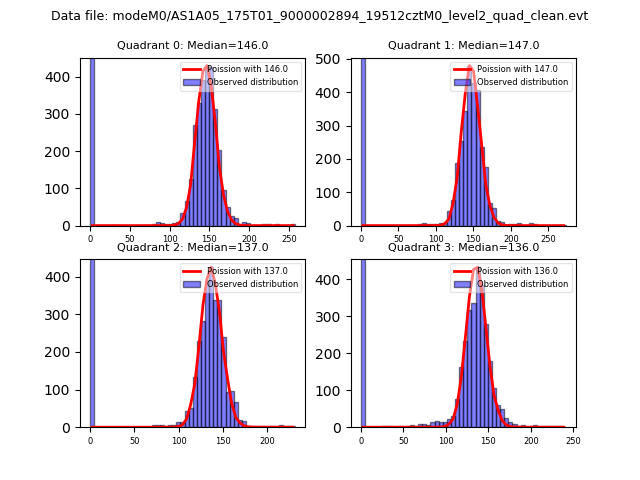 |
 |
| Quadrant-wise count rates Data is divided into 100 sec bins |
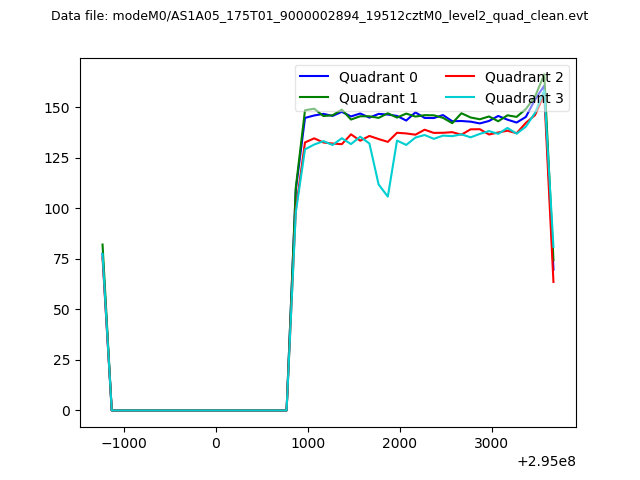 |
|
| Module-wise count rates for Quadrant A Data is divided into 100 sec bins |
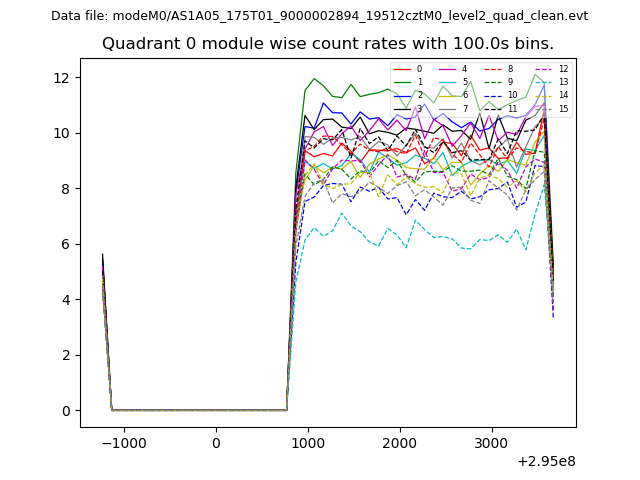 |
 |
| Module-wise count rates for Quadrant B Data is divided into 100 sec bins |
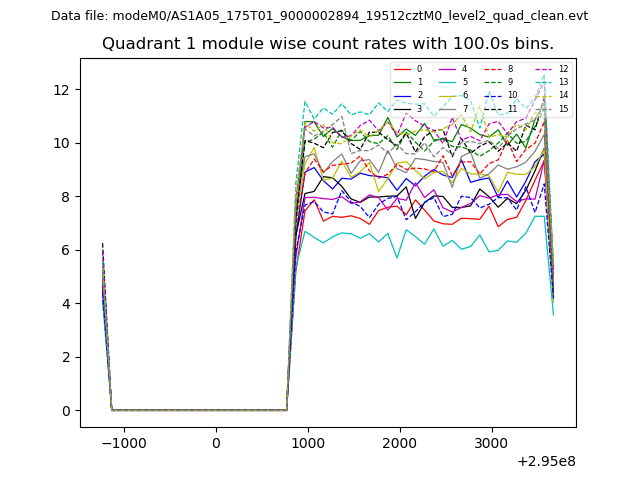 |
 |
| Module-wise count rates for Quadrant C Data is divided into 100 sec bins |
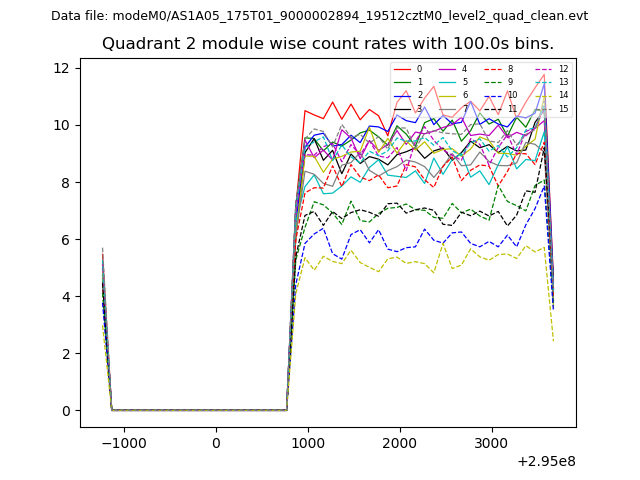 |
 |
| Module-wise count rates for Quadrant D Data is divided into 100 sec bins |
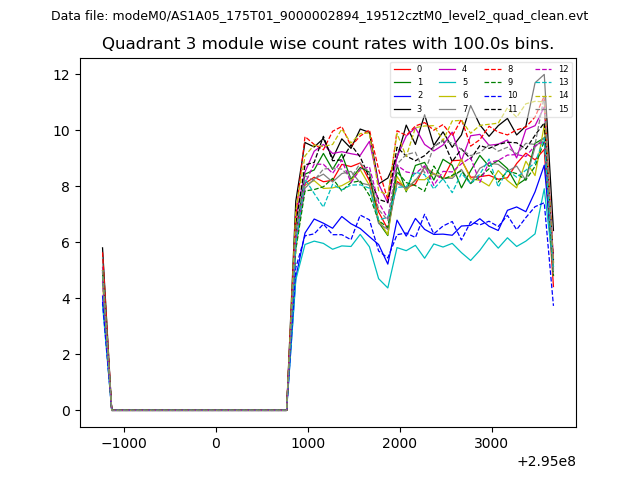 |
 |
| Parameter | Plot |
|---|---|
| CZT HV Monitor | 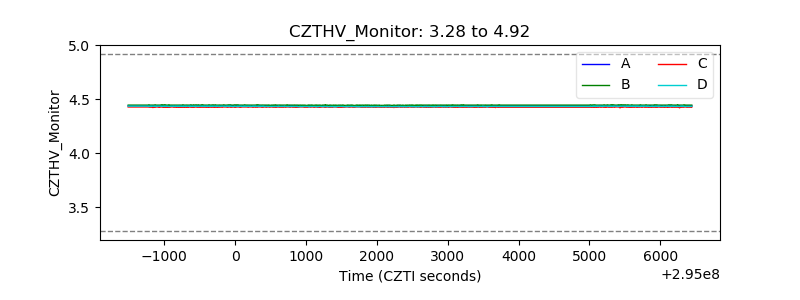 |
| D_VDD | 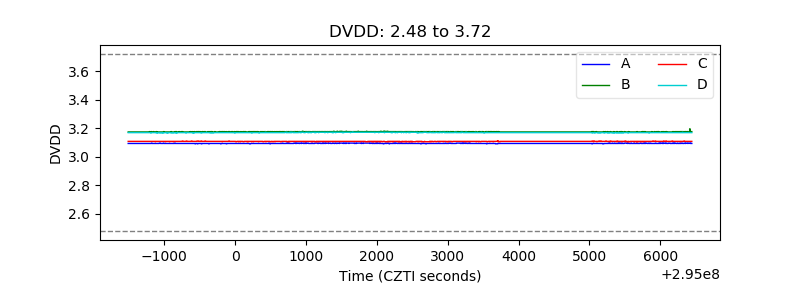 |
| Temperature 1 | 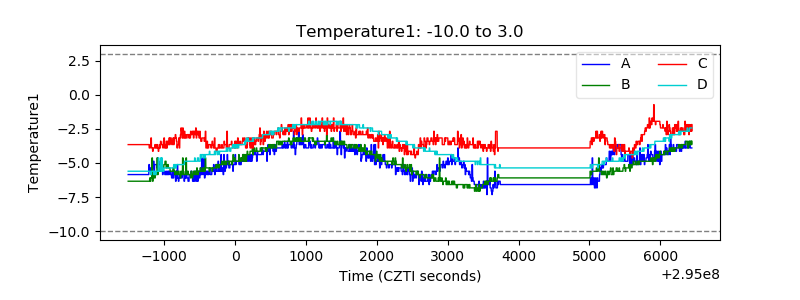 |
| Veto HV Monitor | 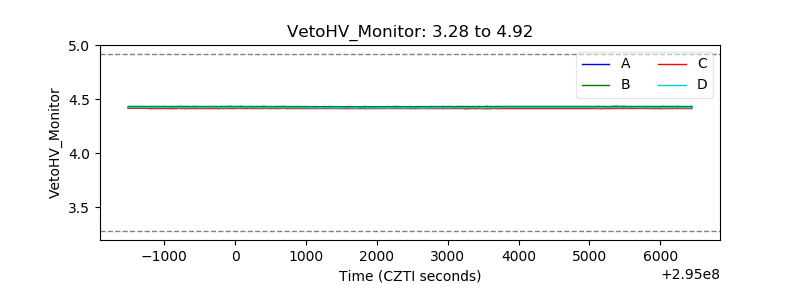 |
| Veto LLD | 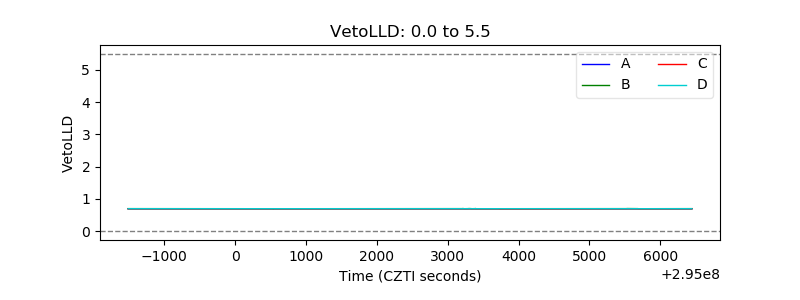 |
| Alpha Counter | 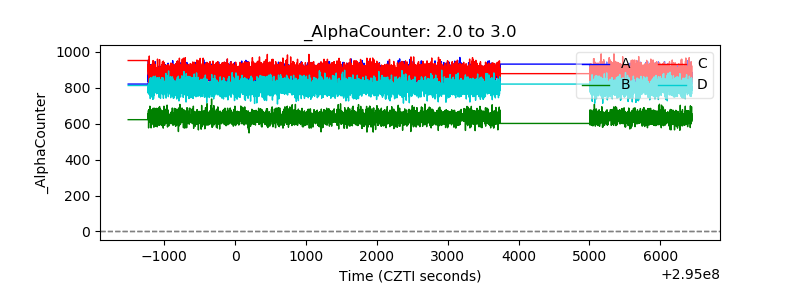 |
| _CPM_Rate | 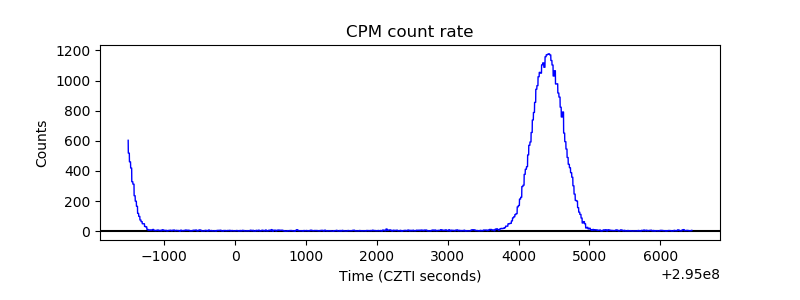 |
| CZT Counter | 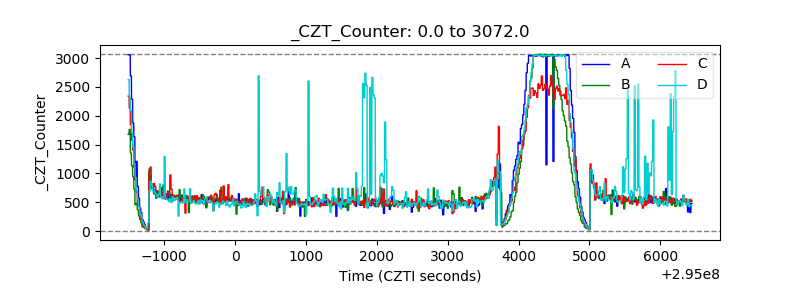 |
| +2.5 Volts monitor |  |
| +5 Volts monitor |  |
| _ROLL_ROT | 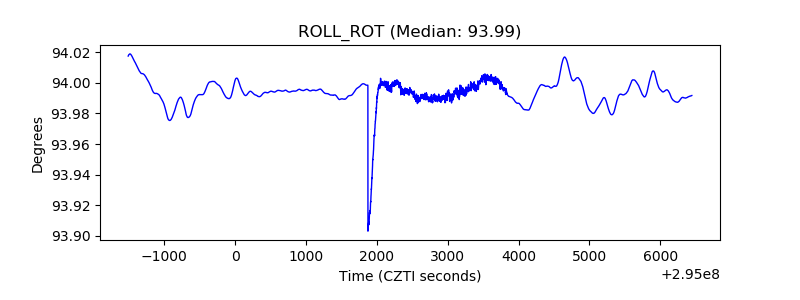 |
| _Roll_DEC | 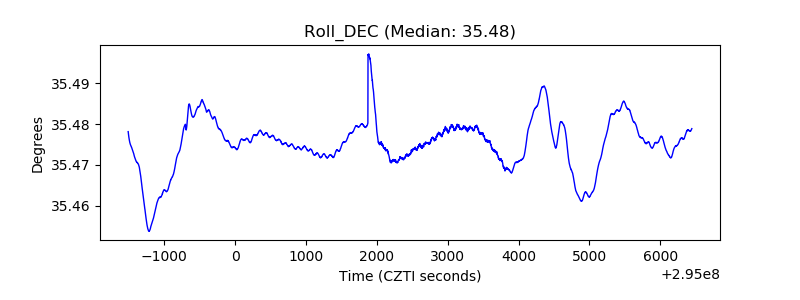 |
| _Roll_RA | 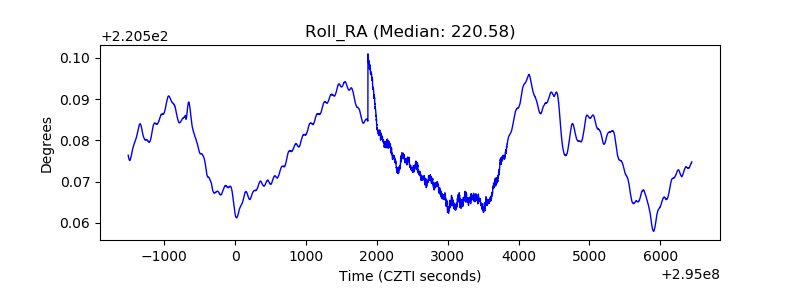 |
| Veto Counter | 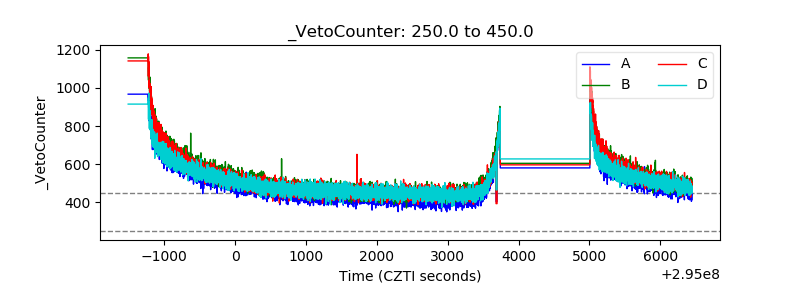 |