| Param | Original file | Final file |
|---|---|---|
| Filename | modeM0/AS1A05_175T01_9000002894_19515cztM0_level2.evt | modeM0/AS1A05_175T01_9000002894_19515cztM0_level2_quad_clean.evt |
| Size (bytes) | 643,432,320 | 92,390,400 |
| Size | 613.6 MB | 88.1 MB |
| Events in quadrant A | 3,524,434 | 607,412 |
| Events in quadrant B | 3,603,065 | 609,429 |
| Events in quadrant C | 3,624,056 | 578,812 |
| Events in quadrant D | 8,236,851 | 490,408 |
| Mode M9 | |||
|---|---|---|---|
| Quadrant | BADHDUFLAG | Total packets | Discarded packets |
| A | 0 | 14 | 0 |
| B | 0 | 14 | 0 |
| C | 0 | 14 | 0 |
| D | 0 | 14 | 0 |
| Mode M0 | |||
|---|---|---|---|
| Quadrant | BADHDUFLAG | Total packets | Discarded packets |
| A | 0 | 15202 | 2 |
| B | 0 | 15343 | 2 |
| C | 0 | 15376 | 2 |
| D | 0 | 29307 | 2 |
| Mode SS | |||
|---|---|---|---|
| Quadrant | BADHDUFLAG | Total packets | Discarded packets |
| A | 0 | 150 | 0 |
| B | 0 | 150 | 0 |
| C | 0 | 150 | 0 |
| D | 0 | 150 | 0 |
| Quadrant | Total seconds | Saturated seconds | Saturation percentage |
|---|---|---|---|
| A | 7346 | 179 | 2.436700% |
| B | 7346 | 219 | 2.981214% |
| C | 7347 | 254 | 3.457193% |
| D | 7347 | 1595 | 21.709541% |
Noise dominated data is calculated using 1-second bins in cleaned event files. If a bin has >2000 counts, and if more than 50% of those come from <1% of pixels, then it is considered to be noise-dominated and hence unusable.
| Quadrant | # 1 sec bins | Bins with >0 counts | Bins with >2000 counts | High rate bins dominated by noise | Noise dominated (total time) | Noise dominated (detector-on time) | Marked lightcurve |
|---|---|---|---|---|---|---|---|
| A | 8677 | 7347 | 0 | 0 | 0.00% | 0.00% | 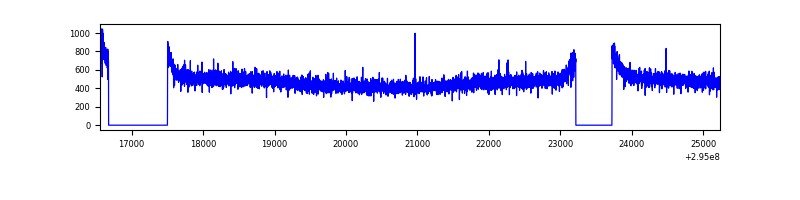 |
| B | 8677 | 7347 | 0 | 0 | 0.00% | 0.00% | 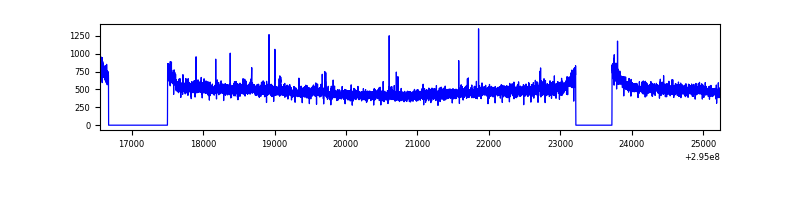 |
| C | 8678 | 7348 | 0 | 0 | 0.00% | 0.00% | 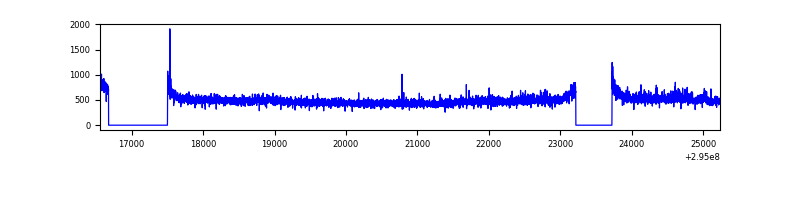 |
| D | 8678 | 7348 | 1482 | 1482 | 17.08% | 20.17% | 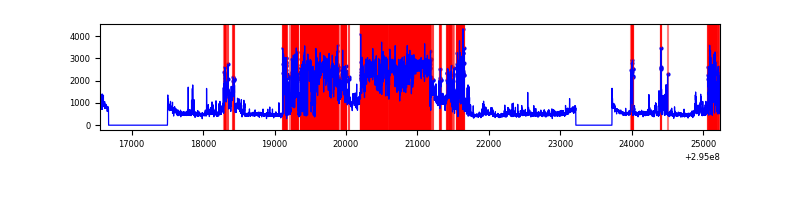 |
Top three noisy pixels from each quadrant. If the there are fewer than three noisy pixels in the level2.evt file, extra rows are filled as -1
| Pixel properties | Quadrant properties | ||||||
|---|---|---|---|---|---|---|---|
| Quadrant | DetID | PixID | Counts | Sigma | Mean | Median | Sigma |
| A | 13 | 254 | 8570 | 41.78 | 913 | 893 | 183.7 |
| A | 0 | 226 | 7790 | 37.54 | 913 | 893 | 183.7 |
| A | 3 | 137 | 7712 | 37.11 | 913 | 893 | 183.7 |
| B | 0 | 198 | 47854 | 271.88 | 902 | 880 | 172.8 |
| B | 12 | 111 | 21832 | 121.27 | 902 | 880 | 172.8 |
| B | 11 | 111 | 19375 | 107.05 | 902 | 880 | 172.8 |
| C | 14 | 238 | 135160 | 657.44 | 870 | 875 | 204.3 |
| C | 3 | 233 | 61546 | 297.04 | 870 | 875 | 204.3 |
| C | 9 | 221 | 33197 | 158.24 | 870 | 875 | 204.3 |
| D | 7 | 238 | 4470093 | 22126.15 | 832 | 806 | 202.0 |
| D | 1 | 52 | 439670 | 2172.69 | 832 | 806 | 202.0 |
| D | 12 | 218 | 158401 | 780.21 | 832 | 806 | 202.0 |
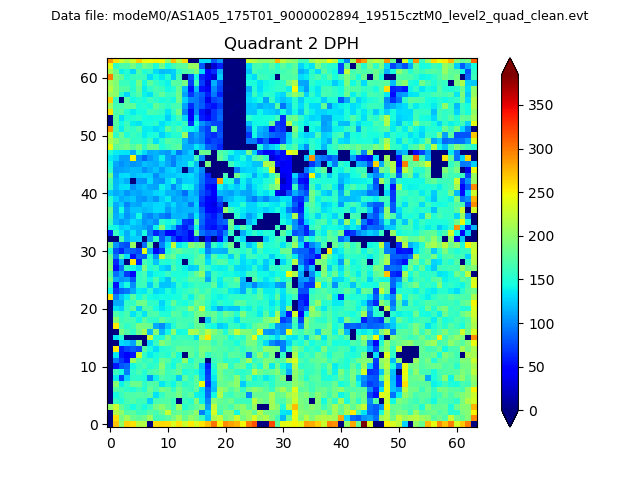
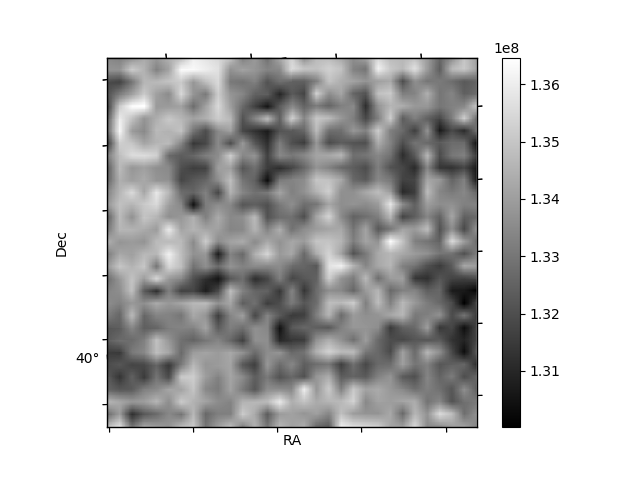
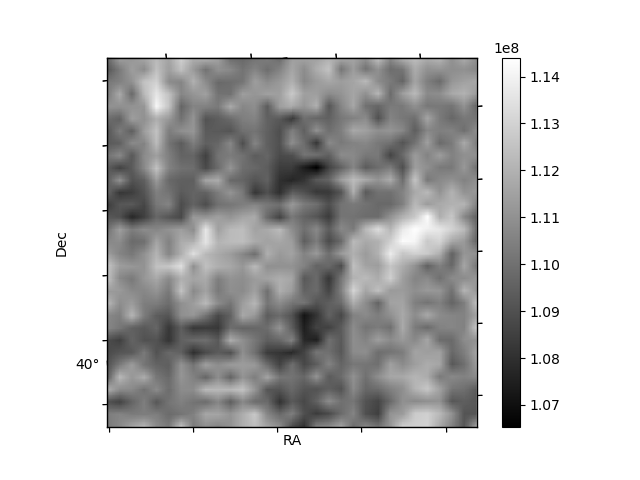
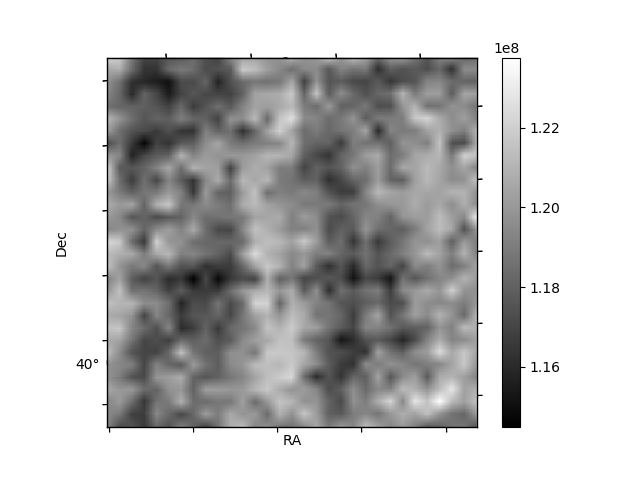
Histogram calculated using DETX and DETY for each event in the final _common_clean file
| Quadrant A | 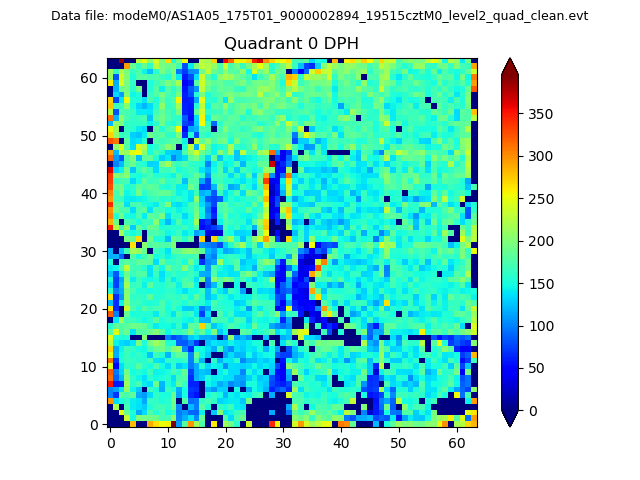 |
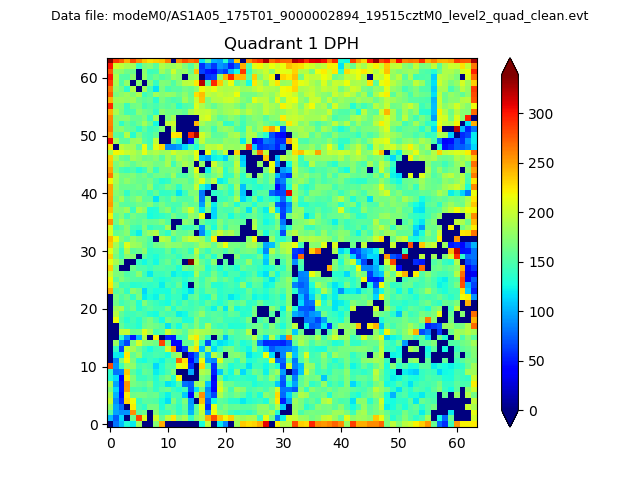 |
Quadrant B |
|---|---|---|---|
| Quadrant D | 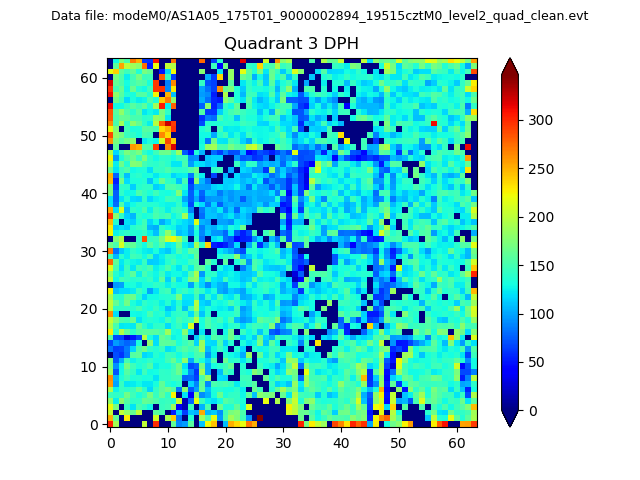 |
 |
Quadrant C |
| Plot type | Count rate plots | Images |
|---|---|---|
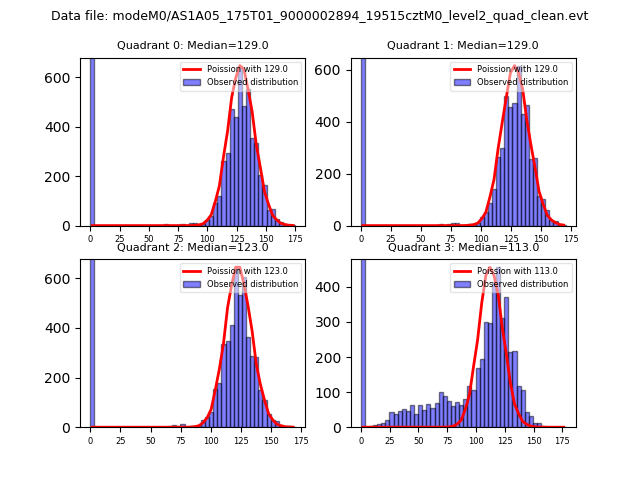
| Comparison with Poisson distribution Blue bars denote a histogram of data divided into 1 sec bins. Red curve is a Poisson curve with rate = median count rate of data. |
 |
 |
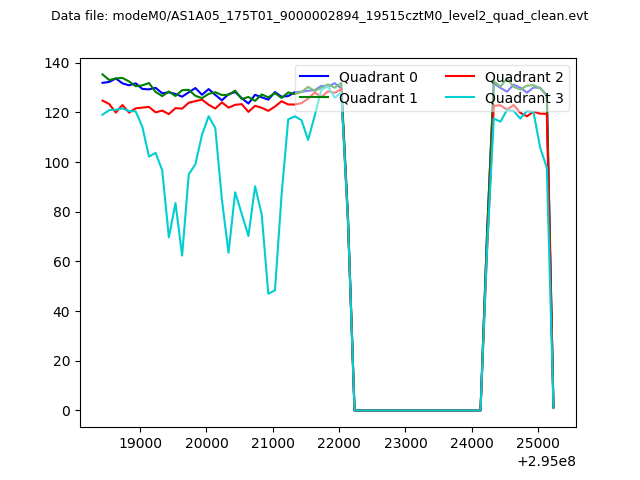
| Quadrant-wise count rates Data is divided into 100 sec bins |
 |
|
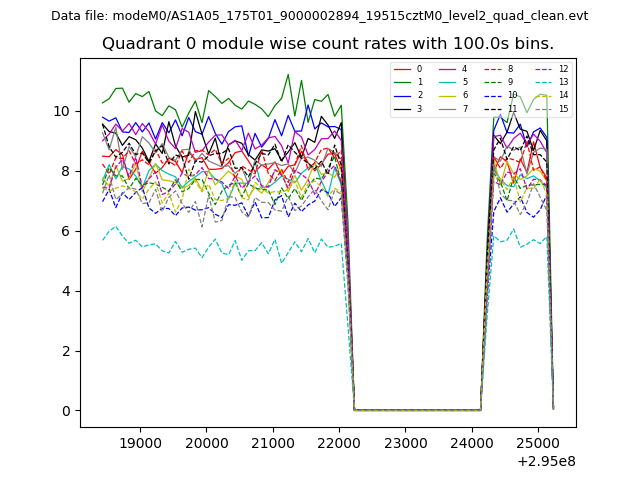
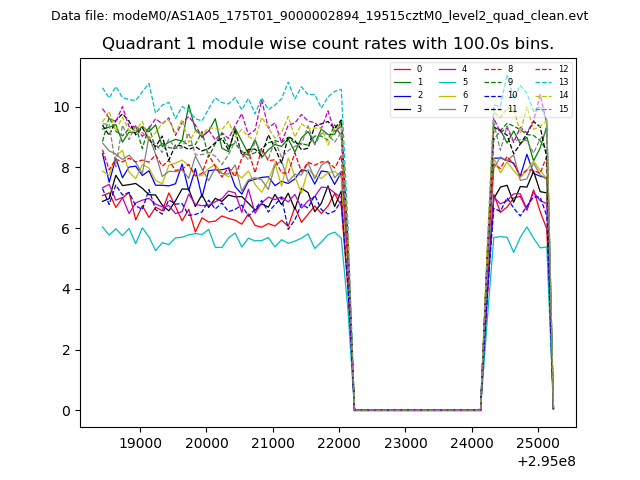
| Module-wise count rates for Quadrant A Data is divided into 100 sec bins |
 |
 |
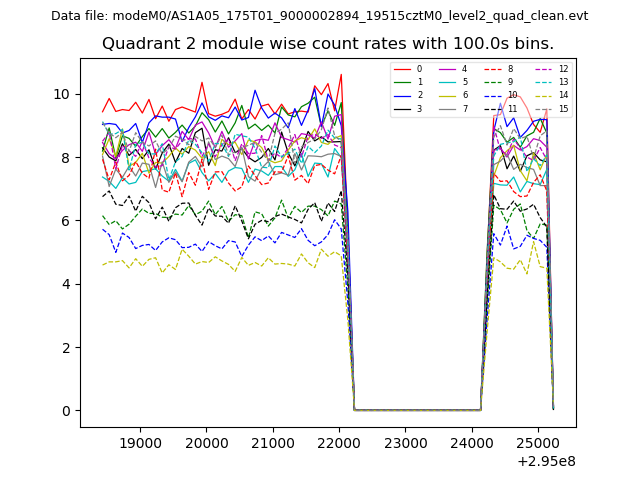
| Module-wise count rates for Quadrant B Data is divided into 100 sec bins |
 |
 |
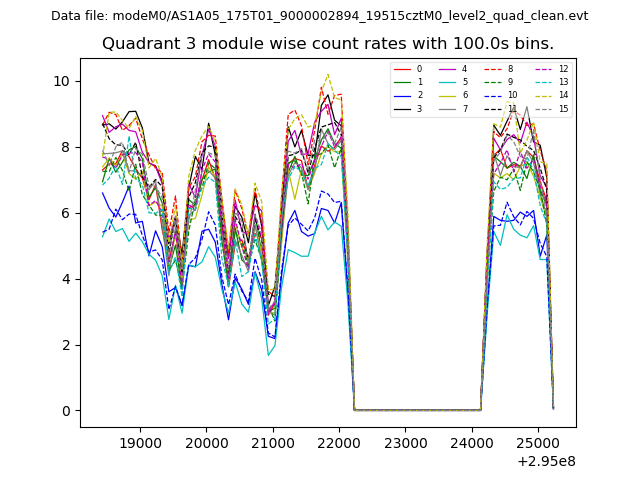
| Module-wise count rates for Quadrant C Data is divided into 100 sec bins |
 |
 |
| Module-wise count rates for Quadrant D Data is divided into 100 sec bins |
 |
 |
| Parameter | Plot |
|---|---|
| CZT HV Monitor | 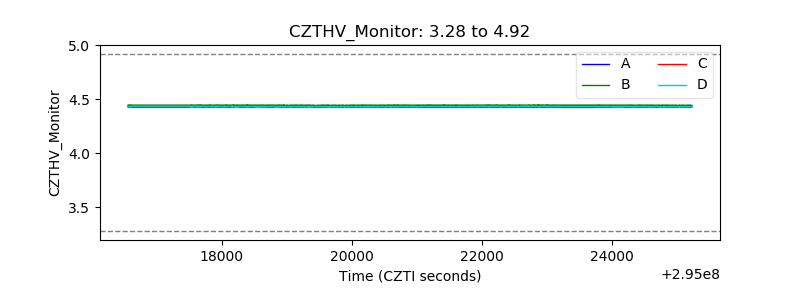 |
| D_VDD | 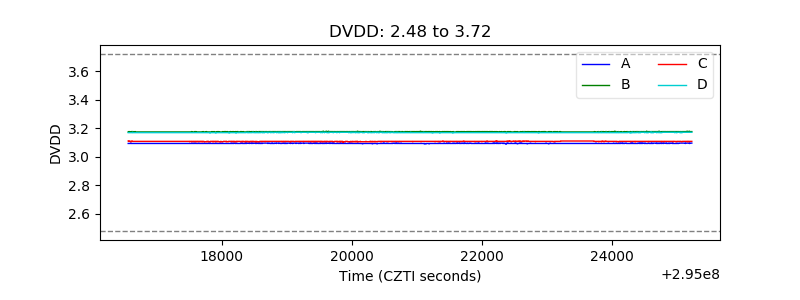 |
| Temperature 1 | 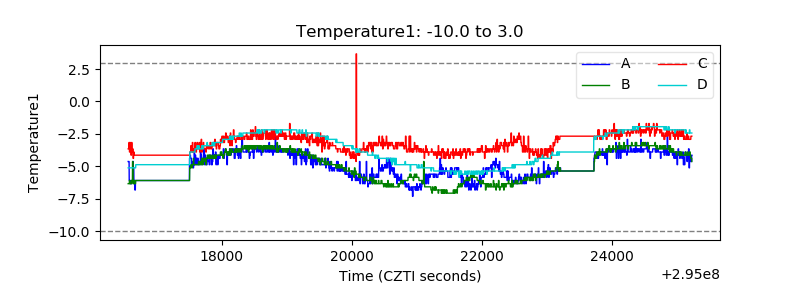 |
| Veto HV Monitor | 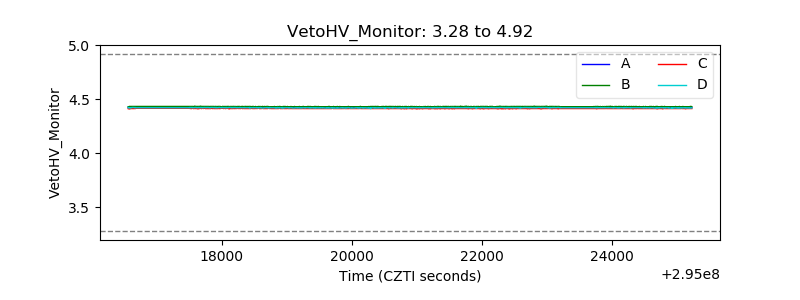 |
| Veto LLD | 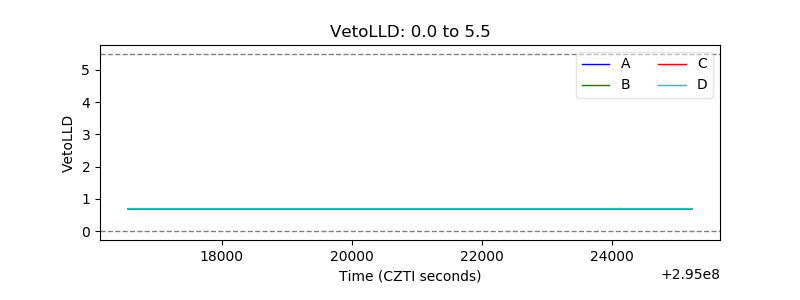 |
| Alpha Counter | 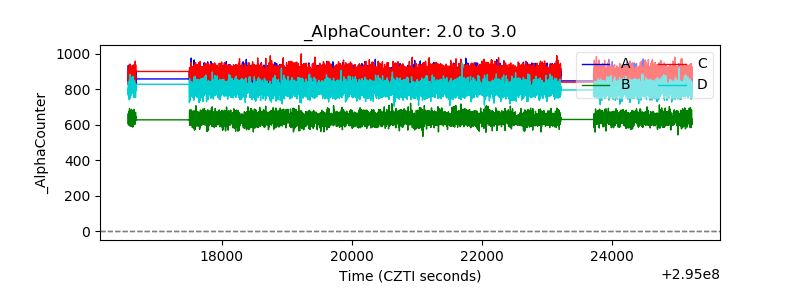 |
| _CPM_Rate | 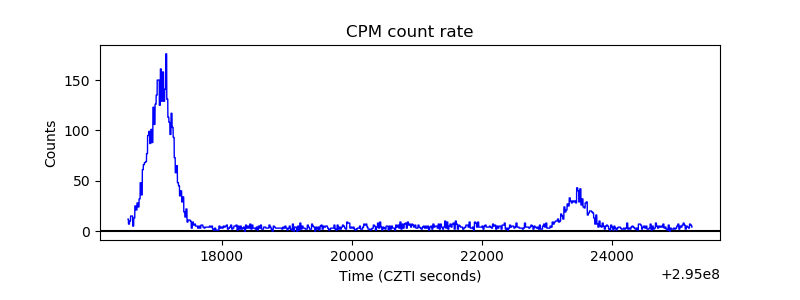 |
| CZT Counter |  |
| +2.5 Volts monitor |  |
| +5 Volts monitor |  |
| _ROLL_ROT | 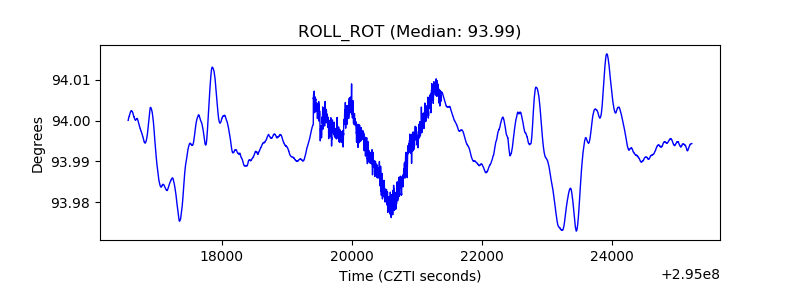 |
| _Roll_DEC | 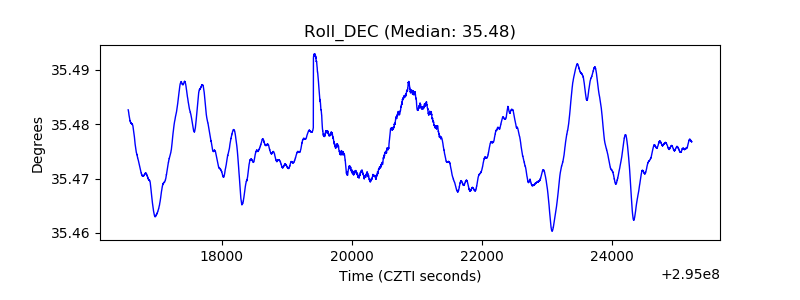 |
| _Roll_RA | 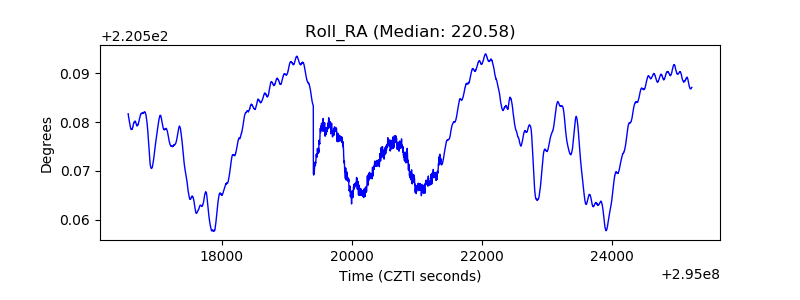 |
| Veto Counter | 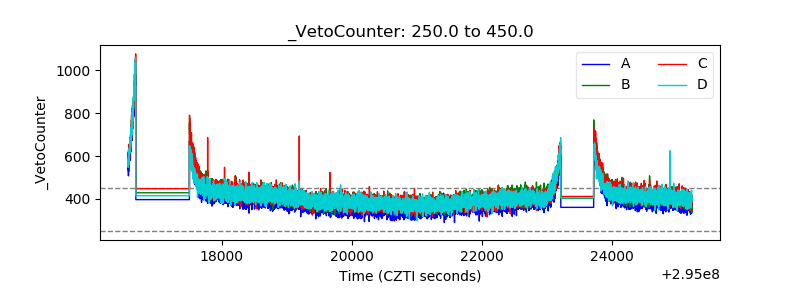 |