| Param | Original file | Final file |
|---|---|---|
| Filename | modeM0/AS1A05_175T01_9000002894_19516cztM0_level2.evt | modeM0/AS1A05_175T01_9000002894_19516cztM0_level2_quad_clean.evt |
| Size (bytes) | 700,122,240 | 96,387,840 |
| Size | 667.7 MB | 91.9 MB |
| Events in quadrant A | 3,530,833 | 649,256 |
| Events in quadrant B | 3,589,978 | 651,174 |
| Events in quadrant C | 3,817,512 | 619,510 |
| Events in quadrant D | 9,759,087 | 478,443 |
| Mode M9 | |||
|---|---|---|---|
| Quadrant | BADHDUFLAG | Total packets | Discarded packets |
| A | 0 | 2 | 0 |
| B | 0 | 2 | 0 |
| C | 0 | 2 | 0 |
| D | 0 | 2 | 0 |
| Mode M0 | |||
|---|---|---|---|
| Quadrant | BADHDUFLAG | Total packets | Discarded packets |
| A | 0 | 15425 | 2 |
| B | 0 | 15527 | 2 |
| C | 0 | 16015 | 2 |
| D | 0 | 34007 | 2 |
| Mode SS | |||
|---|---|---|---|
| Quadrant | BADHDUFLAG | Total packets | Discarded packets |
| A | 0 | 154 | 0 |
| B | 0 | 154 | 0 |
| C | 0 | 154 | 0 |
| D | 0 | 154 | 0 |
| Quadrant | Total seconds | Saturated seconds | Saturation percentage |
|---|---|---|---|
| A | 7458 | 91 | 1.220166% |
| B | 7458 | 133 | 1.783320% |
| C | 7458 | 170 | 2.279431% |
| D | 7458 | 2227 | 29.860552% |
Noise dominated data is calculated using 1-second bins in cleaned event files. If a bin has >2000 counts, and if more than 50% of those come from <1% of pixels, then it is considered to be noise-dominated and hence unusable.
| Quadrant | # 1 sec bins | Bins with >0 counts | Bins with >2000 counts | High rate bins dominated by noise | Noise dominated (total time) | Noise dominated (detector-on time) | Marked lightcurve |
|---|---|---|---|---|---|---|---|
| A | 7703 | 7459 | 0 | 0 | 0.00% | 0.00% | 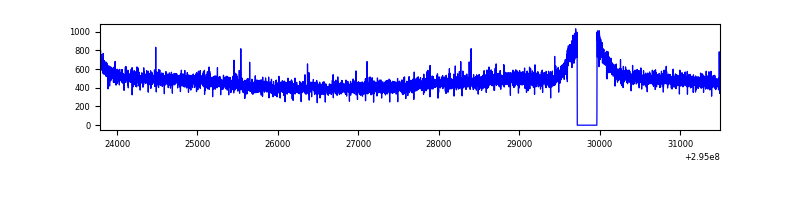 |
| B | 7703 | 7459 | 2 | 2 | 0.03% | 0.03% | 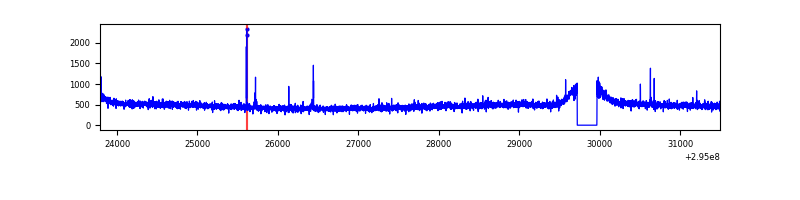 |
| C | 7703 | 7459 | 0 | 0 | 0.00% | 0.00% | 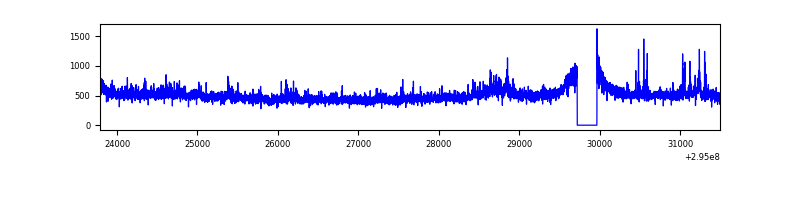 |
| D | 7702 | 7458 | 2062 | 2062 | 26.77% | 27.65% | 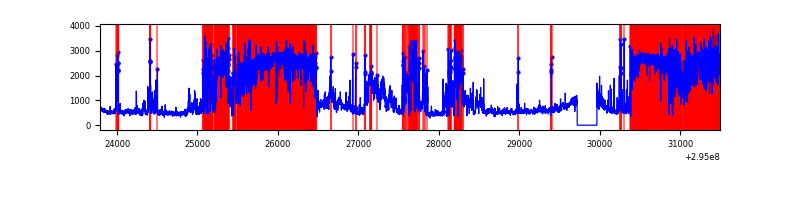 |
Top three noisy pixels from each quadrant. If the there are fewer than three noisy pixels in the level2.evt file, extra rows are filled as -1
| Pixel properties | Quadrant properties | ||||||
|---|---|---|---|---|---|---|---|
| Quadrant | DetID | PixID | Counts | Sigma | Mean | Median | Sigma |
| A | 13 | 254 | 9068 | 44.13 | 915 | 894 | 185.2 |
| A | 0 | 226 | 7961 | 38.15 | 915 | 894 | 185.2 |
| A | 3 | 137 | 7810 | 37.34 | 915 | 894 | 185.2 |
| B | 12 | 111 | 21746 | 119.32 | 906 | 880 | 174.9 |
| B | 11 | 111 | 19406 | 105.94 | 906 | 880 | 174.9 |
| B | 14 | 111 | 16807 | 91.08 | 906 | 880 | 174.9 |
| C | 3 | 233 | 240114 | 1172.69 | 874 | 879 | 204.0 |
| C | 14 | 238 | 136313 | 663.88 | 874 | 879 | 204.0 |
| C | 9 | 221 | 31926 | 152.19 | 874 | 879 | 204.0 |
| D | 7 | 238 | 6187912 | 32175.15 | 787 | 762 | 192.3 |
| D | 12 | 218 | 292006 | 1514.56 | 787 | 762 | 192.3 |
| D | 1 | 52 | 249703 | 1294.57 | 787 | 762 | 192.3 |
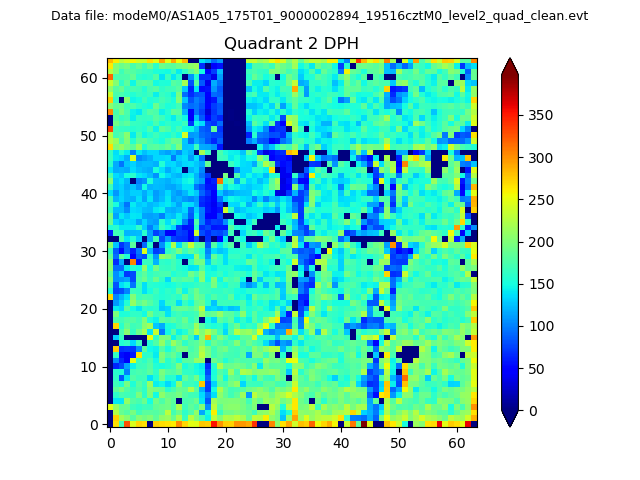
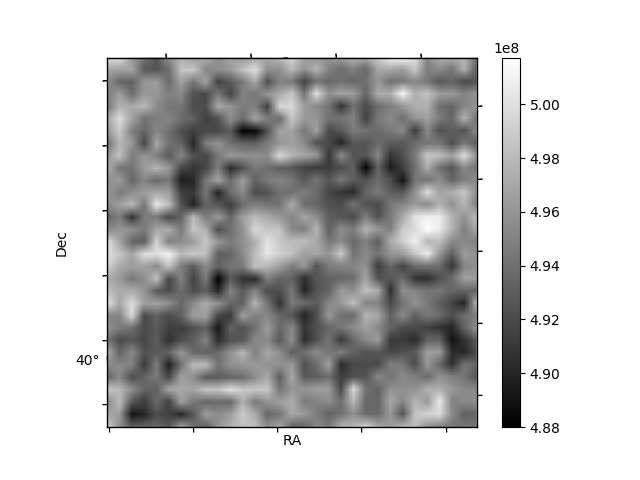
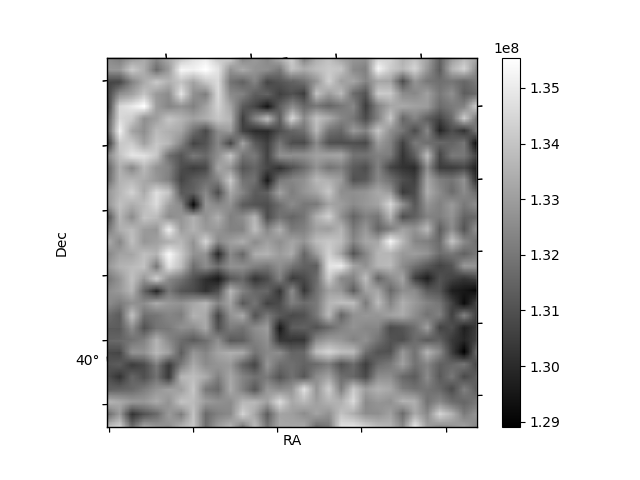
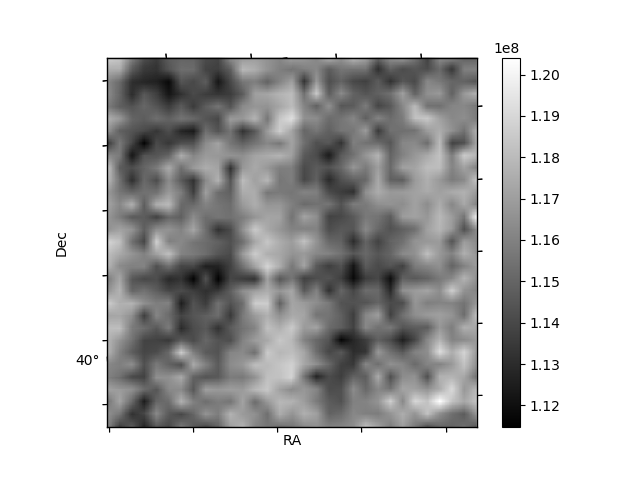
Histogram calculated using DETX and DETY for each event in the final _common_clean file
| Quadrant A | 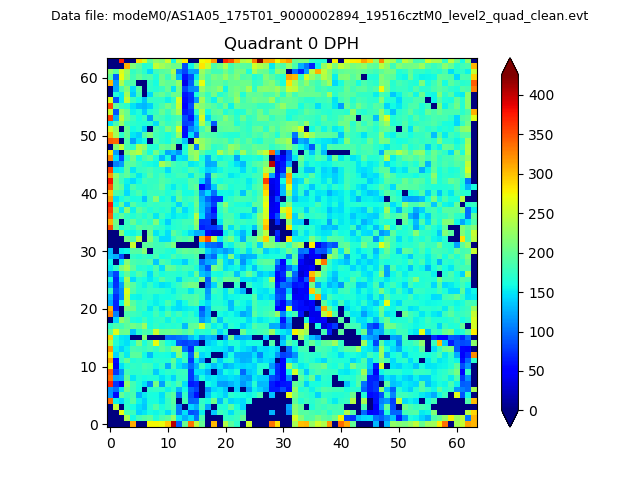 |
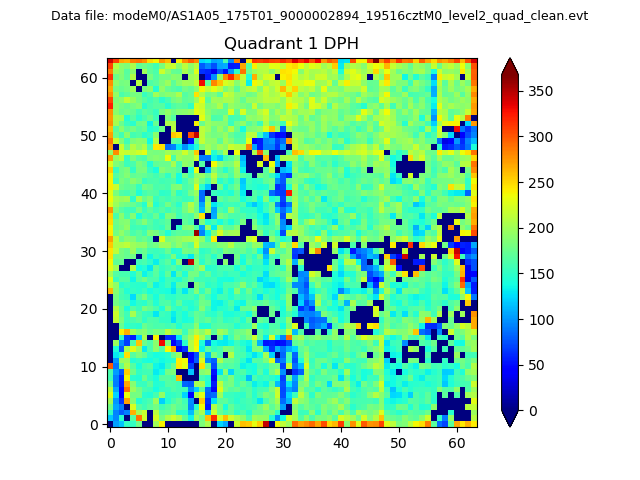 |
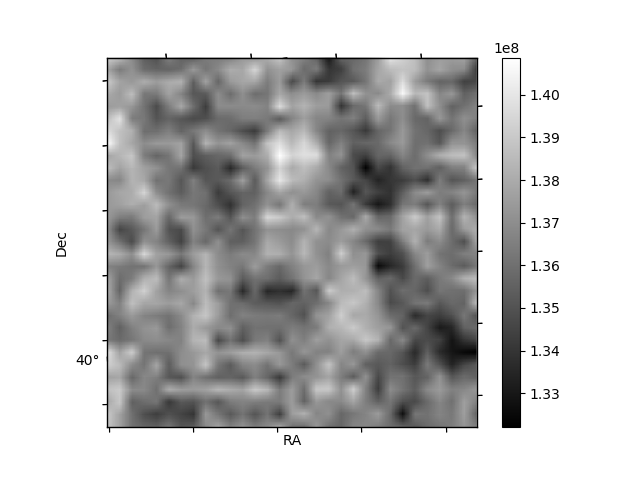
Quadrant B |
|---|---|---|---|
| Quadrant D | 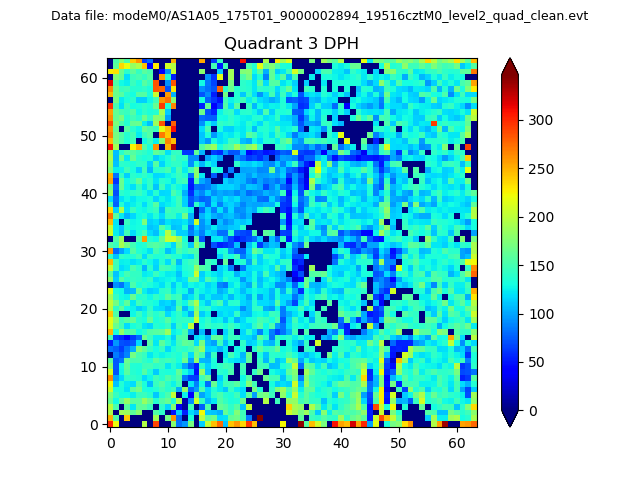 |
 |
Quadrant C |
| Plot type | Count rate plots | Images |
|---|---|---|
| Comparison with Poisson distribution Blue bars denote a histogram of data divided into 1 sec bins. Red curve is a Poisson curve with rate = median count rate of data. |
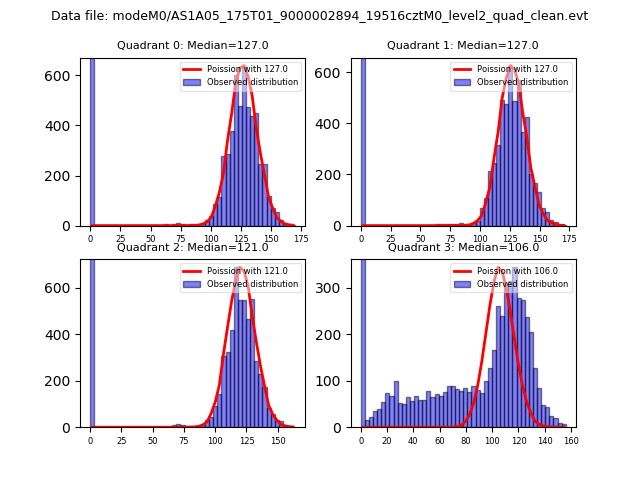 |
 |
| Quadrant-wise count rates Data is divided into 100 sec bins |
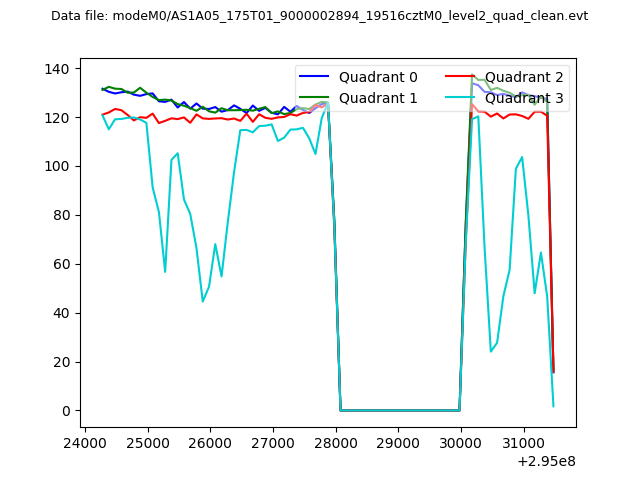 |
|
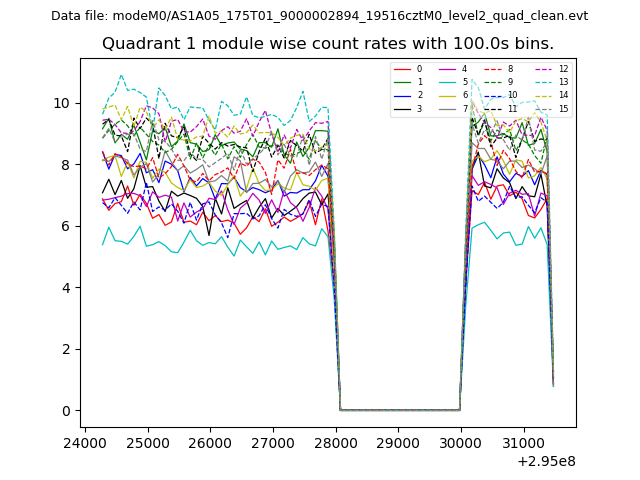
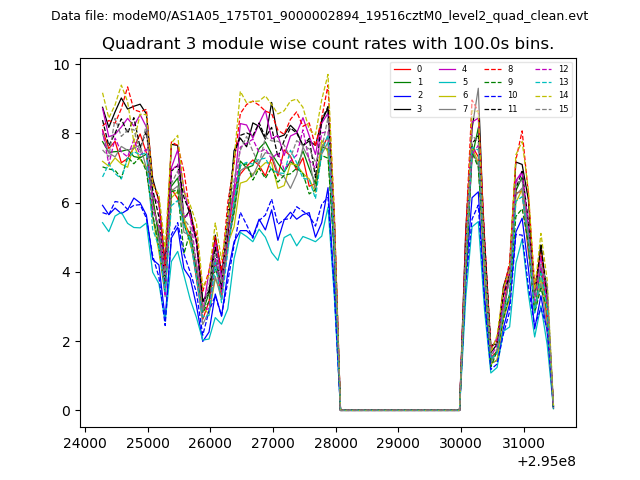
| Module-wise count rates for Quadrant A Data is divided into 100 sec bins |
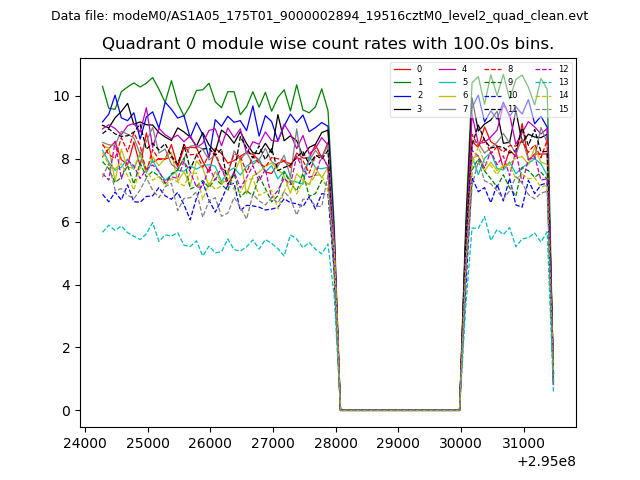 |
 |
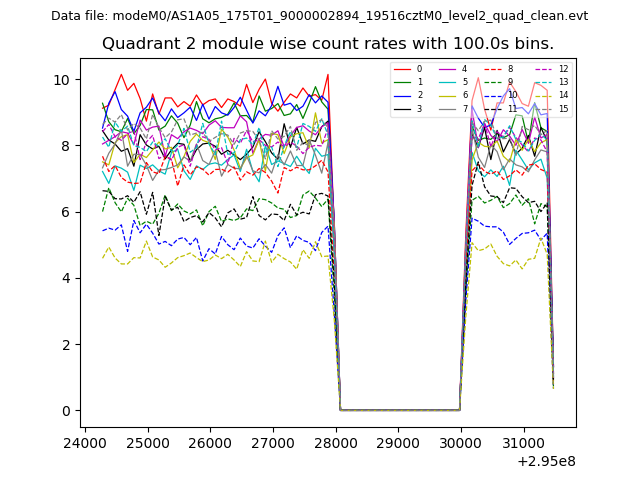
| Module-wise count rates for Quadrant B Data is divided into 100 sec bins |
 |
 |
| Module-wise count rates for Quadrant C Data is divided into 100 sec bins |
 |
 |
| Module-wise count rates for Quadrant D Data is divided into 100 sec bins |
 |
 |
| Parameter | Plot |
|---|---|
| CZT HV Monitor | 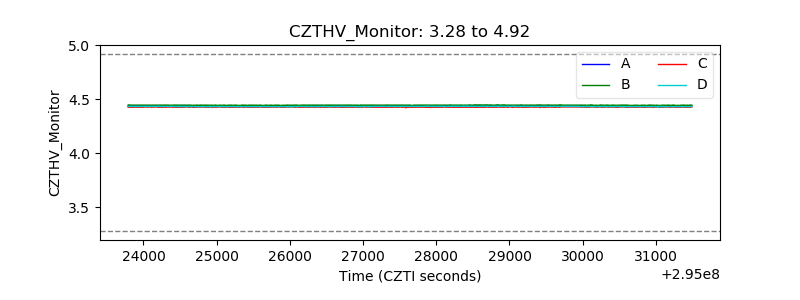 |
| D_VDD | 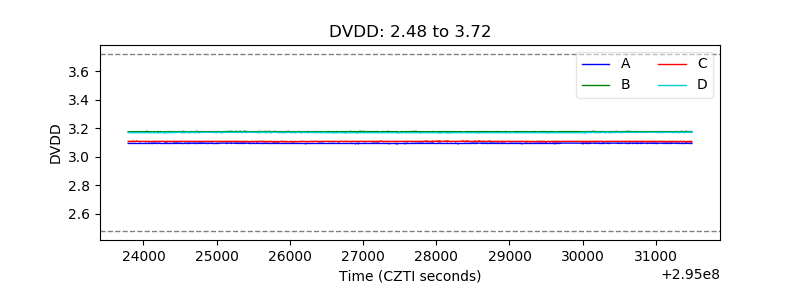 |
| Temperature 1 | 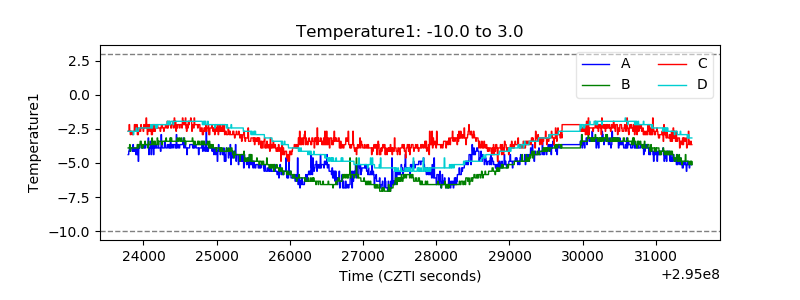 |
| Veto HV Monitor | 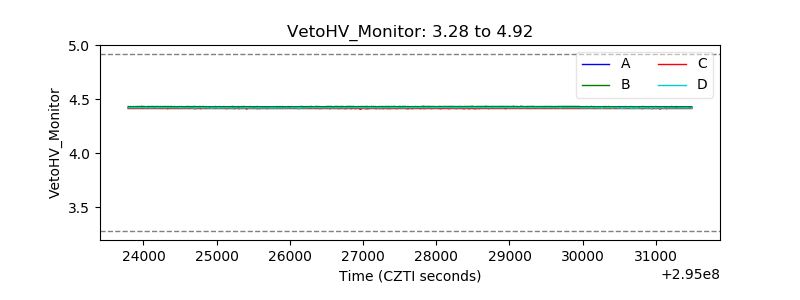 |
| Veto LLD | 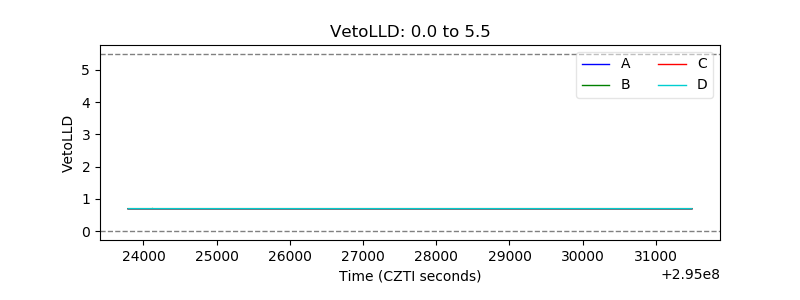 |
| Alpha Counter | 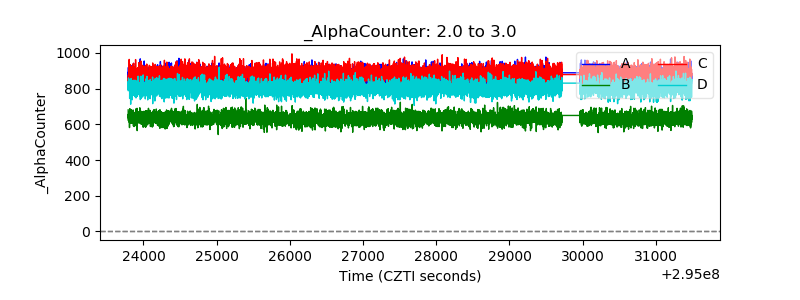 |
| _CPM_Rate | 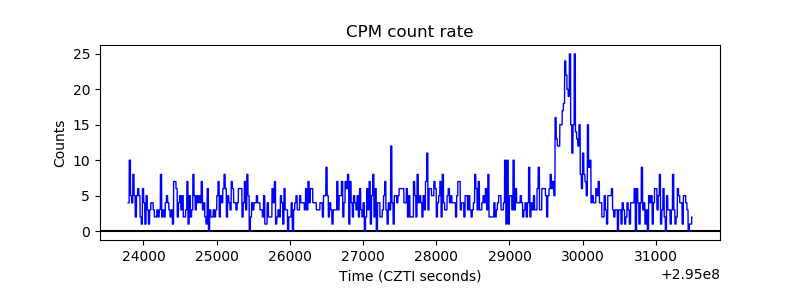 |
| CZT Counter | 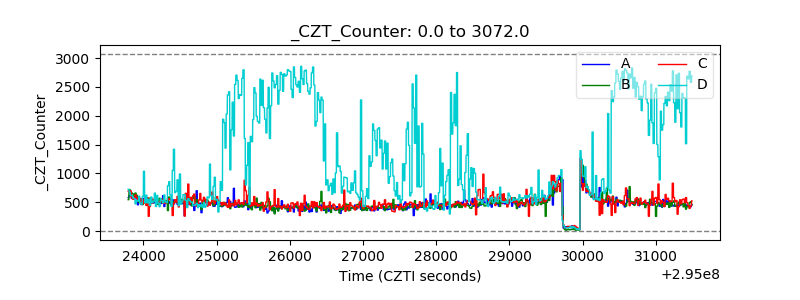 |
| +2.5 Volts monitor |  |
| +5 Volts monitor |  |
| _ROLL_ROT | 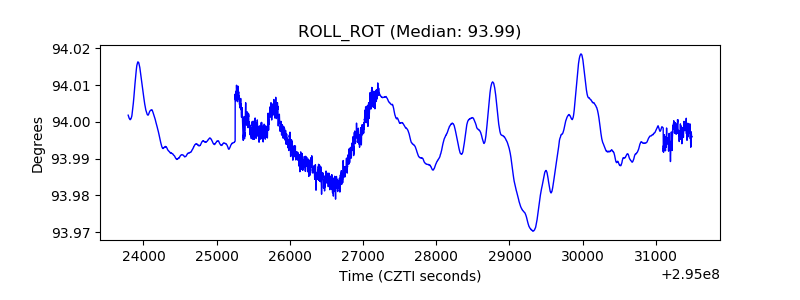 |
| _Roll_DEC | 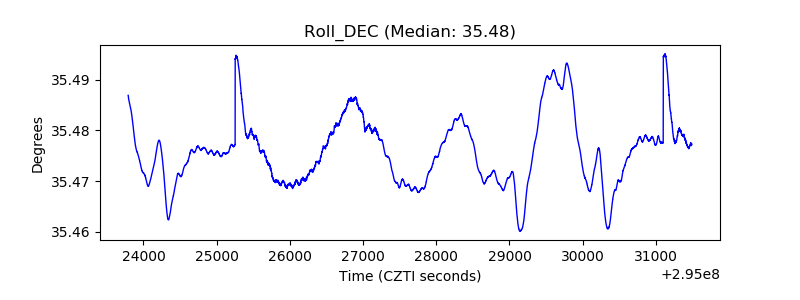 |
| _Roll_RA | 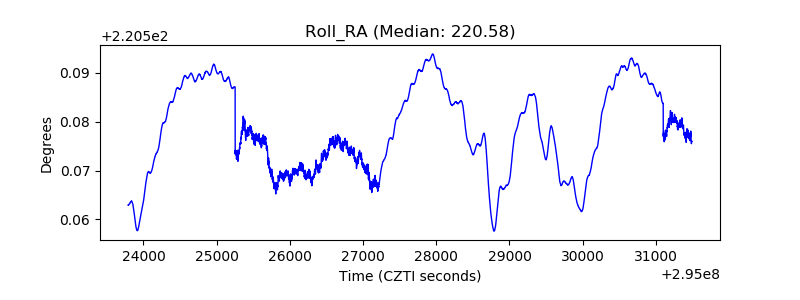 |
| Veto Counter | 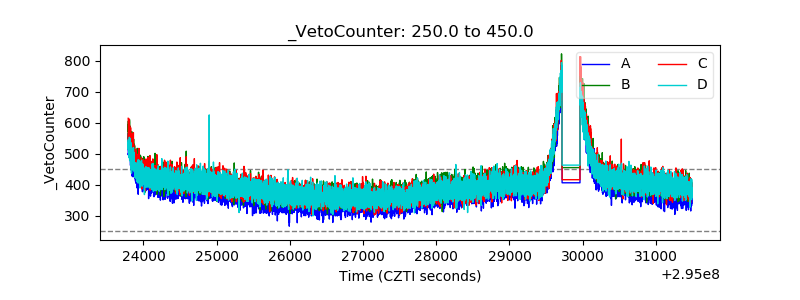 |