| Param | Original file | Final file |
|---|---|---|
| Filename | modeM0/AS1A05_175T01_9000002894_19520cztM0_level2.evt | modeM0/AS1A05_175T01_9000002894_19520cztM0_level2_quad_clean.evt |
| Size (bytes) | 841,008,960 | 92,246,400 |
| Size | 802.0 MB | 88.0 MB |
| Events in quadrant A | 3,370,474 | 660,508 |
| Events in quadrant B | 3,471,344 | 664,481 |
| Events in quadrant C | 3,564,714 | 633,800 |
| Events in quadrant D | 14,568,863 | 323,792 |
| Mode M9 | |||
|---|---|---|---|
| Quadrant | BADHDUFLAG | Total packets | Discarded packets |
| A | 0 | 4 | 0 |
| B | 0 | 4 | 0 |
| C | 0 | 4 | 0 |
| D | 0 | 4 | 0 |
| Mode M0 | |||
|---|---|---|---|
| Quadrant | BADHDUFLAG | Total packets | Discarded packets |
| A | 0 | 14946 | 1 |
| B | 0 | 15134 | 1 |
| C | 0 | 15269 | 1 |
| D | 0 | 48308 | 1 |
| Mode SS | |||
|---|---|---|---|
| Quadrant | BADHDUFLAG | Total packets | Discarded packets |
| A | 0 | 148 | 0 |
| B | 0 | 148 | 0 |
| C | 0 | 148 | 0 |
| D | 0 | 148 | 0 |
| Quadrant | Total seconds | Saturated seconds | Saturation percentage |
|---|---|---|---|
| A | 7314 | 39 | 0.533224% |
| B | 7315 | 40 | 0.546822% |
| C | 7315 | 91 | 1.244019% |
| D | 7315 | 4406 | 60.232399% |
Noise dominated data is calculated using 1-second bins in cleaned event files. If a bin has >2000 counts, and if more than 50% of those come from <1% of pixels, then it is considered to be noise-dominated and hence unusable.
| Quadrant | # 1 sec bins | Bins with >0 counts | Bins with >2000 counts | High rate bins dominated by noise | Noise dominated (total time) | Noise dominated (detector-on time) | Marked lightcurve |
|---|---|---|---|---|---|---|---|
| A | 7709 | 7315 | 0 | 0 | 0.00% | 0.00% | 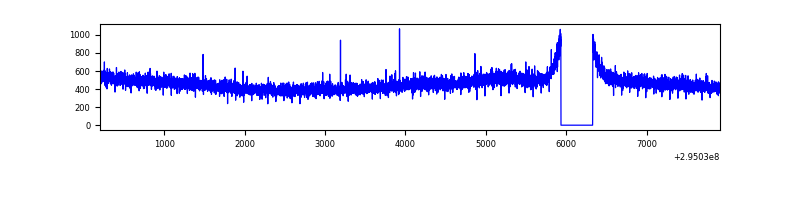 |
| B | 7710 | 7316 | 0 | 0 | 0.00% | 0.00% | 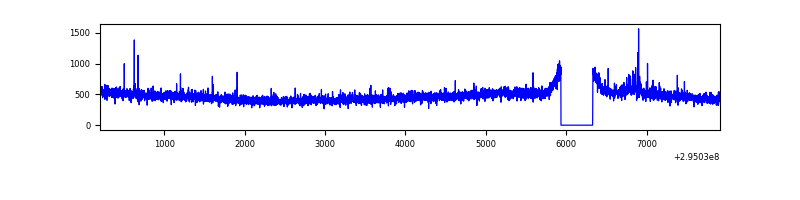 |
| C | 7710 | 7316 | 3 | 3 | 0.04% | 0.04% | 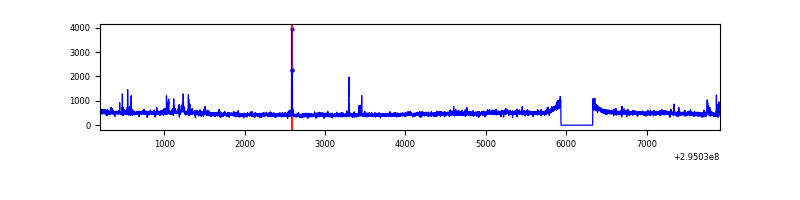 |
| D | 7709 | 7315 | 4253 | 4253 | 55.17% | 58.14% | 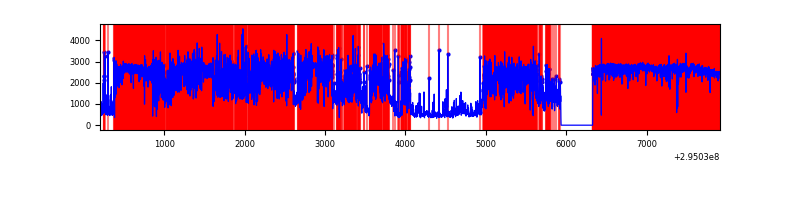 |
Top three noisy pixels from each quadrant. If the there are fewer than three noisy pixels in the level2.evt file, extra rows are filled as -1
| Pixel properties | Quadrant properties | ||||||
|---|---|---|---|---|---|---|---|
| Quadrant | DetID | PixID | Counts | Sigma | Mean | Median | Sigma |
| A | 13 | 254 | 8501 | 43.37 | 873 | 855 | 176.3 |
| A | 0 | 226 | 7465 | 37.5 | 873 | 855 | 176.3 |
| A | 3 | 137 | 7193 | 35.95 | 873 | 855 | 176.3 |
| B | 10 | 247 | 44517 | 259.61 | 870 | 845 | 168.2 |
| B | 12 | 111 | 20521 | 116.96 | 870 | 845 | 168.2 |
| B | 11 | 111 | 18343 | 104.02 | 870 | 845 | 168.2 |
| C | 3 | 233 | 137750 | 697.09 | 840 | 845 | 196.4 |
| C | 14 | 238 | 130446 | 659.9 | 840 | 845 | 196.4 |
| C | 9 | 54 | 15447 | 74.35 | 840 | 845 | 196.4 |
| D | 7 | 238 | 12098452 | 87468.7 | 570 | 553 | 138.3 |
| D | 1 | 52 | 146525 | 1055.39 | 570 | 553 | 138.3 |
| D | 12 | 218 | 142142 | 1023.7 | 570 | 553 | 138.3 |
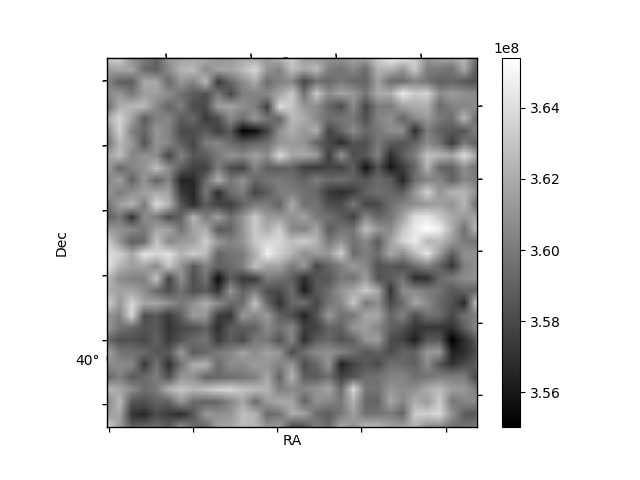
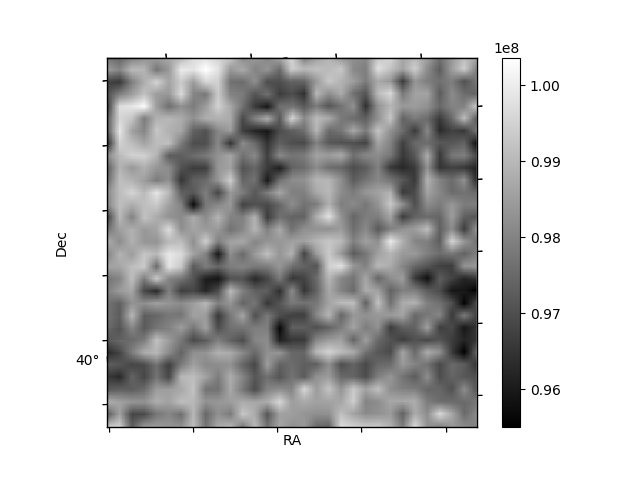
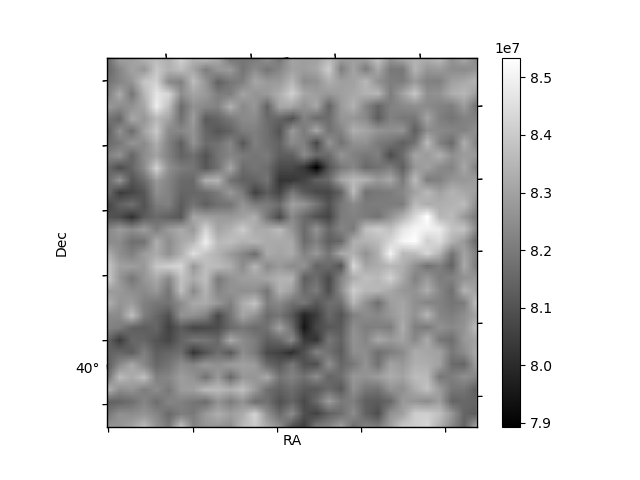
Histogram calculated using DETX and DETY for each event in the final _common_clean file
| Quadrant A | 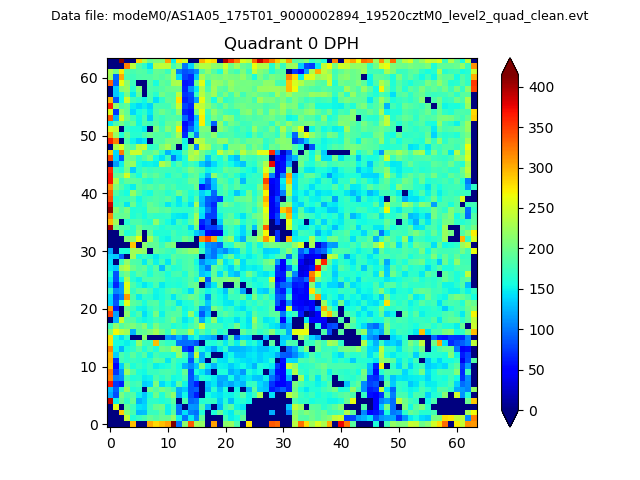 |
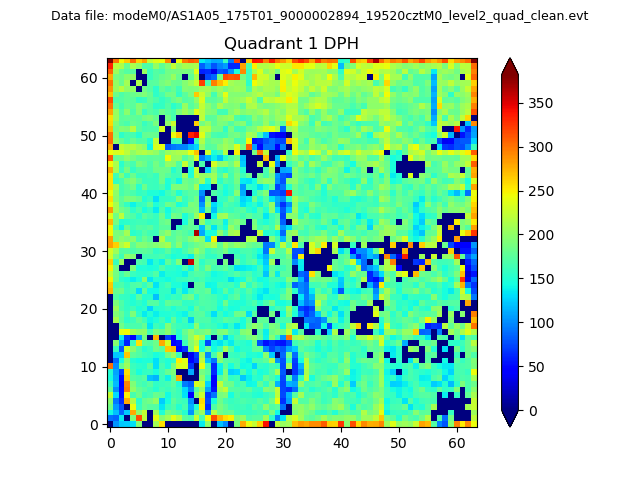 |
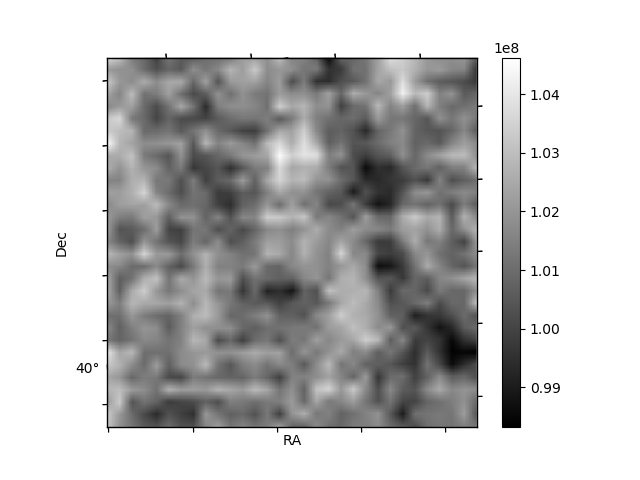
Quadrant B |
|---|---|---|---|
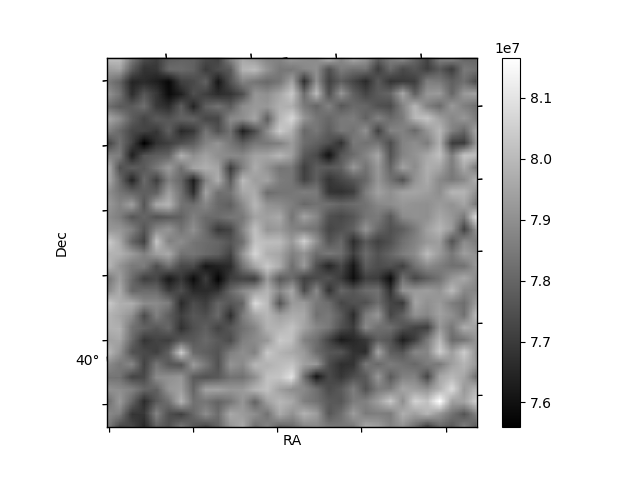
| Quadrant D | 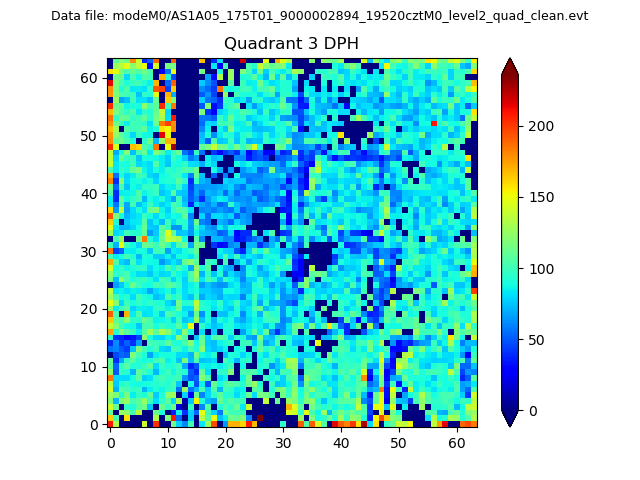 |
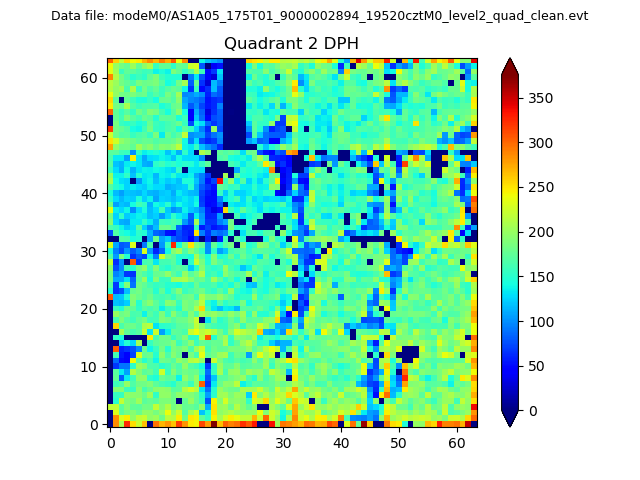 |
Quadrant C |
| Plot type | Count rate plots | Images |
|---|---|---|
| Comparison with Poisson distribution Blue bars denote a histogram of data divided into 1 sec bins. Red curve is a Poisson curve with rate = median count rate of data. |
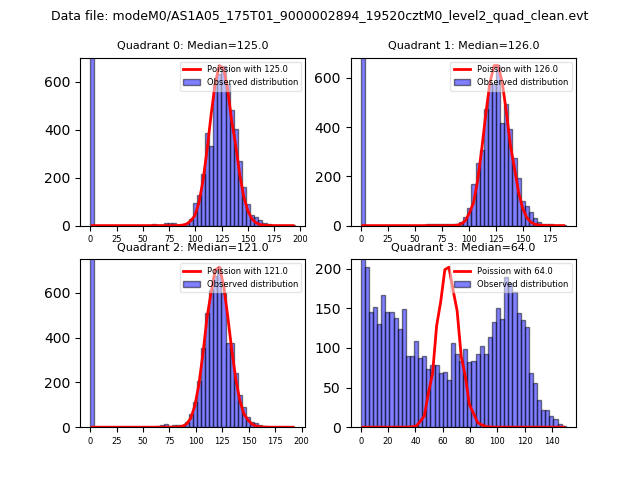 |
 |
| Quadrant-wise count rates Data is divided into 100 sec bins |
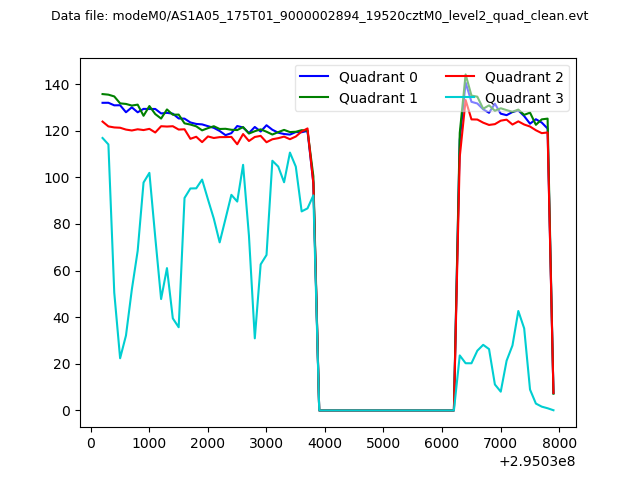 |
|
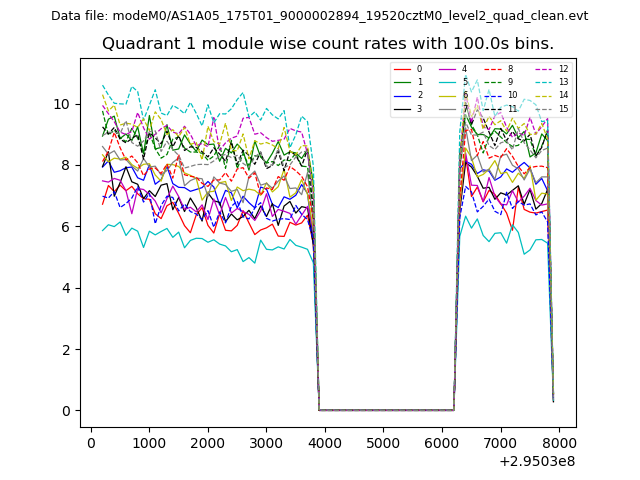
| Module-wise count rates for Quadrant A Data is divided into 100 sec bins |
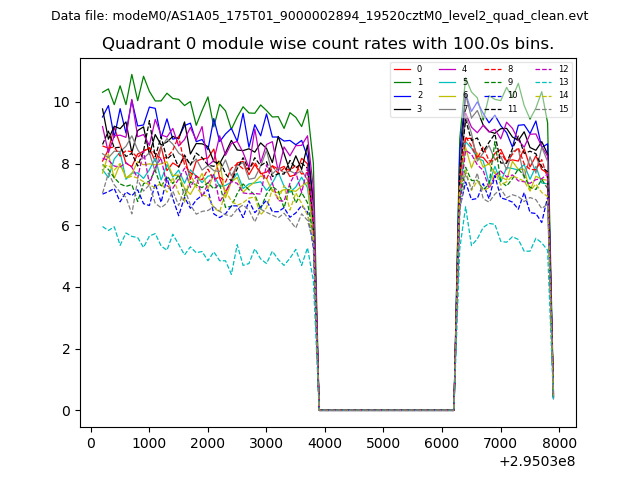 |
 |
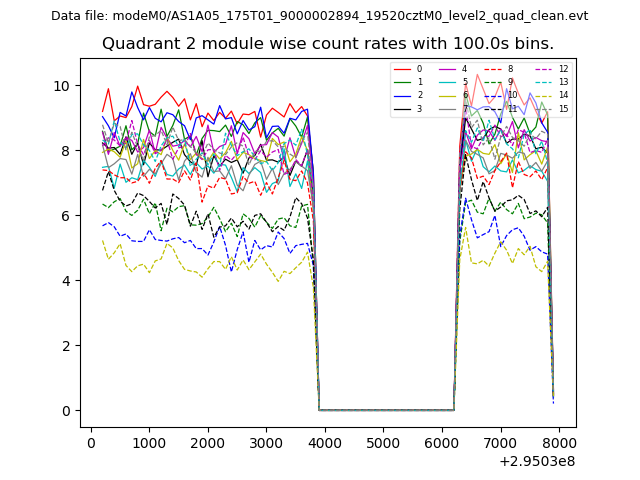
| Module-wise count rates for Quadrant B Data is divided into 100 sec bins |
 |
 |
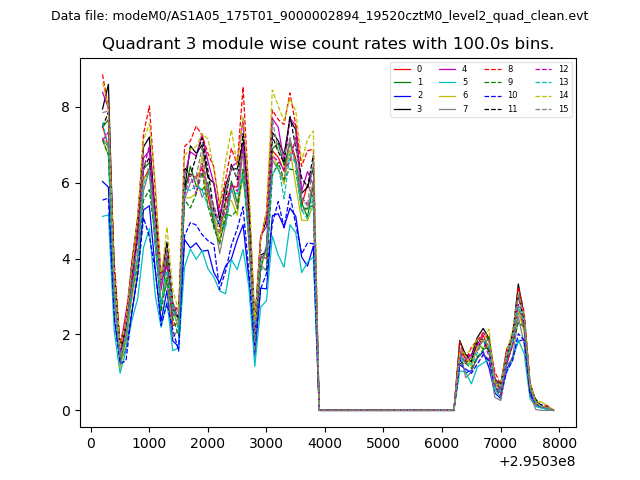
| Module-wise count rates for Quadrant C Data is divided into 100 sec bins |
 |
 |
| Module-wise count rates for Quadrant D Data is divided into 100 sec bins |
 |
 |
| Parameter | Plot |
|---|---|
| CZT HV Monitor | 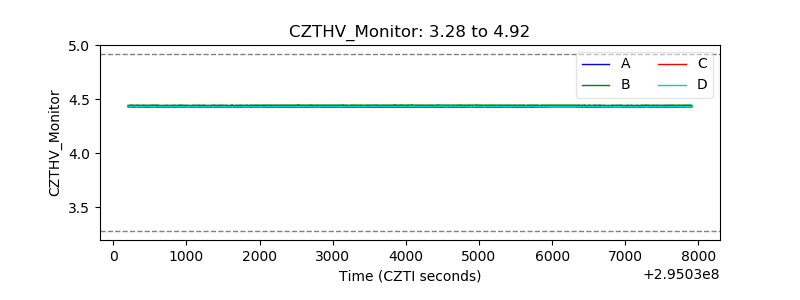 |
| D_VDD |  |
| Temperature 1 | 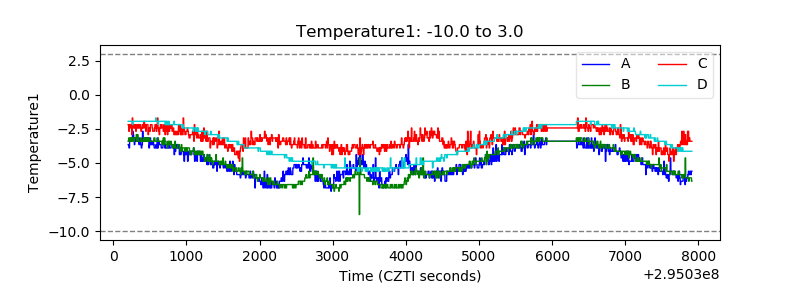 |
| Veto HV Monitor | 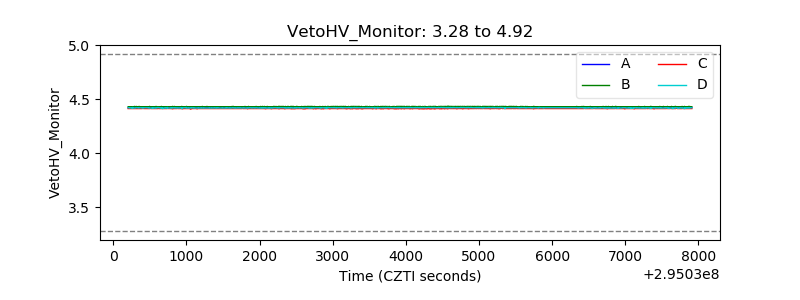 |
| Veto LLD | 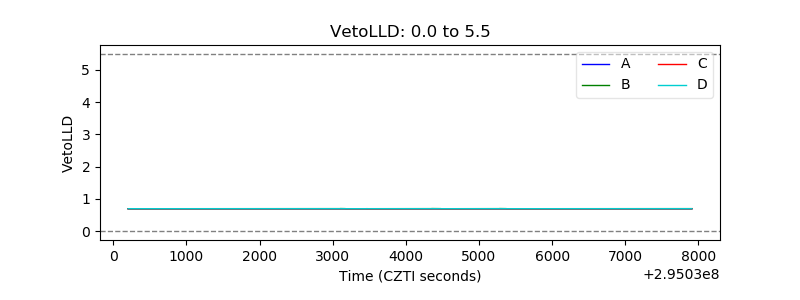 |
| Alpha Counter | 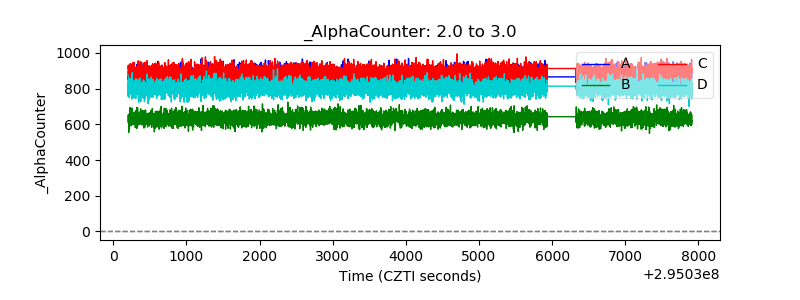 |
| _CPM_Rate | 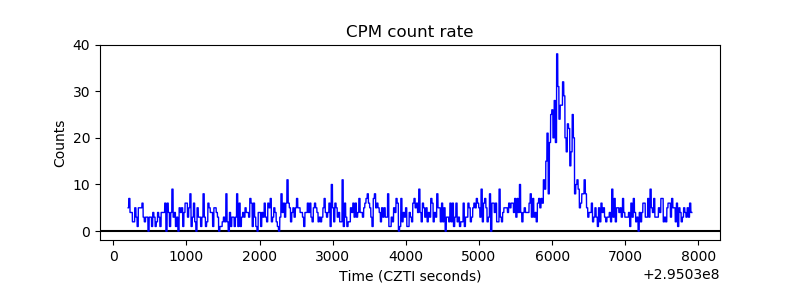 |
| CZT Counter | 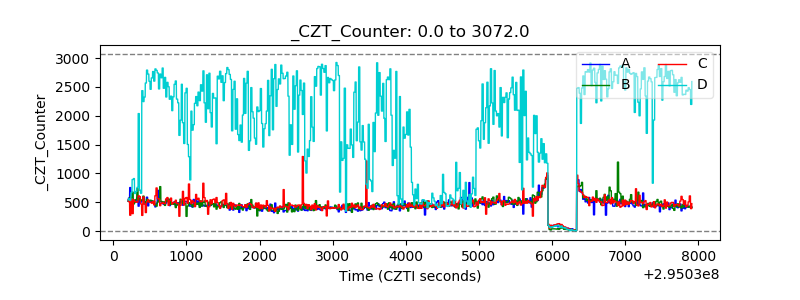 |
| +2.5 Volts monitor | 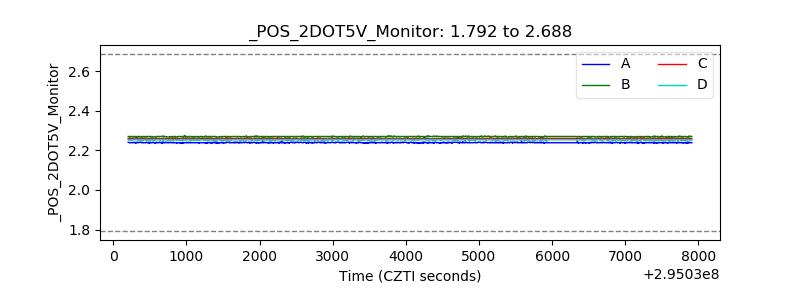 |
| +5 Volts monitor | 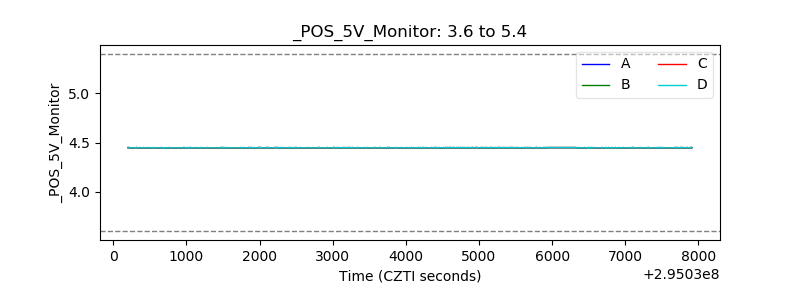 |
| _ROLL_ROT | 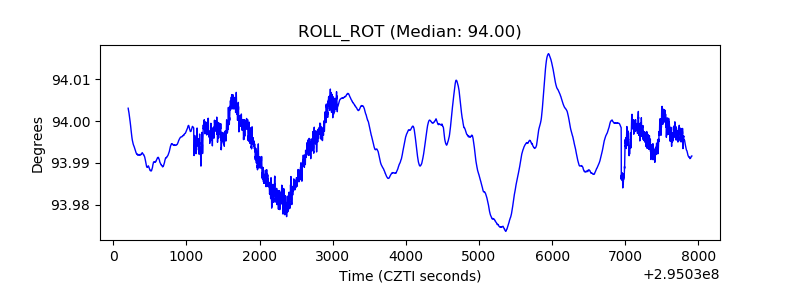 |
| _Roll_DEC | 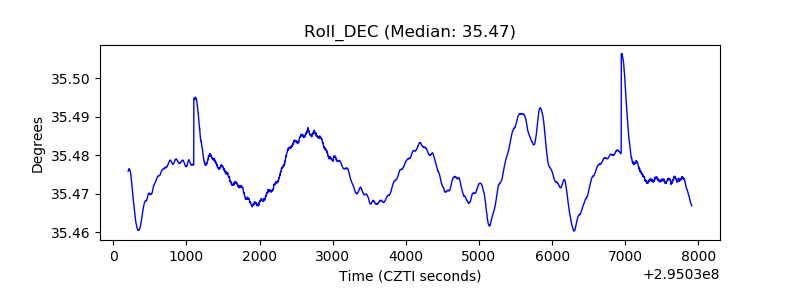 |
| _Roll_RA | 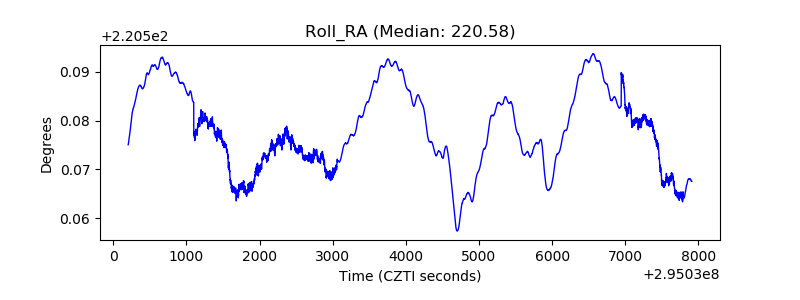 |
| Veto Counter | 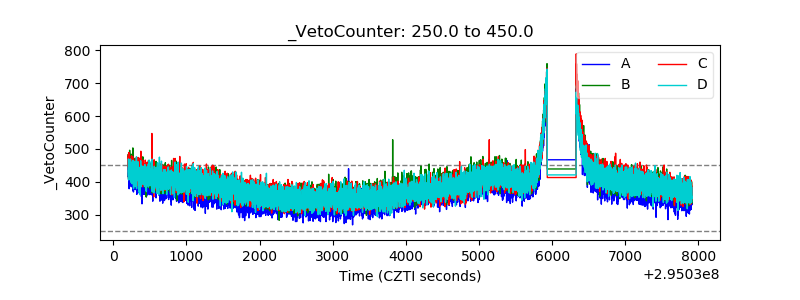 |