| Param | Original file | Final file |
|---|---|---|
| Filename | modeM0/AS1A05_101T05_9000002902cztM0_level2.fits | modeM0/AS1A05_101T05_9000002902cztM0_level2_quad_clean.evt |
| Size (bytes) | 185,391,360 | 229,322,880 |
| Size | 176.8 MB | 218.7 MB |
| Events in quadrant A | 1,121,540 | 1,459,451 |
| Events in quadrant B | 1,073,814 | 1,456,018 |
| Events in quadrant C | 1,089,674 | 1,377,578 |
| Events in quadrant D | 951,300 | 1,273,682 |
| Mode SS | |||
|---|---|---|---|
| Quadrant | BADHDUFLAG | Total packets | Discarded packets |
| A | 0 | 408 | 0 |
| B | 0 | 408 | 0 |
| C | 0 | 408 | 0 |
| D | 0 | 408 | 0 |
| Mode M9 | |||
|---|---|---|---|
| Quadrant | BADHDUFLAG | Total packets | Discarded packets |
| A | 0 | 23 | 0 |
| B | 0 | 23 | 0 |
| C | 0 | 23 | 0 |
| D | 0 | 23 | 0 |
| Mode M0 | |||
|---|---|---|---|
| Quadrant | BADHDUFLAG | Total packets | Discarded packets |
| A | 0 | 40473 | 0 |
| B | 0 | 41363 | 0 |
| C | 0 | 42409 | 0 |
| D | 0 | 46823 | 0 |
| Quadrant | Total seconds | Saturated seconds | Saturation percentage |
|---|---|---|---|
| A | 20008 | 64 | 0.319872% |
| B | 20008 | 138 | 0.689724% |
| C | 20008 | 145 | 0.724710% |
| D | 20008 | 531 | 2.653938% |
Noise dominated data is calculated using 1-second bins in cleaned event files. If a bin has >2000 counts, and if more than 50% of those come from <1% of pixels, then it is considered to be noise-dominated and hence unusable.
| Quadrant | # 1 sec bins | Bins with >0 counts | Bins with >2000 counts | High rate bins dominated by noise | Noise dominated (total time) | Noise dominated (detector-on time) | Marked lightcurve |
|---|---|---|---|---|---|---|---|
| A | 22393 | 20008 | 0 | 0 | 0.00% | 0.00% | 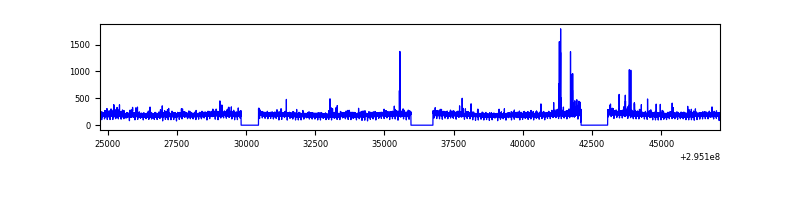 |
| B | 22393 | 20008 | 0 | 0 | 0.00% | 0.00% | 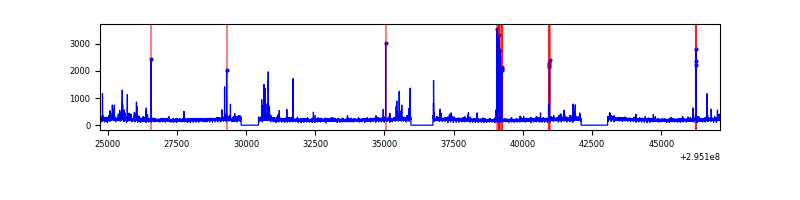 |
| C | 22393 | 20008 | 0 | 0 | 0.00% | 0.00% | 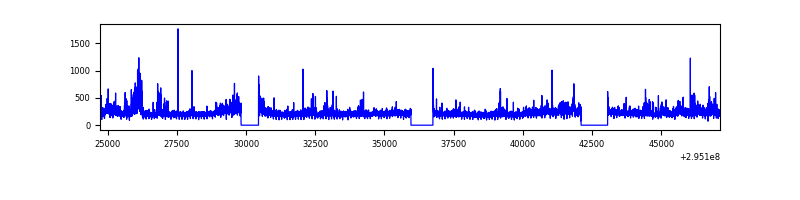 |
| D | 22393 | 20005 | 0 | 0 | 0.00% | 0.00% | 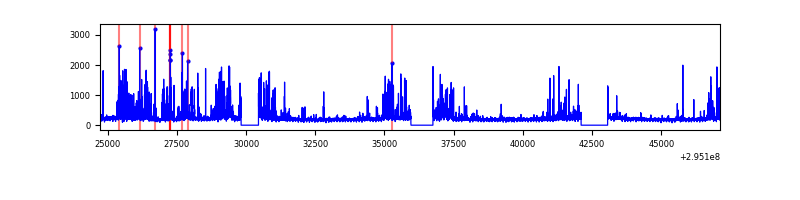 |
Top three noisy pixels from each quadrant. If the there are fewer than three noisy pixels in the level2.evt file, extra rows are filled as -1
| Pixel properties | Quadrant properties | ||||||
|---|---|---|---|---|---|---|---|
| Quadrant | DetID | PixID | Counts | Sigma | Mean | Median | Sigma |
| A | 0 | 29 | 1074 | 10.81 | 292 | 275 | 73.9 |
| A | 7 | 110 | 872 | 8.08 | 292 | 275 | 73.9 |
| A | 0 | 30 | 830 | 7.51 | 292 | 275 | 73.9 |
| B | 2 | 9 | 882 | 10.61 | 283 | 270 | 57.7 |
| B | 2 | 8 | 769 | 8.65 | 283 | 270 | 57.7 |
| B | 5 | 128 | 716 | 7.73 | 283 | 270 | 57.7 |
| C | 7 | 111 | 780 | 6.81 | 287 | 269 | 75.0 |
| C | 12 | 241 | 753 | 6.45 | 287 | 269 | 75.0 |
| C | 12 | 250 | 750 | 6.41 | 287 | 269 | 75.0 |
| D | 3 | 14 | 738 | 6.75 | 270 | 246 | 72.9 |
| D | 15 | 46 | 698 | 6.2 | 270 | 246 | 72.9 |
| D | 15 | 142 | 675 | 5.88 | 270 | 246 | 72.9 |
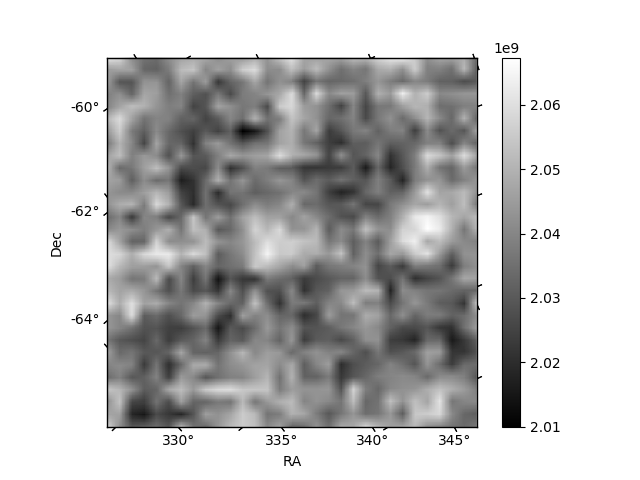
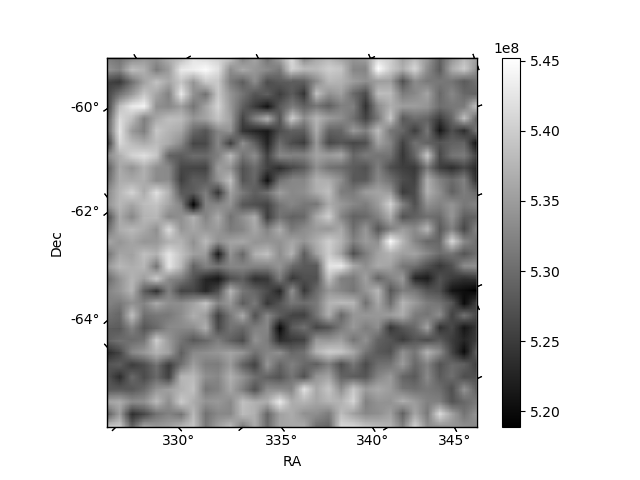
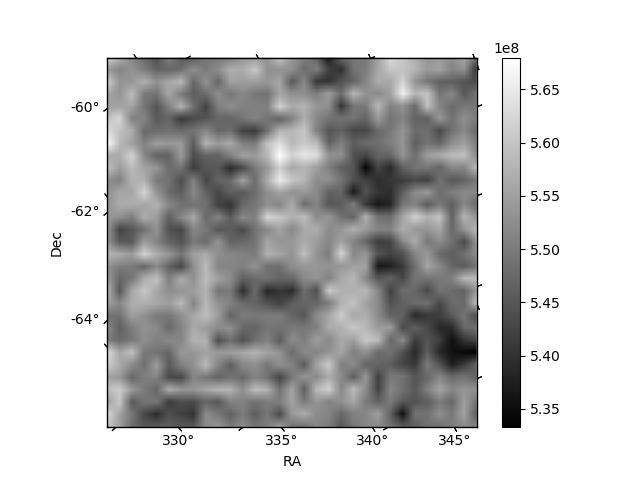
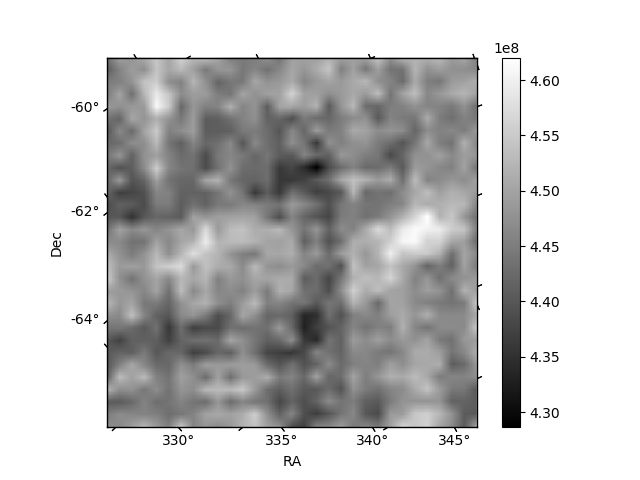
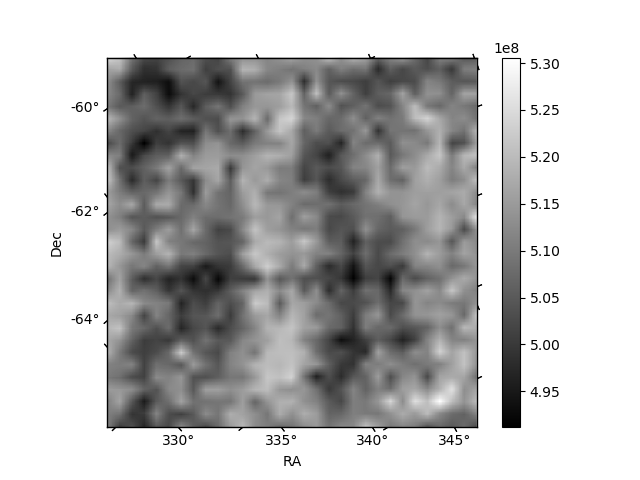
Histogram calculated using DETX and DETY for each event in the final _common_clean file
| Quadrant A | 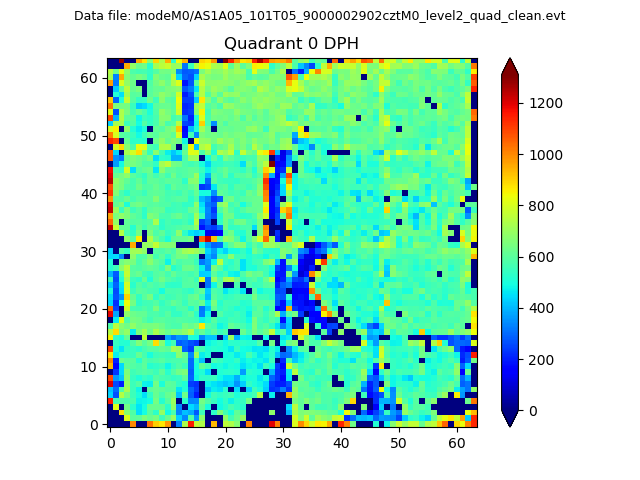 |
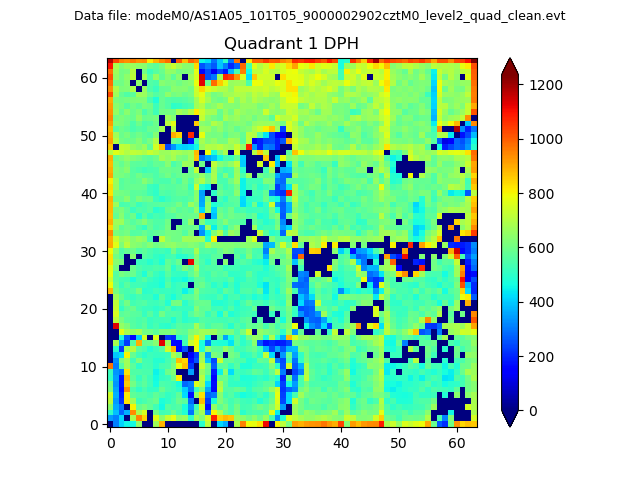 |
Quadrant B |
|---|---|---|---|
| Quadrant D | 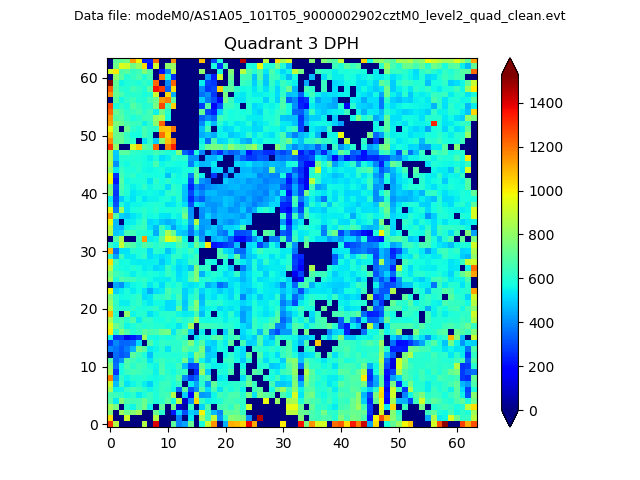 |
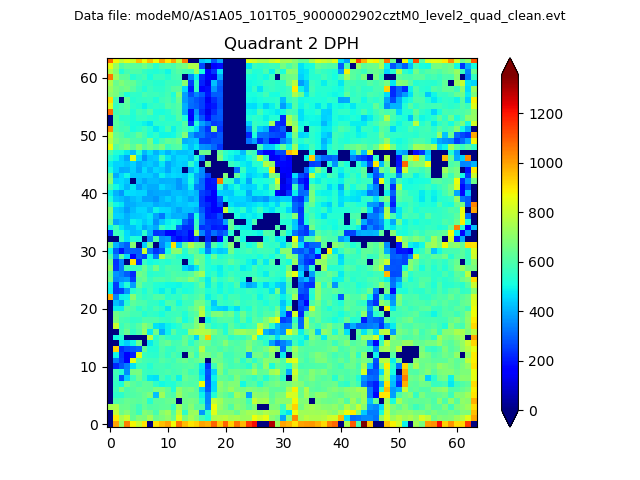 |
Quadrant C |
| Plot type | Count rate plots | Images |
|---|---|---|
| Comparison with Poisson distribution Blue bars denote a histogram of data divided into 1 sec bins. Red curve is a Poisson curve with rate = median count rate of data. |
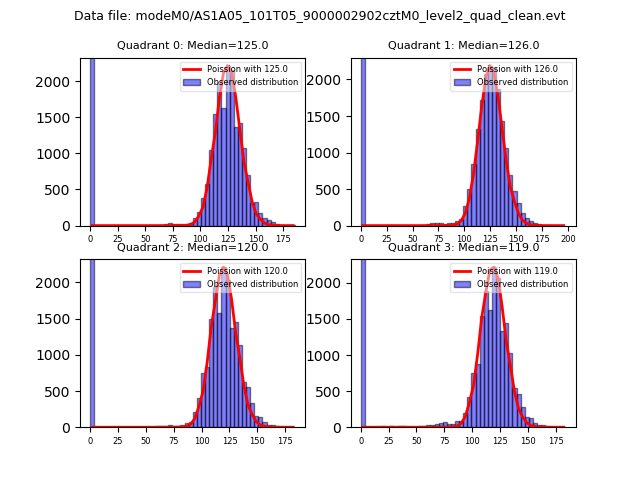 |
 |
| Quadrant-wise count rates Data is divided into 100 sec bins |
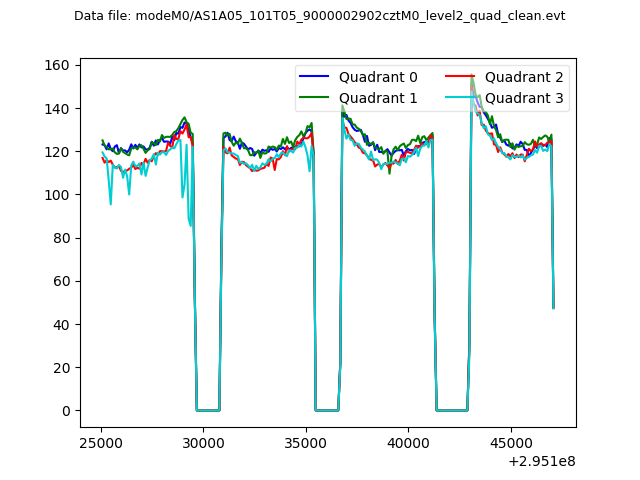 |
|
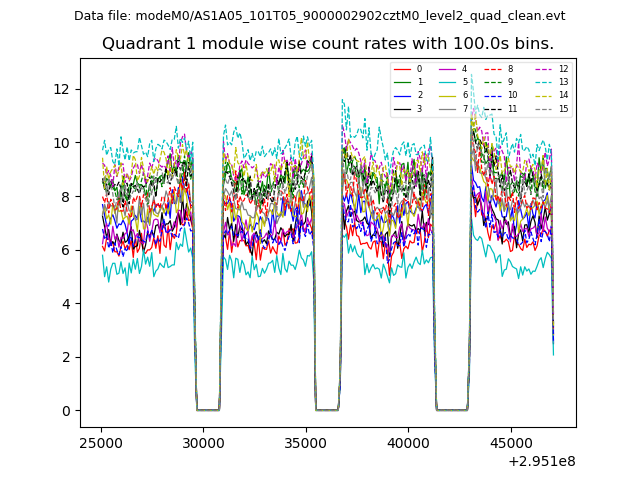
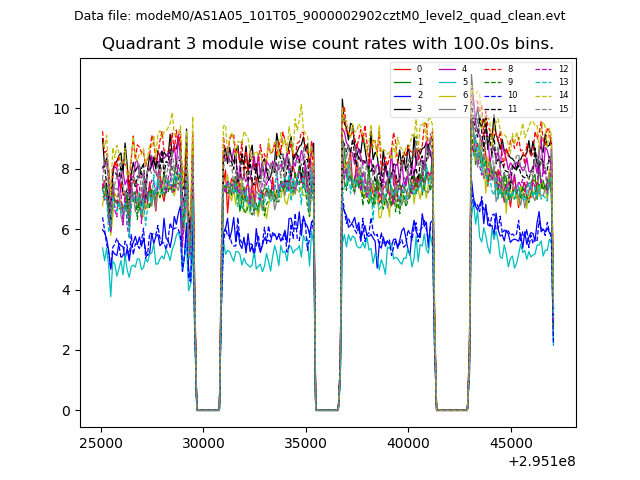
| Module-wise count rates for Quadrant A Data is divided into 100 sec bins |
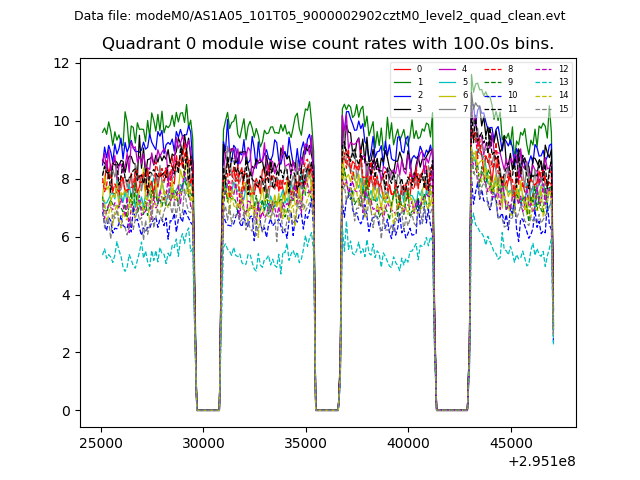 |
 |
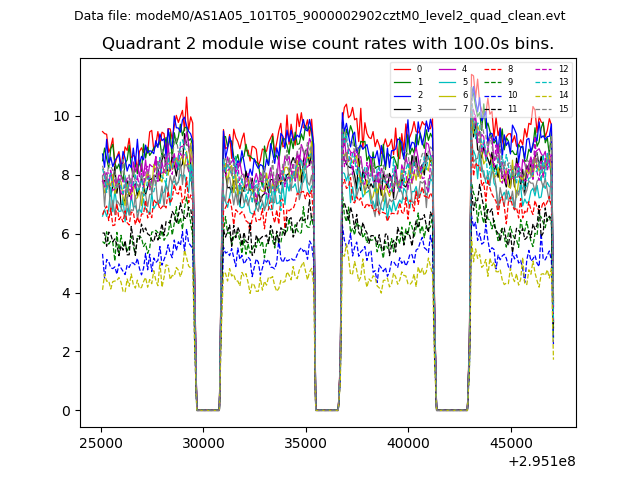
| Module-wise count rates for Quadrant B Data is divided into 100 sec bins |
 |
 |
| Module-wise count rates for Quadrant C Data is divided into 100 sec bins |
 |
 |
| Module-wise count rates for Quadrant D Data is divided into 100 sec bins |
 |
 |
| Parameter | Plot |
|---|---|
| CZT HV Monitor | 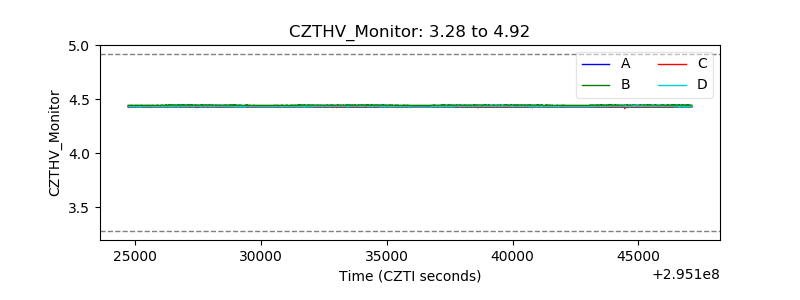 |
| D_VDD | 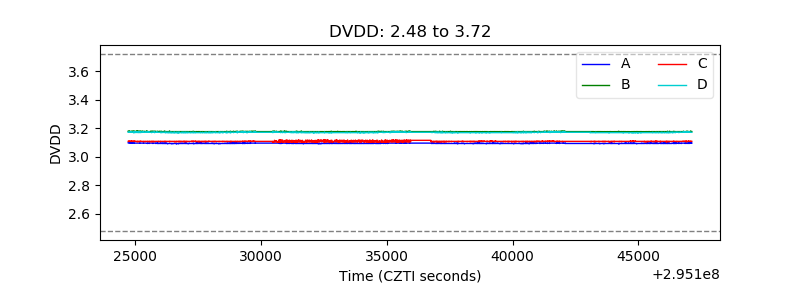 |
| Temperature 1 | 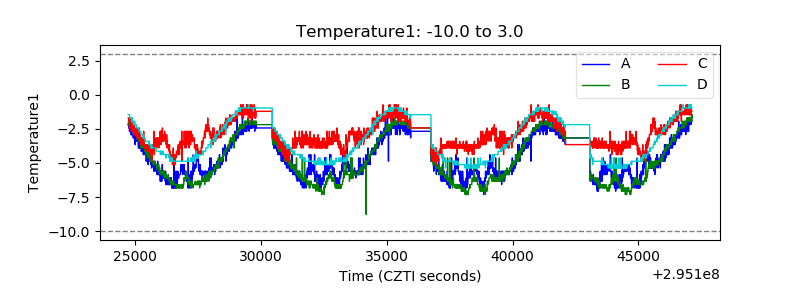 |
| Veto HV Monitor | 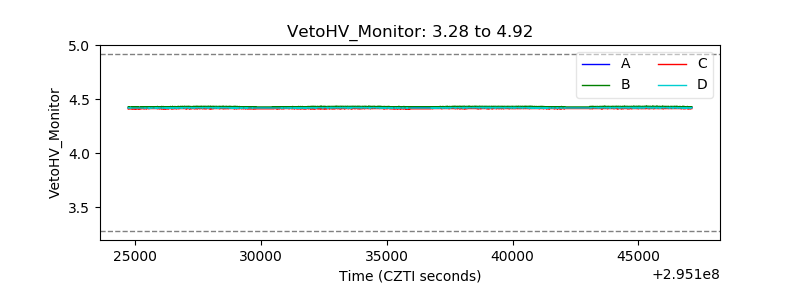 |
| Veto LLD | 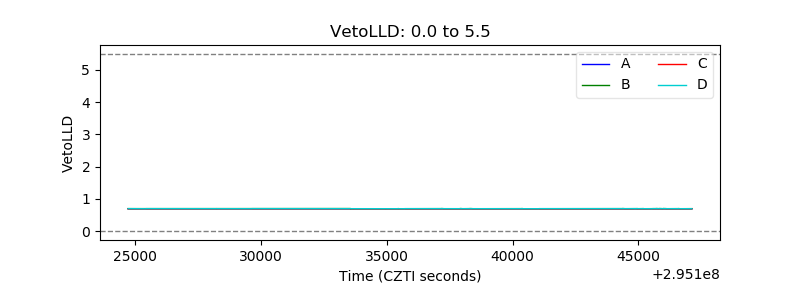 |
| Alpha Counter | 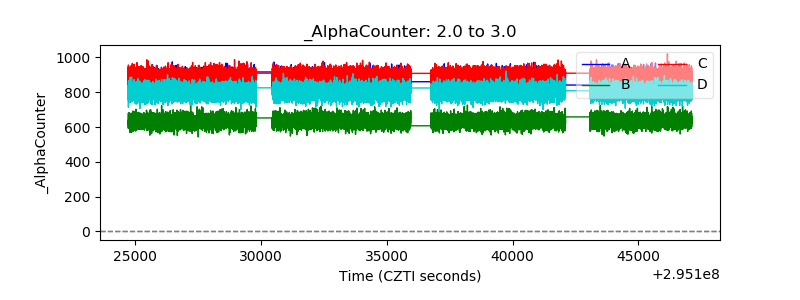 |
| _CPM_Rate | 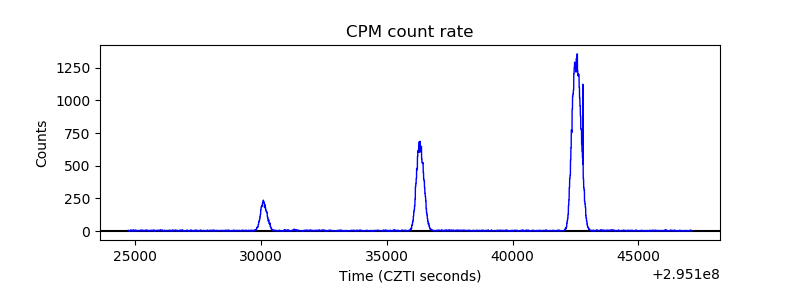 |
| CZT Counter | 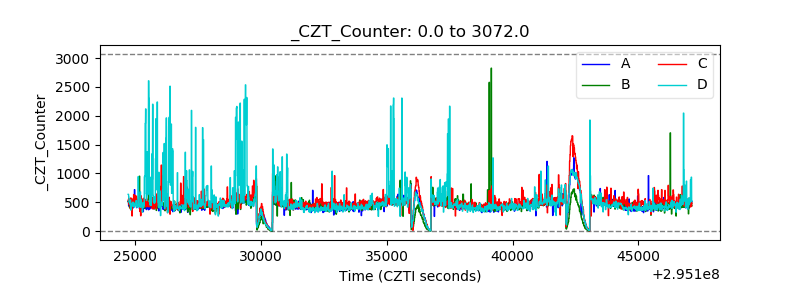 |
| +2.5 Volts monitor | 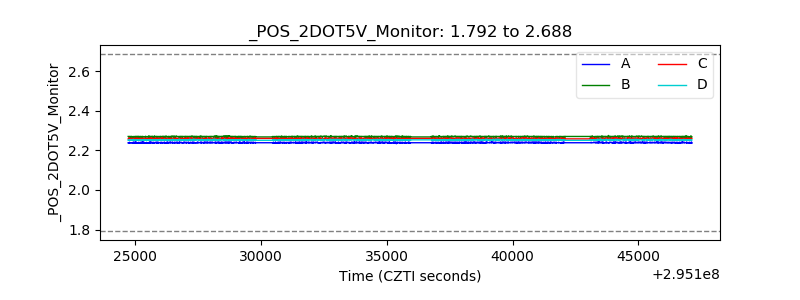 |
| +5 Volts monitor | 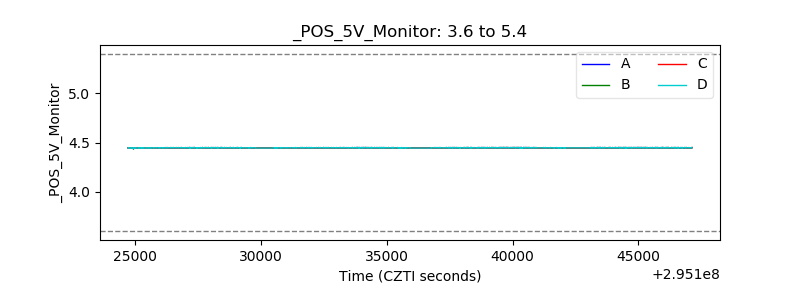 |
| _ROLL_ROT | 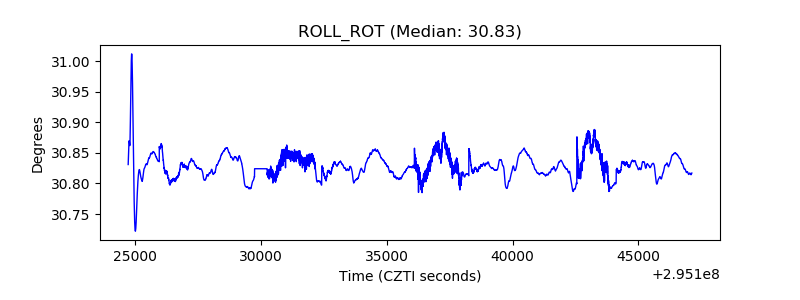 |
| _Roll_DEC | 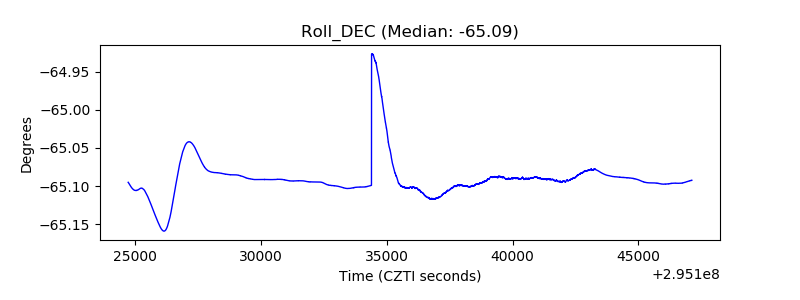 |
| _Roll_RA | 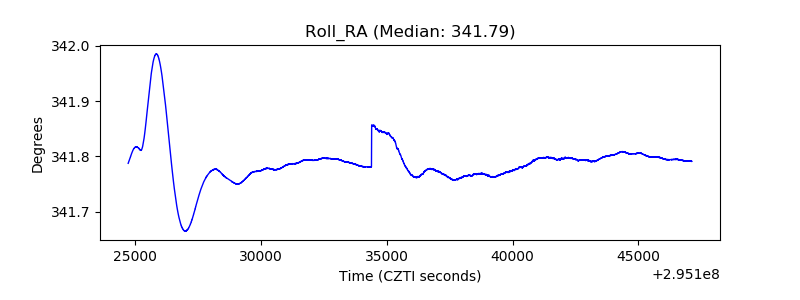 |
| Veto Counter | 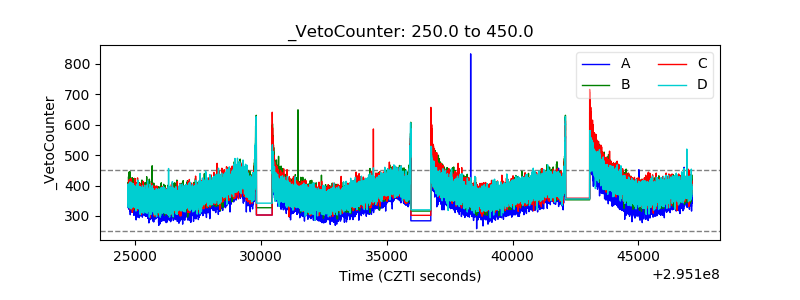 |