| Param | Original file | Final file |
|---|---|---|
| Filename | modeM0/AS1A05_101T05_9000002902_19534cztM0_level2.evt | modeM0/AS1A05_101T05_9000002902_19534cztM0_level2_quad_clean.evt |
| Size (bytes) | 839,658,240 | 196,908,480 |
| Size | 800.8 MB | 187.8 MB |
| Events in quadrant A | 5,443,571 | 1,316,009 |
| Events in quadrant B | 5,745,163 | 1,322,028 |
| Events in quadrant C | 6,084,940 | 1,257,736 |
| Events in quadrant D | 7,336,814 | 1,232,561 |
| Mode SS | |||
|---|---|---|---|
| Quadrant | BADHDUFLAG | Total packets | Discarded packets |
| A | 0 | 246 | 0 |
| B | 0 | 246 | 0 |
| C | 0 | 246 | 0 |
| D | 0 | 246 | 0 |
| Mode M9 | |||
|---|---|---|---|
| Quadrant | BADHDUFLAG | Total packets | Discarded packets |
| A | 0 | 14 | 0 |
| B | 0 | 14 | 0 |
| C | 0 | 14 | 0 |
| D | 0 | 14 | 0 |
| Mode M0 | |||
|---|---|---|---|
| Quadrant | BADHDUFLAG | Total packets | Discarded packets |
| A | 0 | 24417 | 2 |
| B | 0 | 24988 | 2 |
| C | 0 | 25600 | 2 |
| D | 0 | 30260 | 2 |
| Quadrant | Total seconds | Saturated seconds | Saturation percentage |
|---|---|---|---|
| A | 12087 | 42 | 0.347481% |
| B | 12087 | 87 | 0.719782% |
| C | 12087 | 98 | 0.810788% |
| D | 12086 | 499 | 4.128744% |
Noise dominated data is calculated using 1-second bins in cleaned event files. If a bin has >2000 counts, and if more than 50% of those come from <1% of pixels, then it is considered to be noise-dominated and hence unusable.
| Quadrant | # 1 sec bins | Bins with >0 counts | Bins with >2000 counts | High rate bins dominated by noise | Noise dominated (total time) | Noise dominated (detector-on time) | Marked lightcurve |
|---|---|---|---|---|---|---|---|
| A | 13512 | 12089 | 0 | 0 | 0.00% | 0.00% | 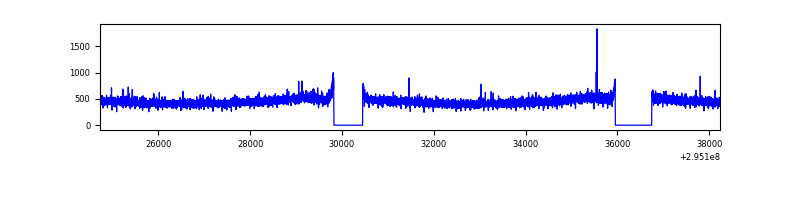 |
| B | 13512 | 12089 | 18 | 18 | 0.13% | 0.15% | 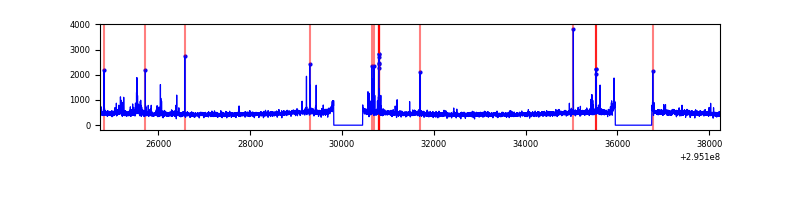 |
| C | 13512 | 12089 | 2 | 2 | 0.01% | 0.02% | 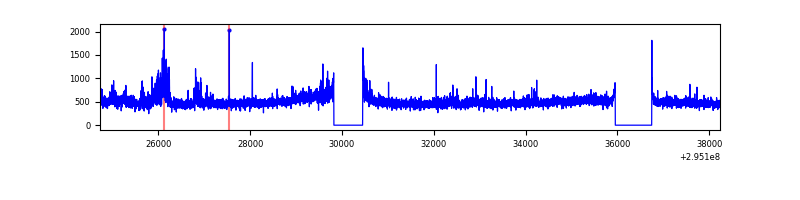 |
| D | 13511 | 12088 | 350 | 350 | 2.59% | 2.90% | 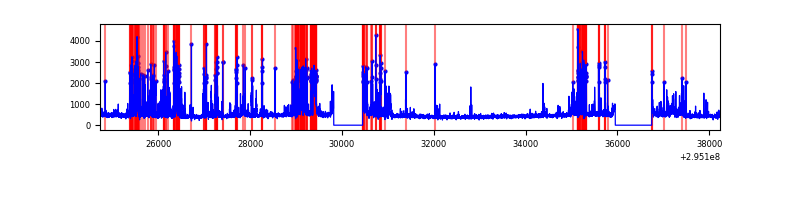 |
Top three noisy pixels from each quadrant. If the there are fewer than three noisy pixels in the level2.evt file, extra rows are filled as -1
| Pixel properties | Quadrant properties | ||||||
|---|---|---|---|---|---|---|---|
| Quadrant | DetID | PixID | Counts | Sigma | Mean | Median | Sigma |
| A | 13 | 254 | 15250 | 48.61 | 1410 | 1379 | 285.4 |
| A | 0 | 226 | 12257 | 38.12 | 1410 | 1379 | 285.4 |
| A | 3 | 137 | 11223 | 34.5 | 1410 | 1379 | 285.4 |
| B | 7 | 220 | 56059 | 206.21 | 1401 | 1365 | 265.2 |
| B | 0 | 198 | 35824 | 129.92 | 1401 | 1365 | 265.2 |
| B | 0 | 197 | 34705 | 125.7 | 1401 | 1365 | 265.2 |
| C | 3 | 233 | 580129 | 1847.43 | 1346 | 1353 | 313.3 |
| C | 14 | 238 | 210002 | 666.0 | 1346 | 1353 | 313.3 |
| C | 10 | 223 | 17986 | 53.09 | 1346 | 1353 | 313.3 |
| D | 12 | 218 | 1623408 | 4891.85 | 1351 | 1310 | 331.6 |
| D | 12 | 233 | 128480 | 383.51 | 1351 | 1310 | 331.6 |
| D | 1 | 52 | 117145 | 349.33 | 1351 | 1310 | 331.6 |
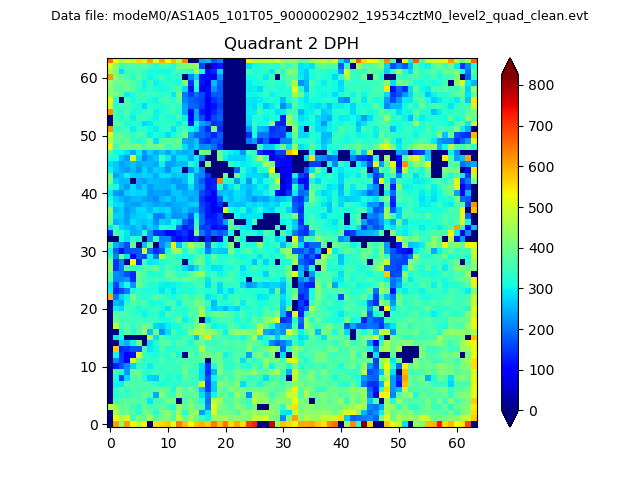
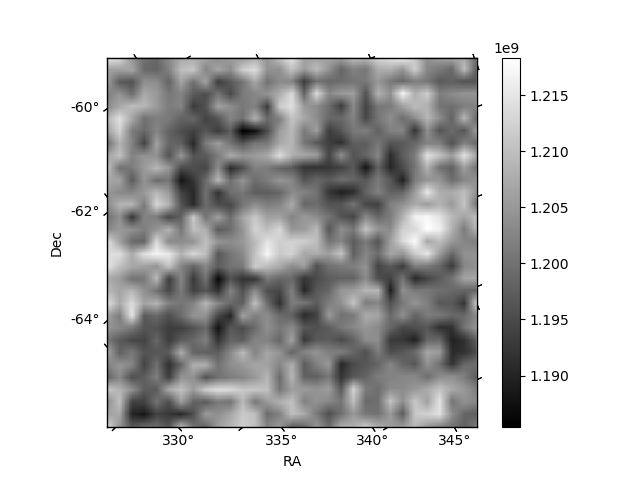
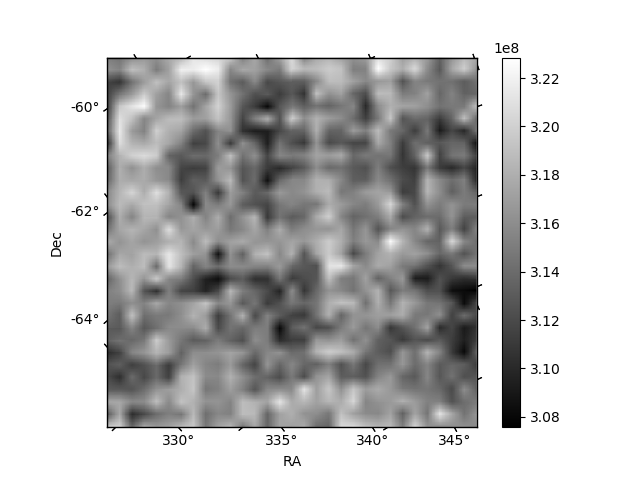
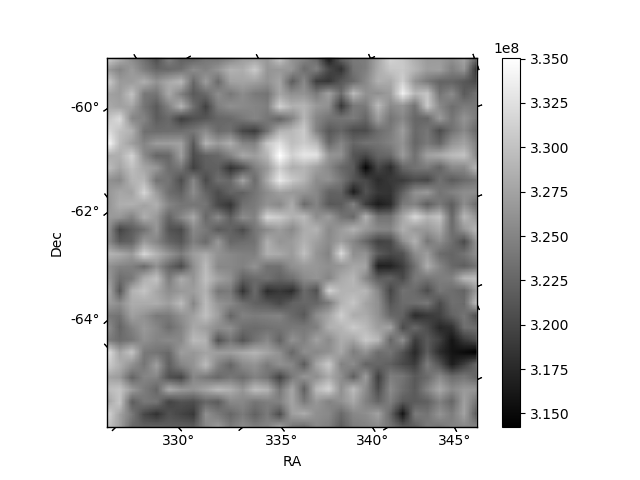
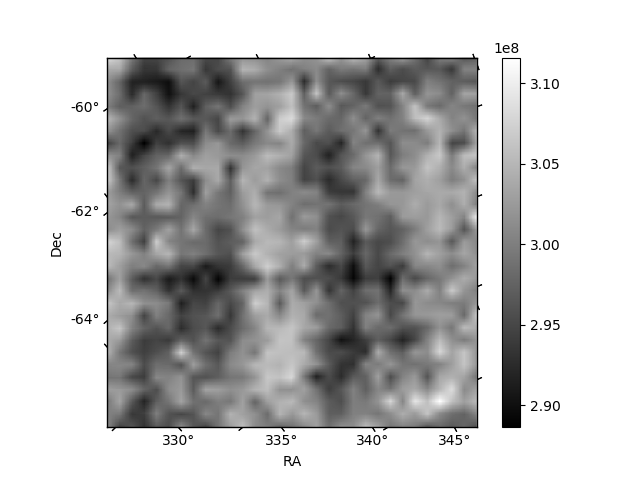
Histogram calculated using DETX and DETY for each event in the final _common_clean file
| Quadrant A | 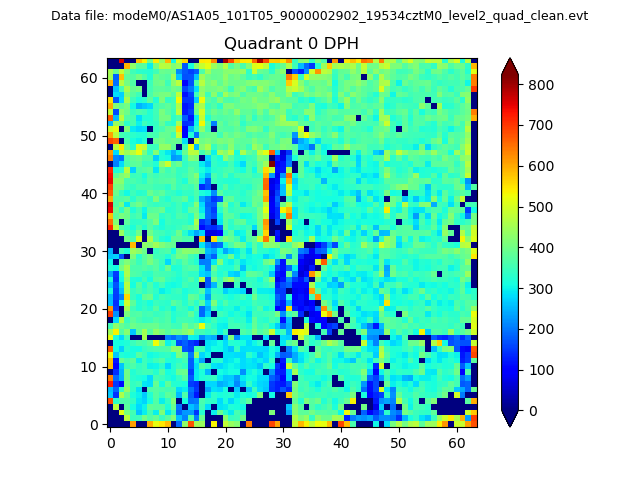 |
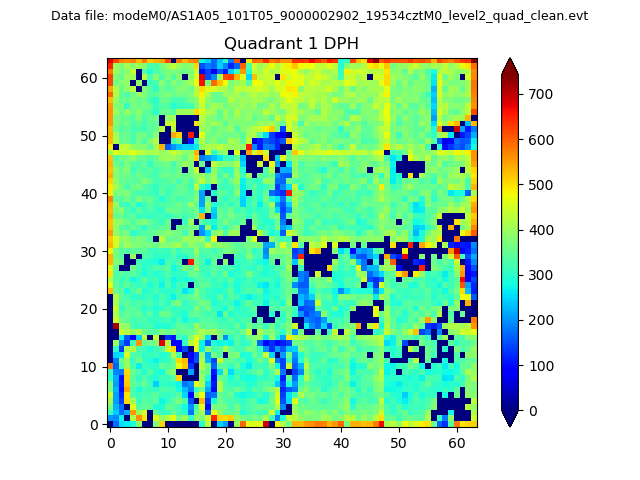 |
Quadrant B |
|---|---|---|---|
| Quadrant D | 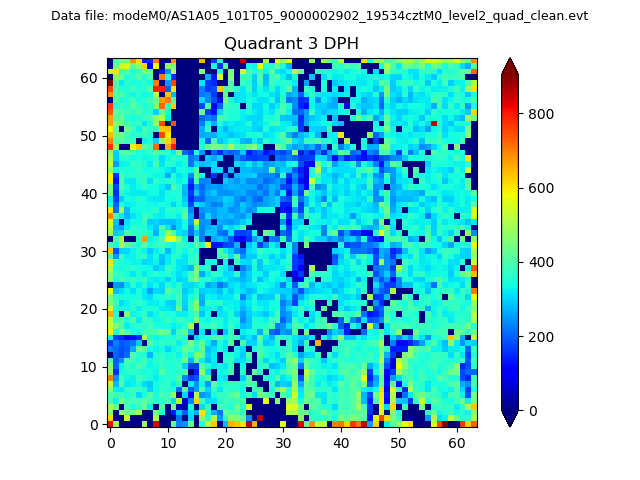 |
 |
Quadrant C |
| Plot type | Count rate plots | Images |
|---|---|---|
| Comparison with Poisson distribution Blue bars denote a histogram of data divided into 1 sec bins. Red curve is a Poisson curve with rate = median count rate of data. |
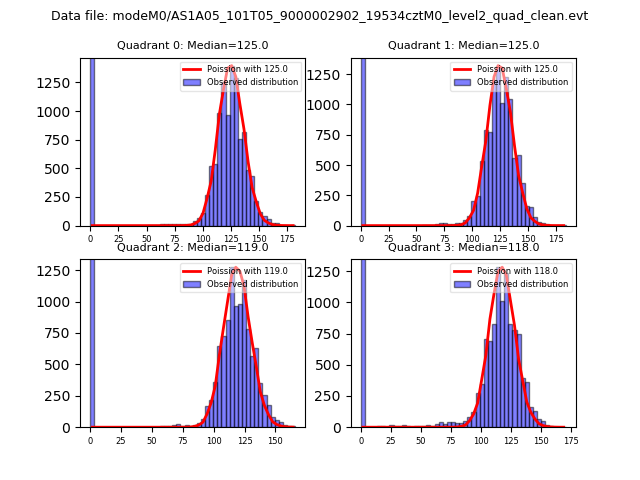 |
 |
| Quadrant-wise count rates Data is divided into 100 sec bins |
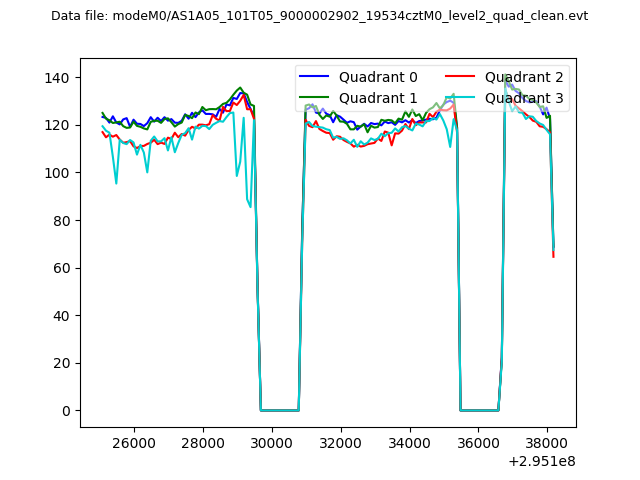 |
|
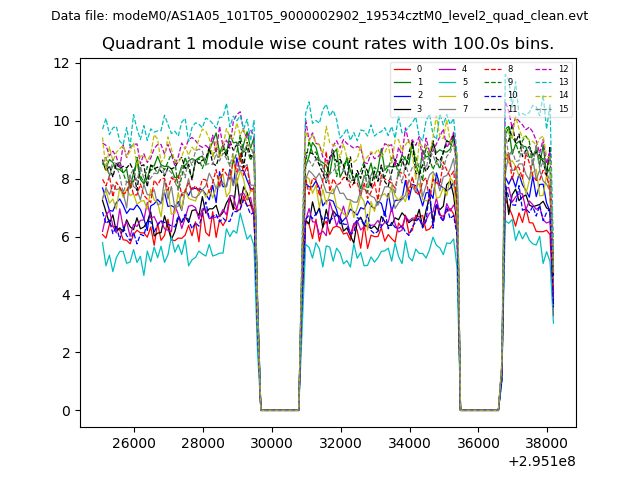
| Module-wise count rates for Quadrant A Data is divided into 100 sec bins |
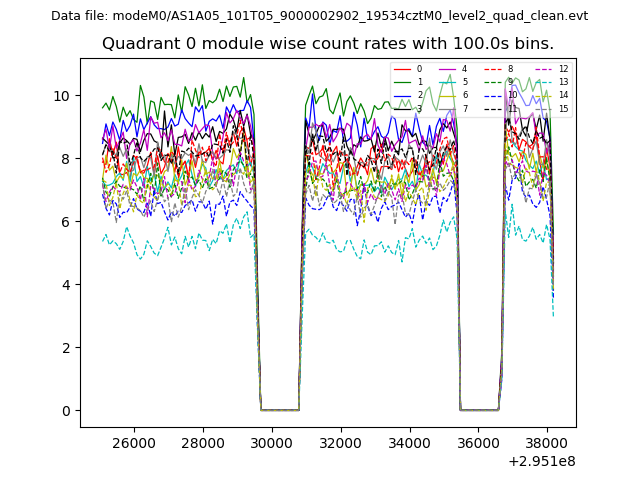 |
 |
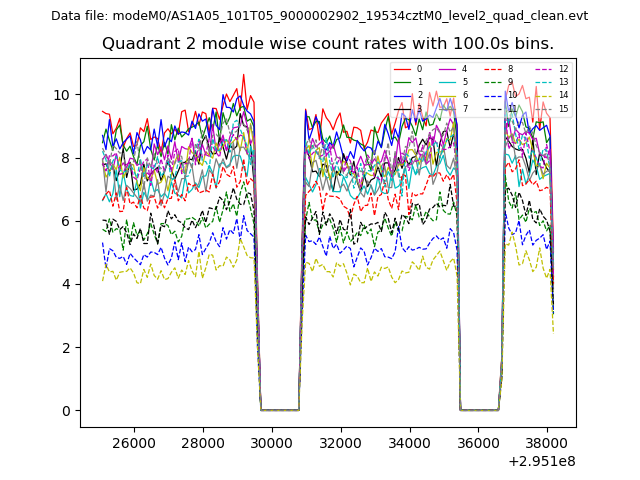
| Module-wise count rates for Quadrant B Data is divided into 100 sec bins |
 |
 |
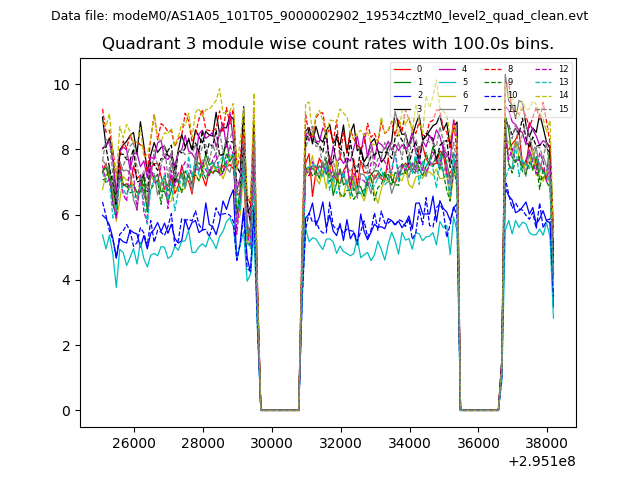
| Module-wise count rates for Quadrant C Data is divided into 100 sec bins |
 |
 |
| Module-wise count rates for Quadrant D Data is divided into 100 sec bins |
 |
 |
| Parameter | Plot |
|---|---|
| CZT HV Monitor | 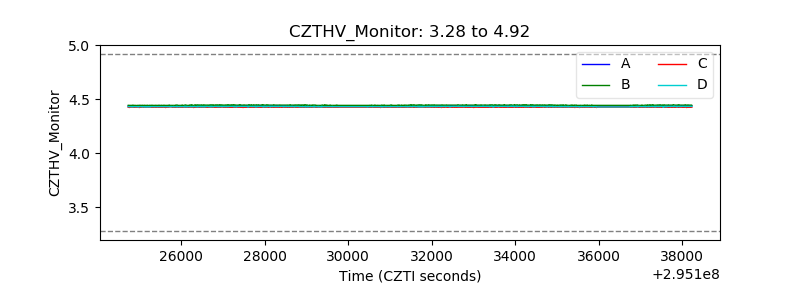 |
| D_VDD | 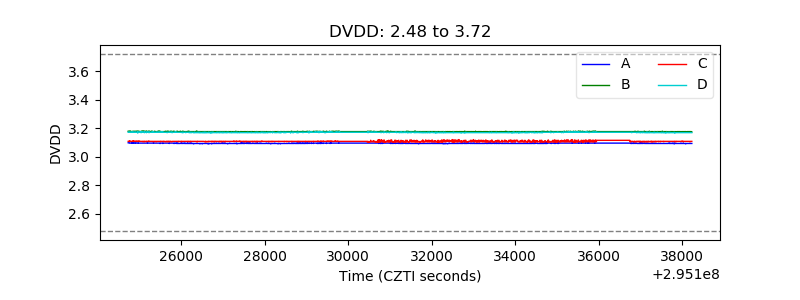 |
| Temperature 1 | 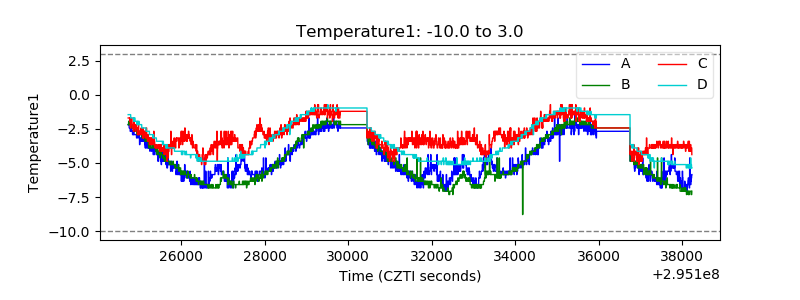 |
| Veto HV Monitor | 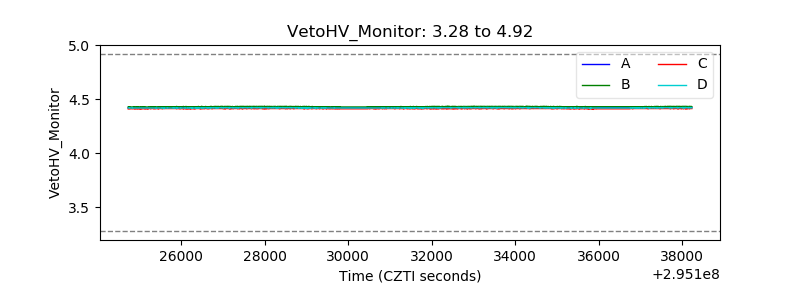 |
| Veto LLD | 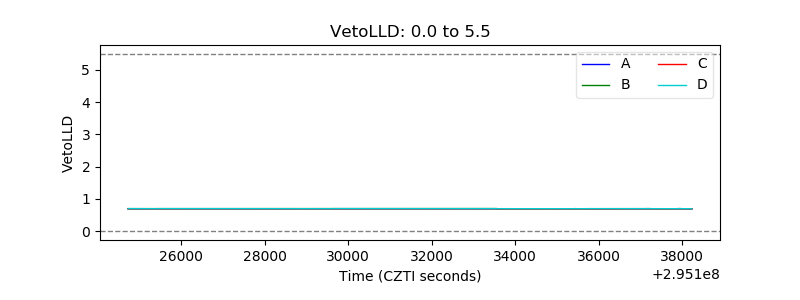 |
| Alpha Counter | 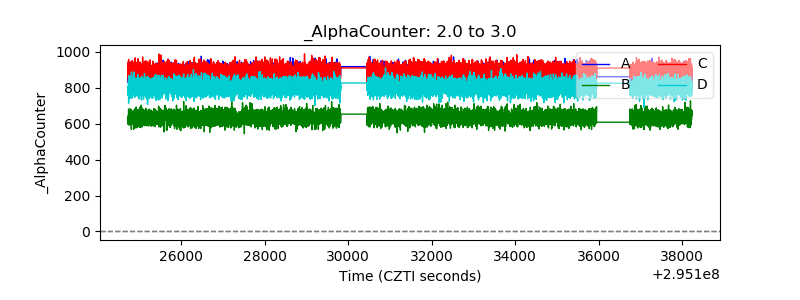 |
| _CPM_Rate | 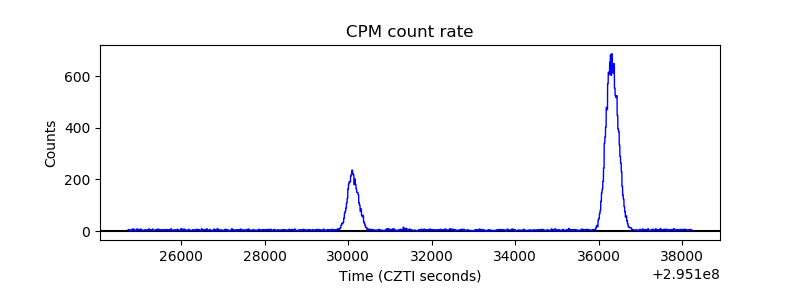 |
| CZT Counter | 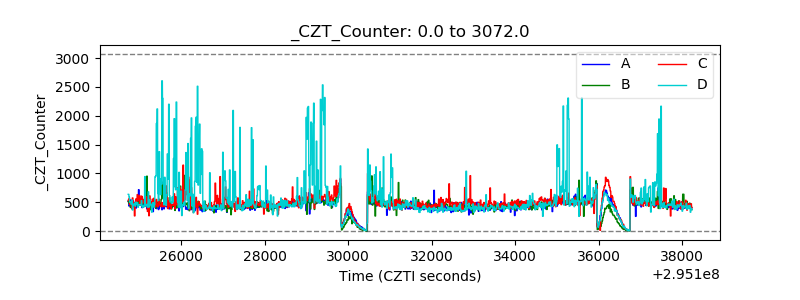 |
| +2.5 Volts monitor |  |
| +5 Volts monitor |  |
| _ROLL_ROT | 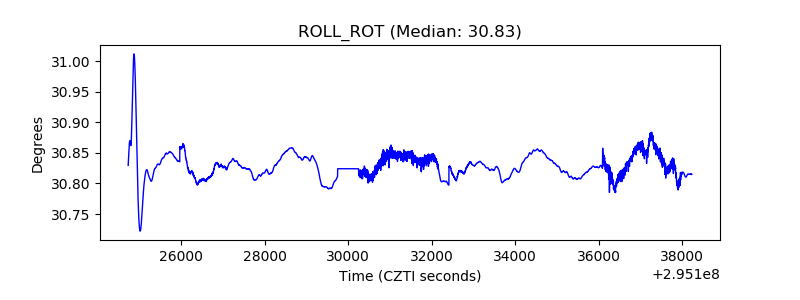 |
| _Roll_DEC | 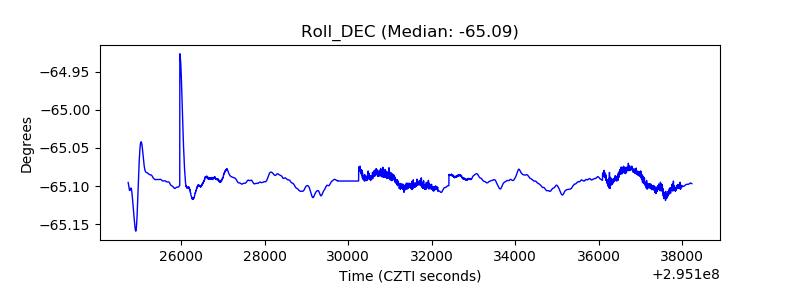 |
| _Roll_RA | 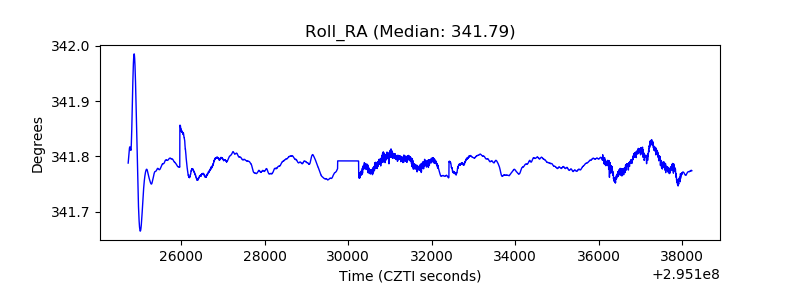 |
| Veto Counter | 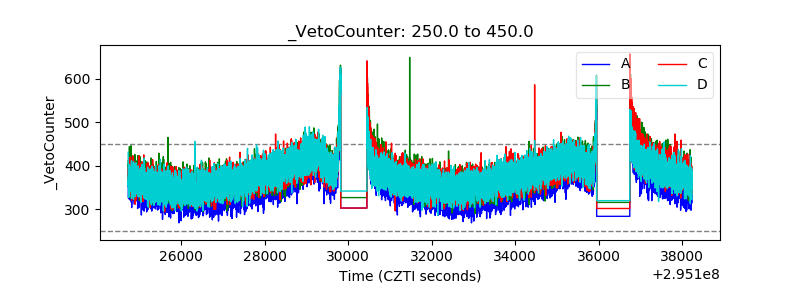 |