| Param | Original file | Final file |
|---|---|---|
| Filename | modeM0/AS1A05_101T05_9000002902_19535cztM0_level2.evt | modeM0/AS1A05_101T05_9000002902_19535cztM0_level2_quad_clean.evt |
| Size (bytes) | 447,678,720 | 114,886,080 |
| Size | 426.9 MB | 109.6 MB |
| Events in quadrant A | 3,124,987 | 764,521 |
| Events in quadrant B | 3,277,122 | 770,574 |
| Events in quadrant C | 3,414,599 | 737,280 |
| Events in quadrant D | 3,280,487 | 734,865 |
| Mode SS | |||
|---|---|---|---|
| Quadrant | BADHDUFLAG | Total packets | Discarded packets |
| A | 0 | 138 | 0 |
| B | 0 | 138 | 0 |
| C | 0 | 138 | 0 |
| D | 0 | 138 | 0 |
| Mode M9 | |||
|---|---|---|---|
| Quadrant | BADHDUFLAG | Total packets | Discarded packets |
| A | 0 | 15 | 0 |
| B | 0 | 16 | 0 |
| C | 0 | 16 | 0 |
| D | 0 | 16 | 0 |
| Mode M0 | |||
|---|---|---|---|
| Quadrant | BADHDUFLAG | Total packets | Discarded packets |
| A | 0 | 13785 | 2 |
| B | 0 | 14113 | 2 |
| C | 0 | 14282 | 3 |
| D | 0 | 14477 | 2 |
| Quadrant | Total seconds | Saturated seconds | Saturation percentage |
|---|---|---|---|
| A | 6777 | 23 | 0.339383% |
| B | 6777 | 55 | 0.811569% |
| C | 6776 | 58 | 0.855962% |
| D | 6776 | 31 | 0.457497% |
Noise dominated data is calculated using 1-second bins in cleaned event files. If a bin has >2000 counts, and if more than 50% of those come from <1% of pixels, then it is considered to be noise-dominated and hence unusable.
| Quadrant | # 1 sec bins | Bins with >0 counts | Bins with >2000 counts | High rate bins dominated by noise | Noise dominated (total time) | Noise dominated (detector-on time) | Marked lightcurve |
|---|---|---|---|---|---|---|---|
| A | 7737 | 6778 | 1 | 1 | 0.01% | 0.01% | 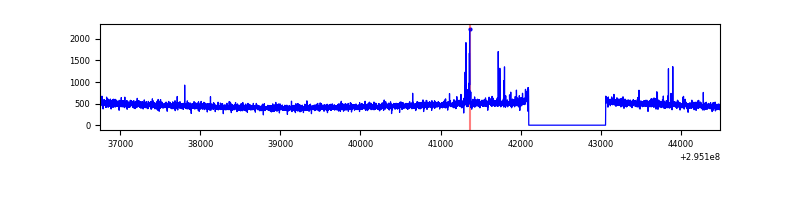 |
| B | 7737 | 6778 | 22 | 22 | 0.28% | 0.32% | 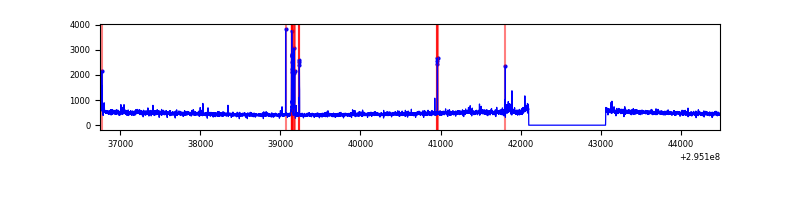 |
| C | 7736 | 6777 | 0 | 0 | 0.00% | 0.00% | 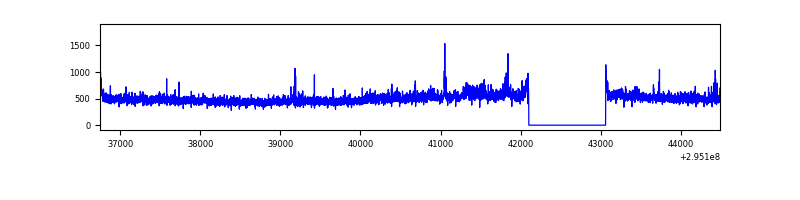 |
| D | 7736 | 6777 | 16 | 16 | 0.21% | 0.24% | 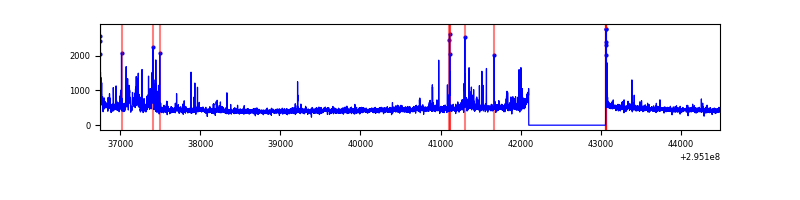 |
Top three noisy pixels from each quadrant. If the there are fewer than three noisy pixels in the level2.evt file, extra rows are filled as -1
| Pixel properties | Quadrant properties | ||||||
|---|---|---|---|---|---|---|---|
| Quadrant | DetID | PixID | Counts | Sigma | Mean | Median | Sigma |
| A | 4 | 2 | 30738 | 184.65 | 801 | 783 | 162.2 |
| A | 13 | 254 | 8570 | 48.0 | 801 | 783 | 162.2 |
| A | 0 | 226 | 6744 | 36.74 | 801 | 783 | 162.2 |
| B | 3 | 64 | 86719 | 565.13 | 800 | 780 | 152.1 |
| B | 12 | 111 | 18449 | 116.19 | 800 | 780 | 152.1 |
| B | 0 | 190 | 17730 | 111.46 | 800 | 780 | 152.1 |
| C | 3 | 233 | 272911 | 1513.83 | 772 | 778 | 179.8 |
| C | 14 | 238 | 120845 | 667.91 | 772 | 778 | 179.8 |
| C | 7 | 247 | 7692 | 38.46 | 772 | 778 | 179.8 |
| D | 12 | 218 | 139045 | 724.55 | 783 | 762 | 190.9 |
| D | 1 | 52 | 109649 | 570.52 | 783 | 762 | 190.9 |
| D | 10 | 34 | 33672 | 172.43 | 783 | 762 | 190.9 |
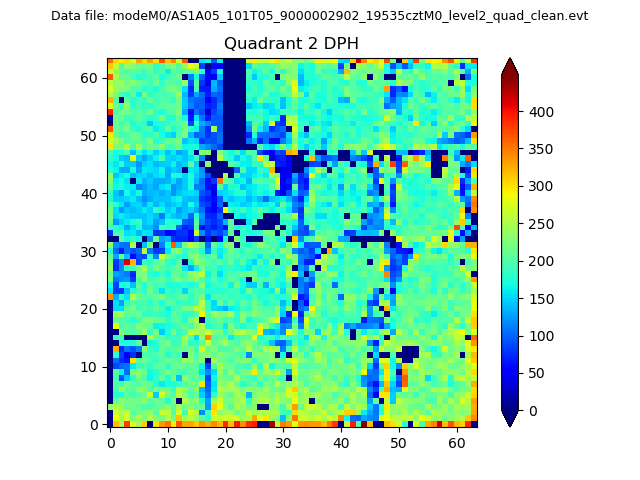
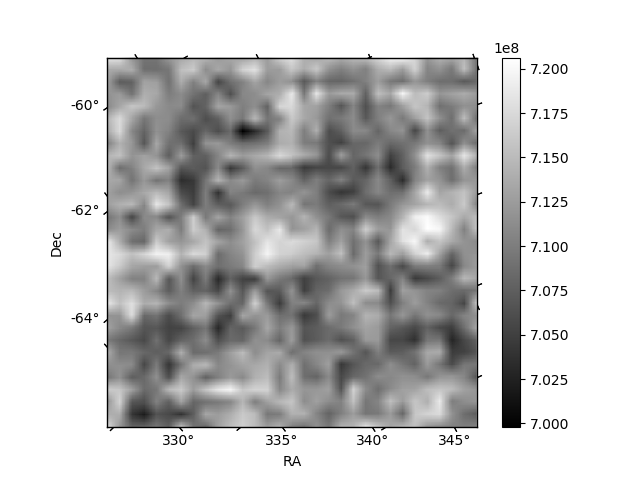
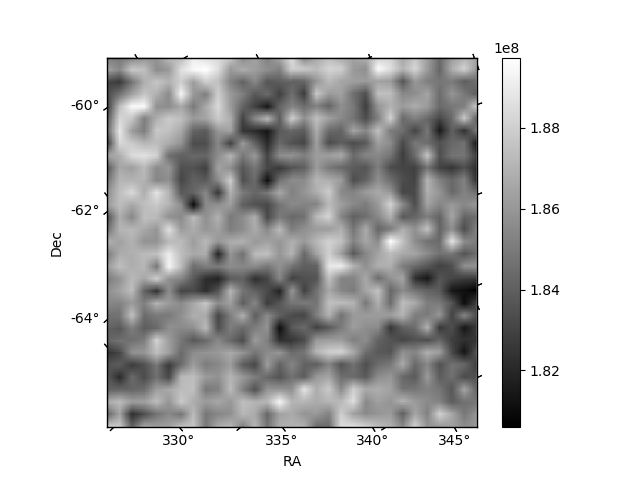
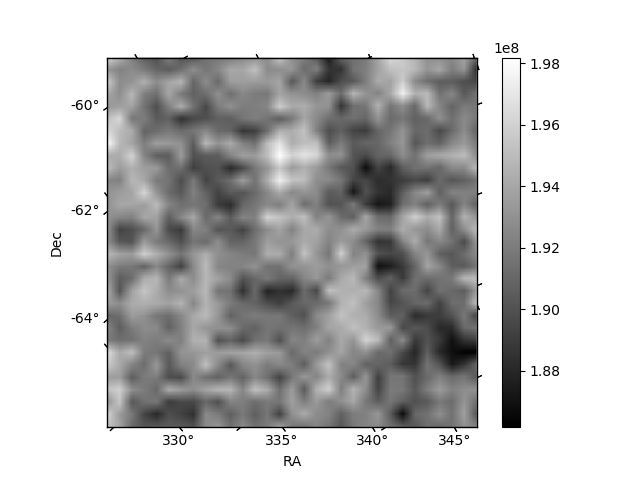
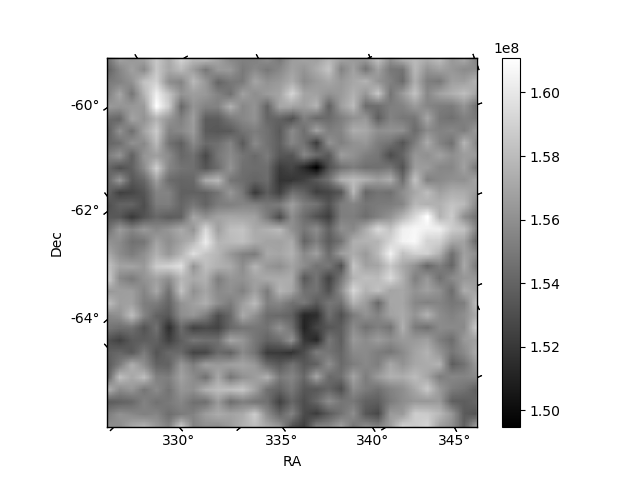
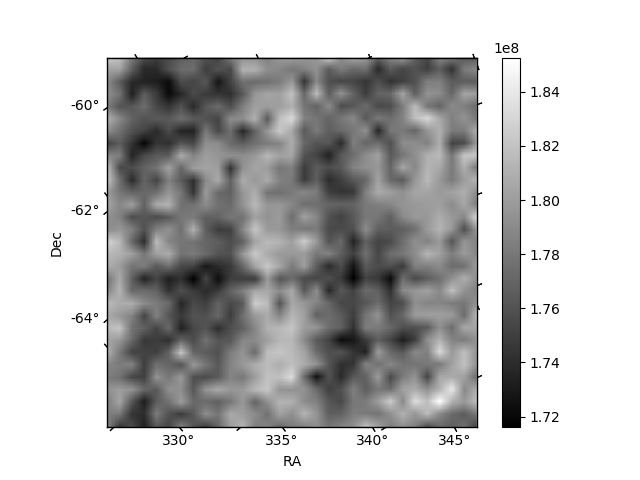
Histogram calculated using DETX and DETY for each event in the final _common_clean file
| Quadrant A | 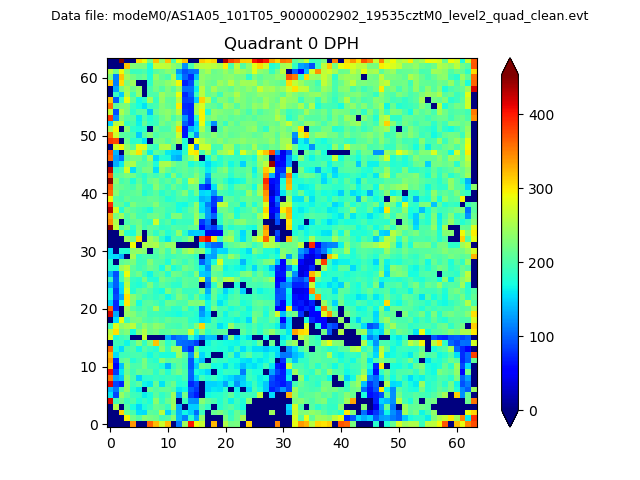 |
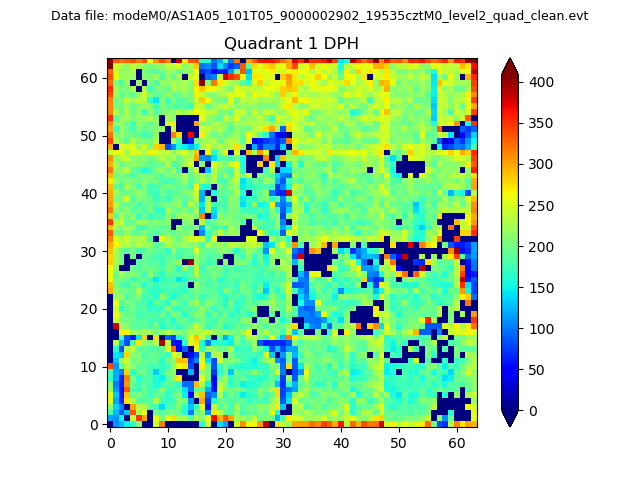 |
Quadrant B |
|---|---|---|---|
| Quadrant D | 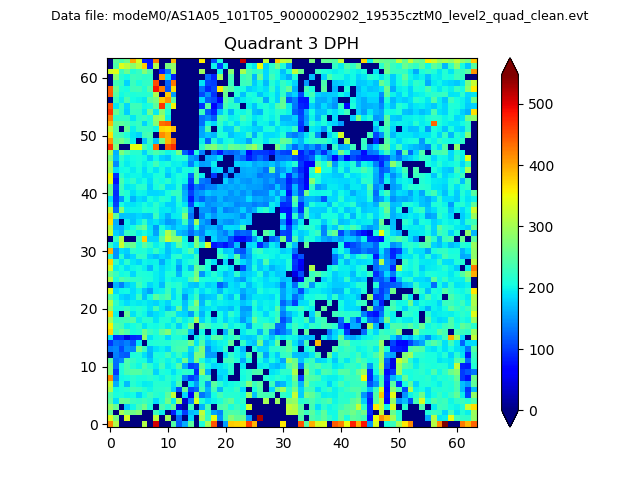 |
 |
Quadrant C |
| Plot type | Count rate plots | Images |
|---|---|---|
| Comparison with Poisson distribution Blue bars denote a histogram of data divided into 1 sec bins. Red curve is a Poisson curve with rate = median count rate of data. |
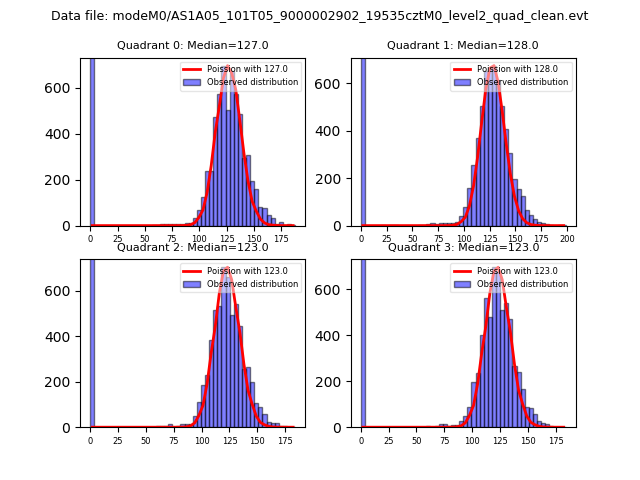 |
 |
| Quadrant-wise count rates Data is divided into 100 sec bins |
 |
|
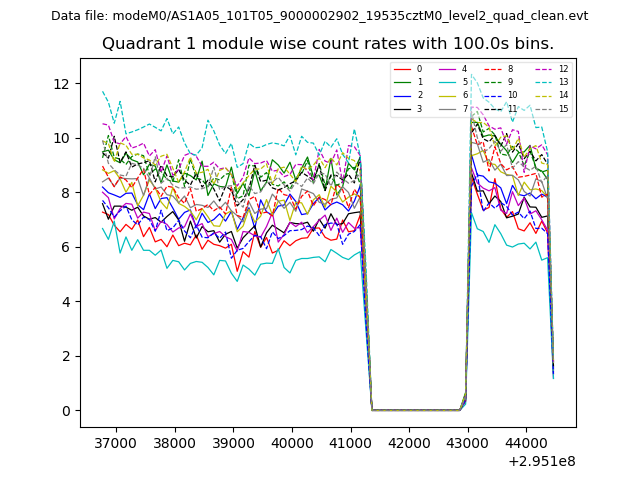
| Module-wise count rates for Quadrant A Data is divided into 100 sec bins |
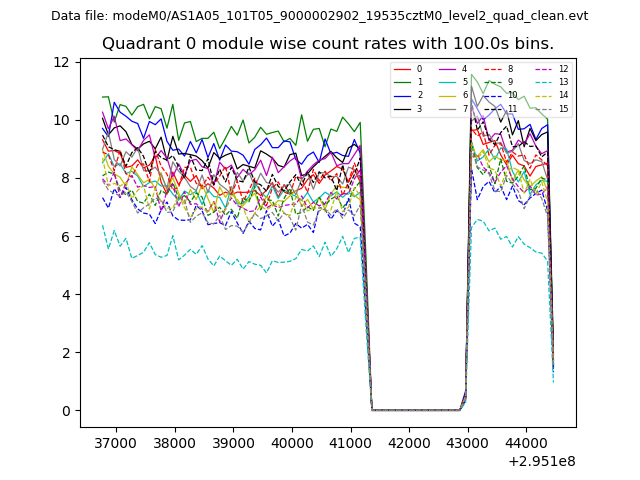 |
 |
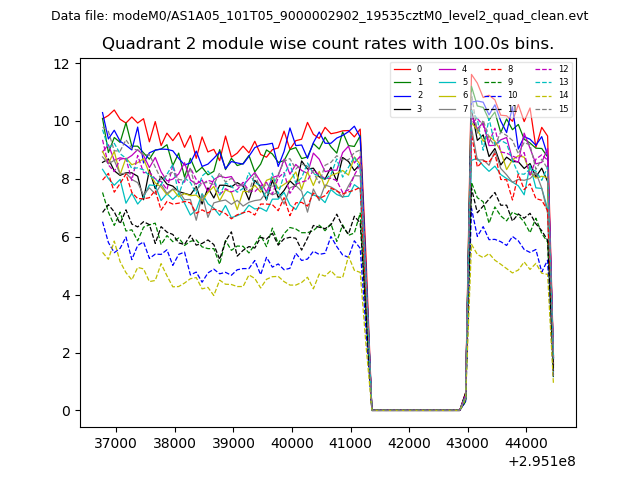
| Module-wise count rates for Quadrant B Data is divided into 100 sec bins |
 |
 |
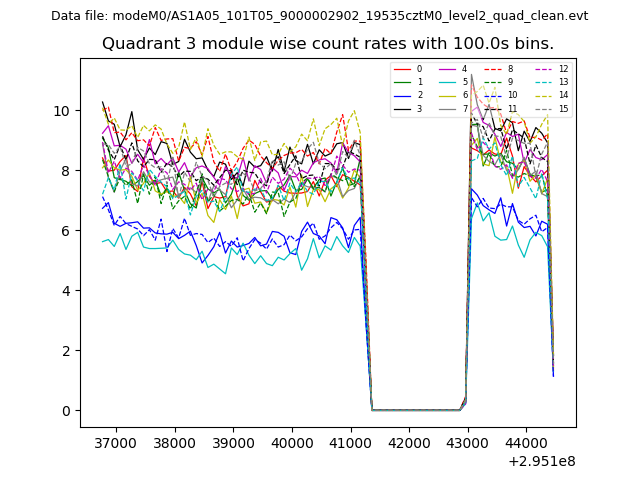
| Module-wise count rates for Quadrant C Data is divided into 100 sec bins |
 |
 |
| Module-wise count rates for Quadrant D Data is divided into 100 sec bins |
 |
 |
| Parameter | Plot |
|---|---|
| CZT HV Monitor | 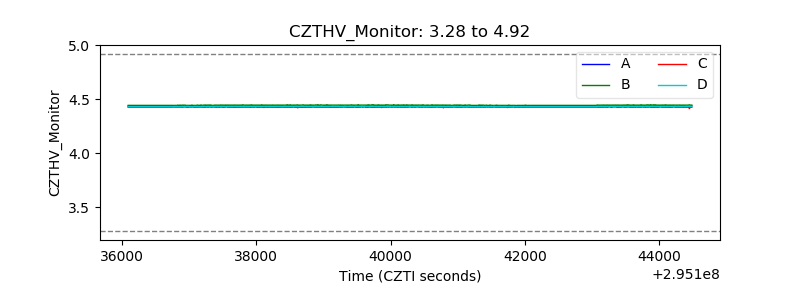 |
| D_VDD | 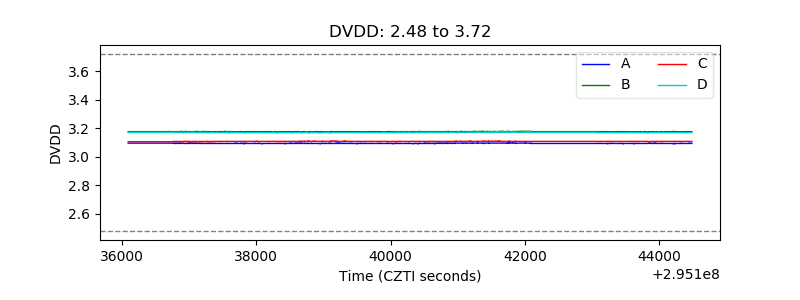 |
| Temperature 1 | 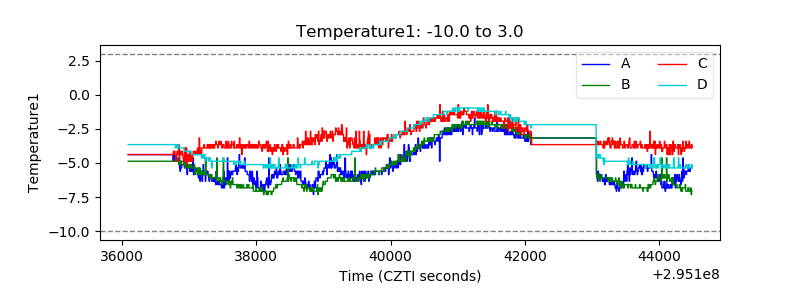 |
| Veto HV Monitor | 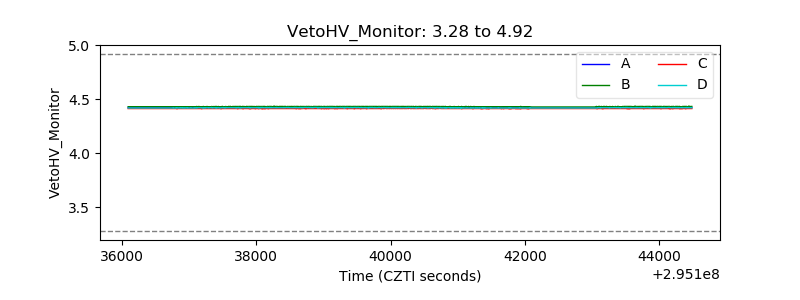 |
| Veto LLD | 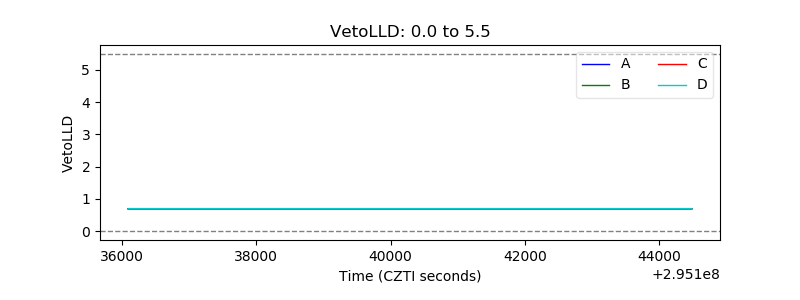 |
| Alpha Counter |  |
| _CPM_Rate | 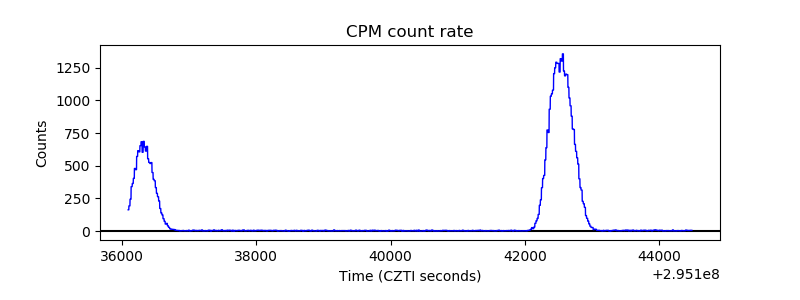 |
| CZT Counter |  |
| +2.5 Volts monitor |  |
| +5 Volts monitor |  |
| _ROLL_ROT | 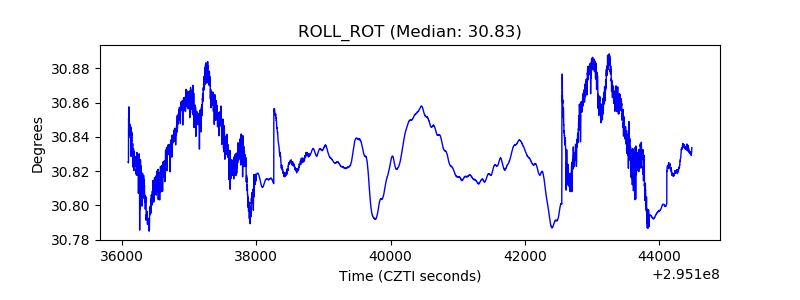 |
| _Roll_DEC | 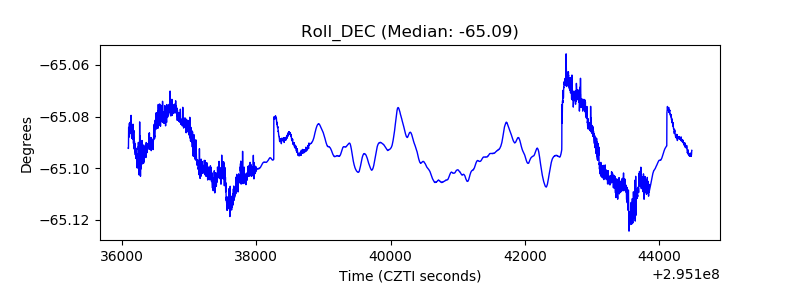 |
| _Roll_RA | 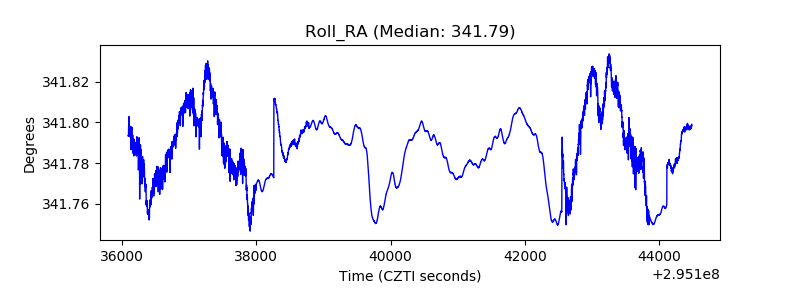 |
| Veto Counter | 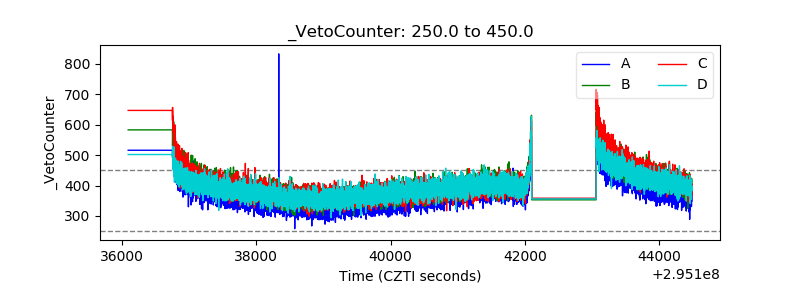 |