| Param | Original file | Final file |
|---|---|---|
| Filename | modeM0/AS1A05_101T05_9000002902_19536cztM0_level2.evt | modeM0/AS1A05_101T05_9000002902_19536cztM0_level2_quad_clean.evt |
| Size (bytes) | 101,450,880 | 31,178,880 |
| Size | 96.8 MB | 29.7 MB |
| Events in quadrant A | 720,294 | 210,419 |
| Events in quadrant B | 737,916 | 212,683 |
| Events in quadrant C | 793,198 | 199,662 |
| Events in quadrant D | 709,895 | 203,836 |
| Mode SS | |||
|---|---|---|---|
| Quadrant | BADHDUFLAG | Total packets | Discarded packets |
| A | 0 | 50 | 20 |
| B | 0 | 50 | 20 |
| C | 0 | 51 | 21 |
| D | 0 | 49 | 17 |
| Mode M9 | |||
|---|---|---|---|
| Quadrant | BADHDUFLAG | Total packets | Discarded packets |
| A | 0 | 7 | 7 |
| B | 0 | 7 | 4 |
| C | 0 | 6 | 4 |
| D | 0 | 6 | 4 |
| Mode M0 | |||
|---|---|---|---|
| Quadrant | BADHDUFLAG | Total packets | Discarded packets |
| A | 0 | 5016 | 1807 |
| B | 0 | 5000 | 1784 |
| C | 0 | 5161 | 1890 |
| D | 0 | 5066 | 1811 |
| Quadrant | Total seconds | Saturated seconds | Saturation percentage |
|---|---|---|---|
| A | 1588 | 2 | 0.125945% |
| B | 1589 | 4 | 0.251731% |
| C | 1573 | 6 | 0.381437% |
| D | 1602 | 2 | 0.124844% |
Noise dominated data is calculated using 1-second bins in cleaned event files. If a bin has >2000 counts, and if more than 50% of those come from <1% of pixels, then it is considered to be noise-dominated and hence unusable.
| Quadrant | # 1 sec bins | Bins with >0 counts | Bins with >2000 counts | High rate bins dominated by noise | Noise dominated (total time) | Noise dominated (detector-on time) | Marked lightcurve |
|---|---|---|---|---|---|---|---|
| A | 2158 | 1914 | 0 | 0 | 0.00% | 0.00% | 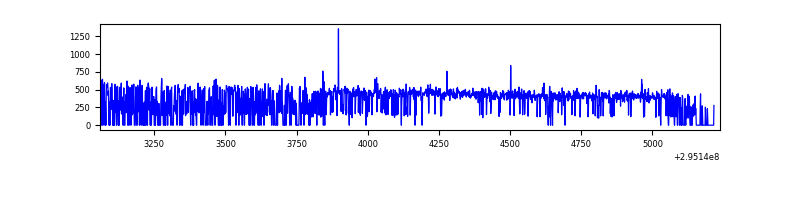 |
| B | 2175 | 1930 | 0 | 0 | 0.00% | 0.00% | 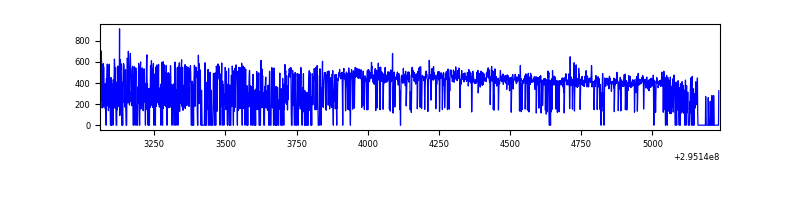 |
| C | 2177 | 1894 | 0 | 0 | 0.00% | 0.00% | 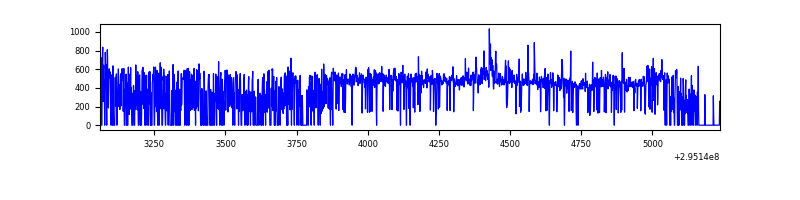 |
| D | 2169 | 1928 | 1 | 1 | 0.05% | 0.05% | 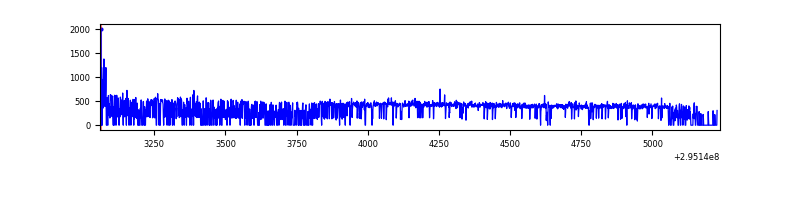 |
Top three noisy pixels from each quadrant. If the there are fewer than three noisy pixels in the level2.evt file, extra rows are filled as -1
| Pixel properties | Quadrant properties | ||||||
|---|---|---|---|---|---|---|---|
| Quadrant | DetID | PixID | Counts | Sigma | Mean | Median | Sigma |
| A | 4 | 2 | 5108 | 125.21 | 185 | 181 | 39.3 |
| A | 13 | 254 | 2036 | 47.13 | 185 | 181 | 39.3 |
| A | 5 | 203 | 1723 | 39.18 | 185 | 181 | 39.3 |
| B | 12 | 111 | 4159 | 106.12 | 187 | 183 | 37.5 |
| B | 11 | 111 | 3834 | 97.44 | 187 | 183 | 37.5 |
| B | 14 | 111 | 3304 | 83.3 | 187 | 183 | 37.5 |
| C | 3 | 233 | 57978 | 1313.59 | 181 | 183 | 44.0 |
| C | 14 | 238 | 27584 | 622.78 | 181 | 183 | 44.0 |
| C | 13 | 61 | 1204 | 23.21 | 181 | 183 | 44.0 |
| D | 12 | 218 | 9449 | 202.56 | 183 | 177 | 45.8 |
| D | 2 | 234 | 5527 | 116.88 | 183 | 177 | 45.8 |
| D | 2 | 16 | 5022 | 105.85 | 183 | 177 | 45.8 |
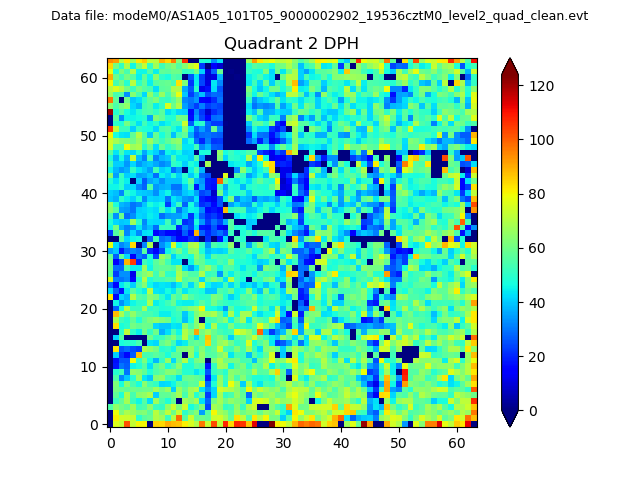
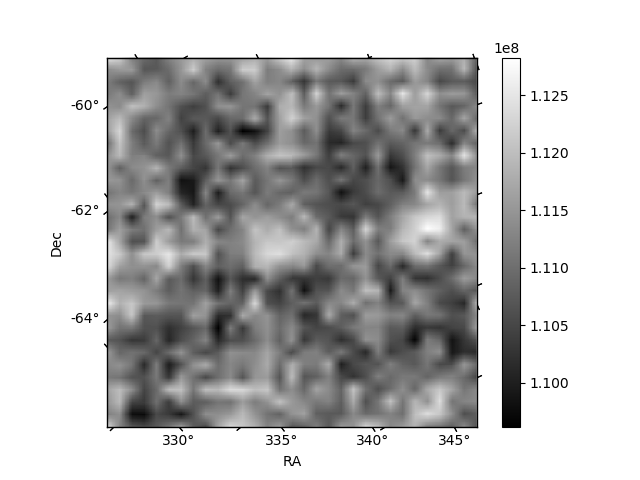
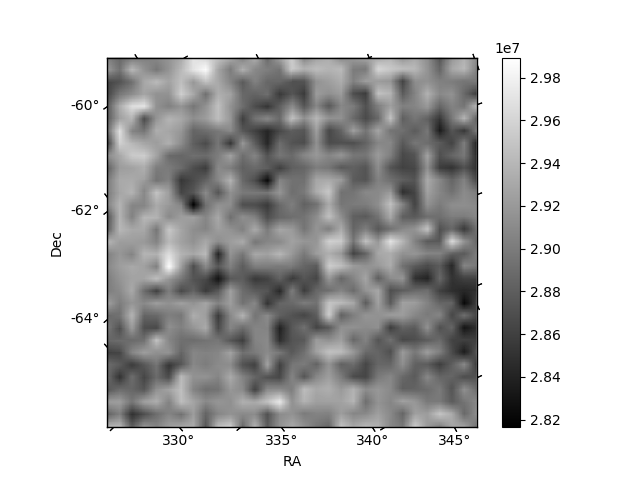
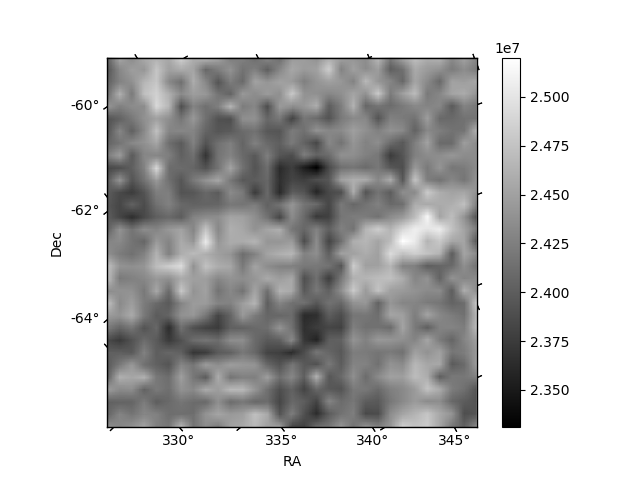
Histogram calculated using DETX and DETY for each event in the final _common_clean file
| Quadrant A | 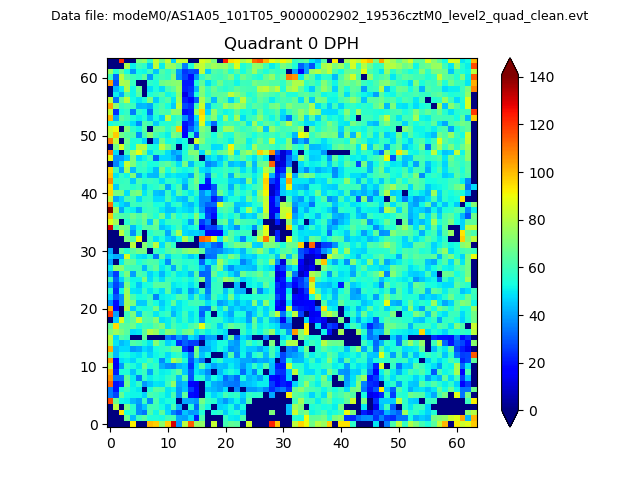 |
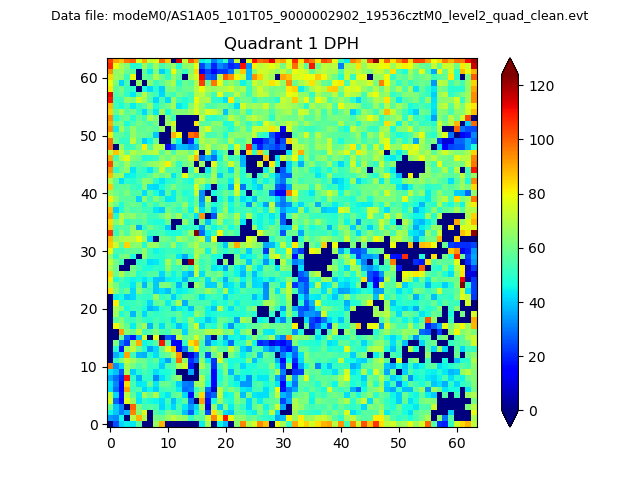 |
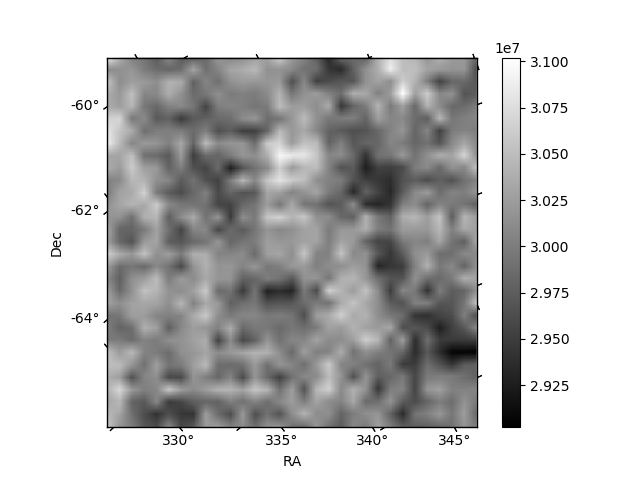
Quadrant B |
|---|---|---|---|
| Quadrant D | 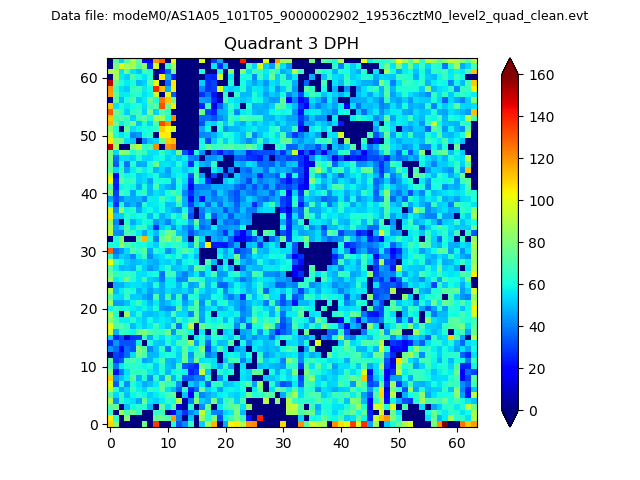 |
 |
Quadrant C |
| Plot type | Count rate plots | Images |
|---|---|---|
| Comparison with Poisson distribution Blue bars denote a histogram of data divided into 1 sec bins. Red curve is a Poisson curve with rate = median count rate of data. |
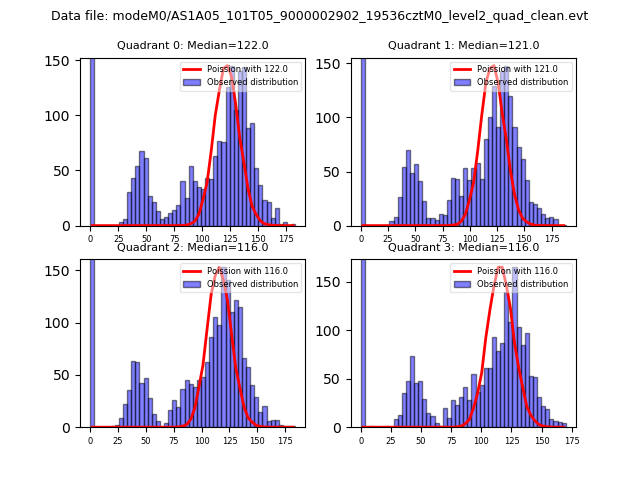 |
 |
| Quadrant-wise count rates Data is divided into 100 sec bins |
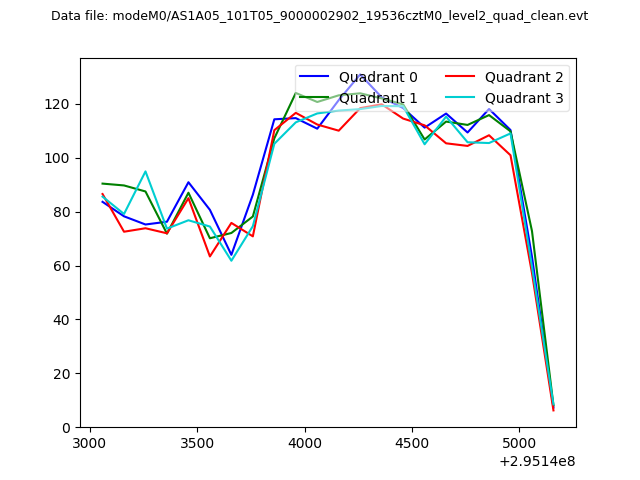 |
|
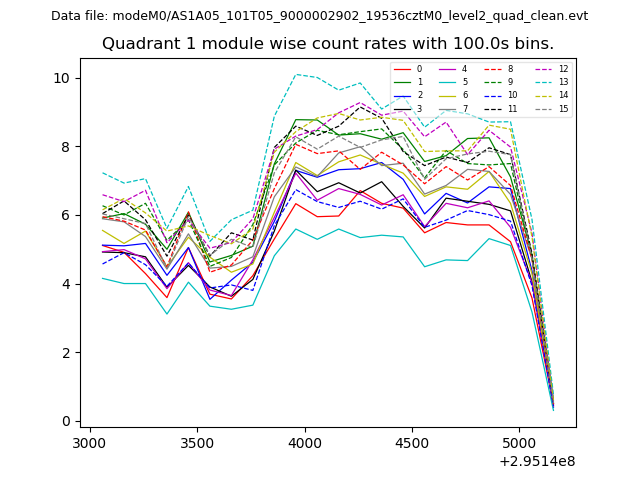
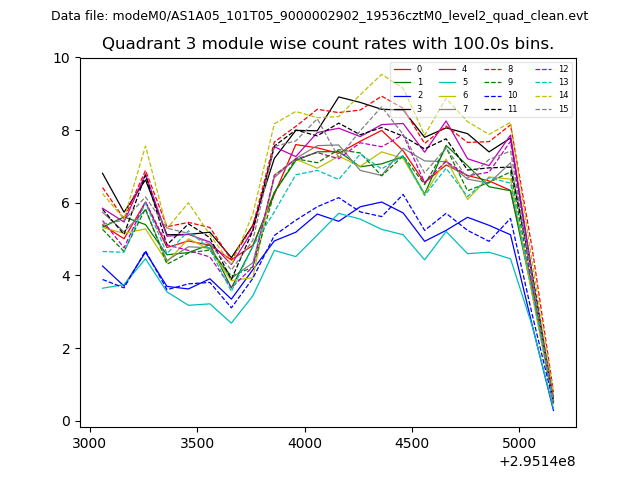
| Module-wise count rates for Quadrant A Data is divided into 100 sec bins |
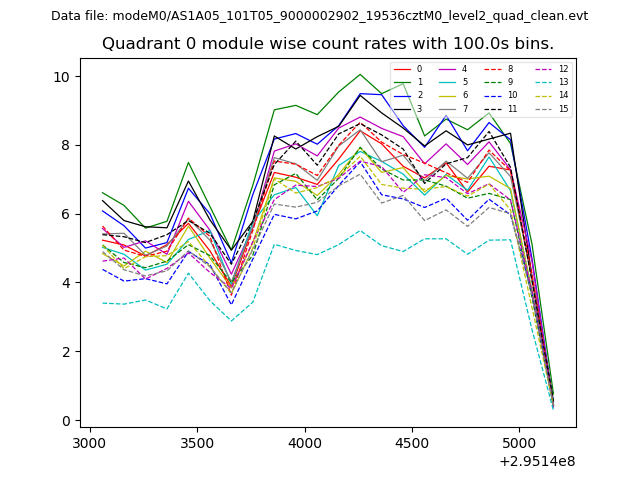 |
 |
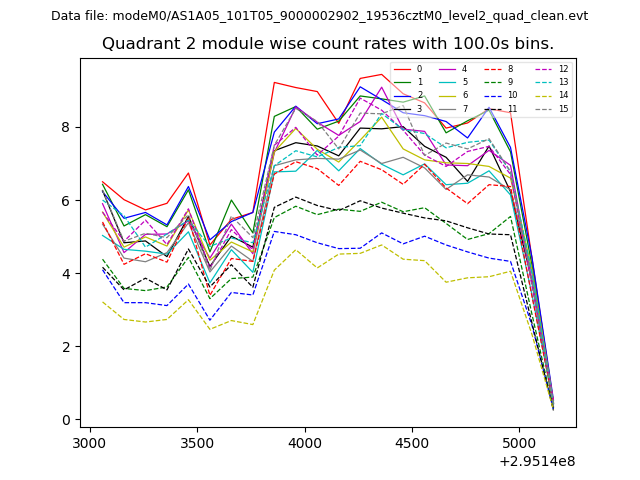
| Module-wise count rates for Quadrant B Data is divided into 100 sec bins |
 |
 |
| Module-wise count rates for Quadrant C Data is divided into 100 sec bins |
 |
 |
| Module-wise count rates for Quadrant D Data is divided into 100 sec bins |
 |
 |
| Parameter | Plot |
|---|---|
| CZT HV Monitor | 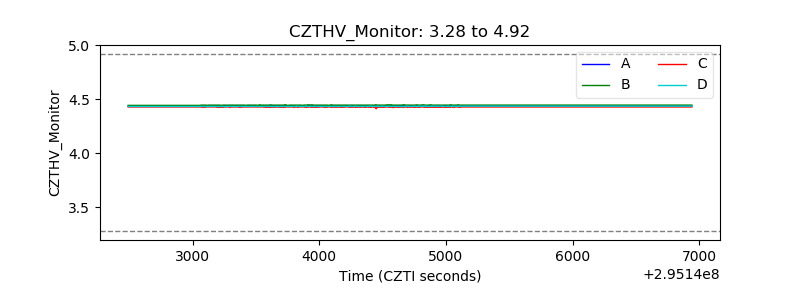 |
| D_VDD | 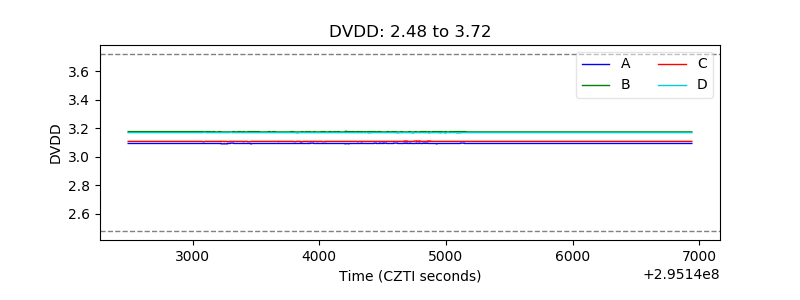 |
| Temperature 1 | 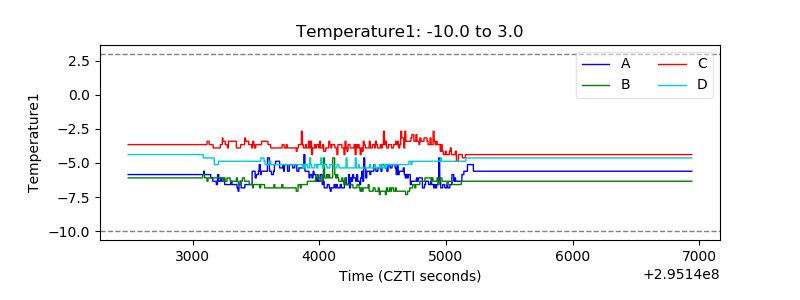 |
| Veto HV Monitor | 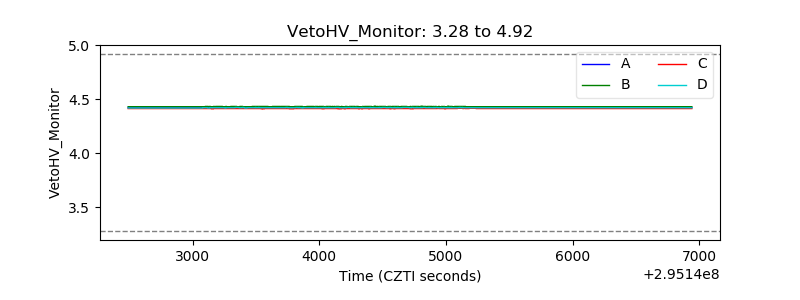 |
| Veto LLD | 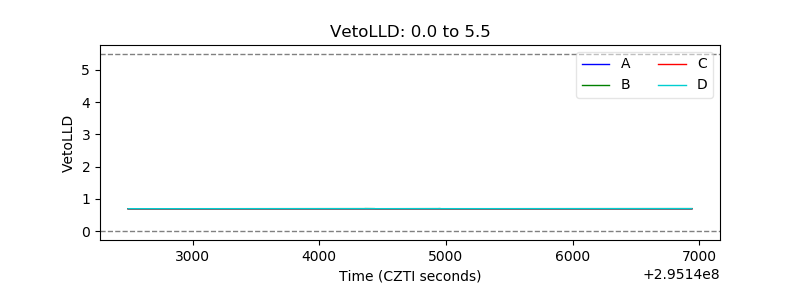 |
| Alpha Counter | 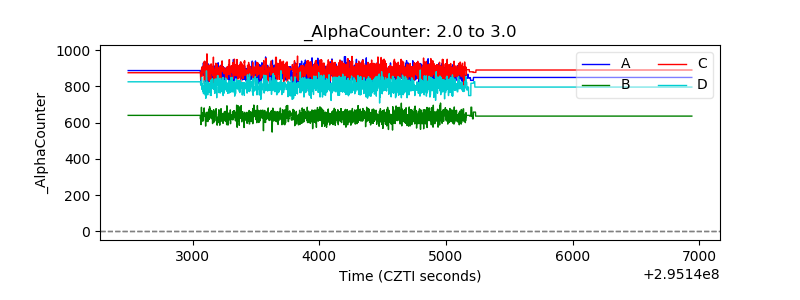 |
| _CPM_Rate | 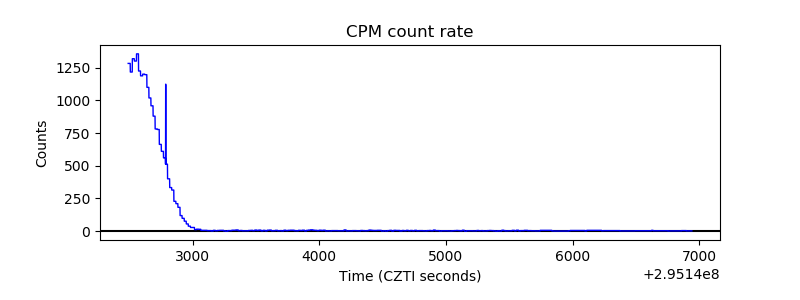 |
| CZT Counter | 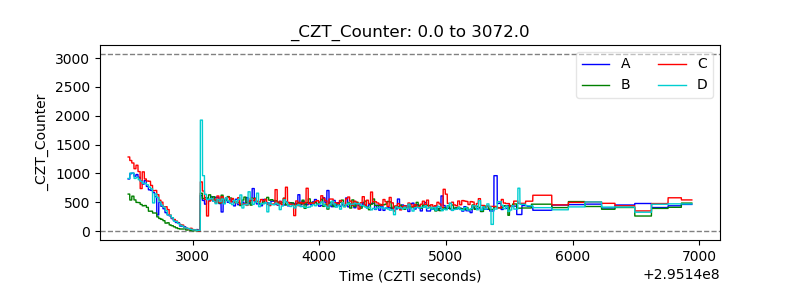 |
| +2.5 Volts monitor |  |
| +5 Volts monitor |  |
| _ROLL_ROT | 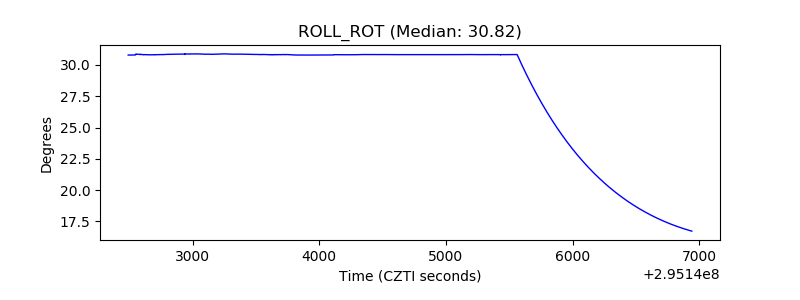 |
| _Roll_DEC | 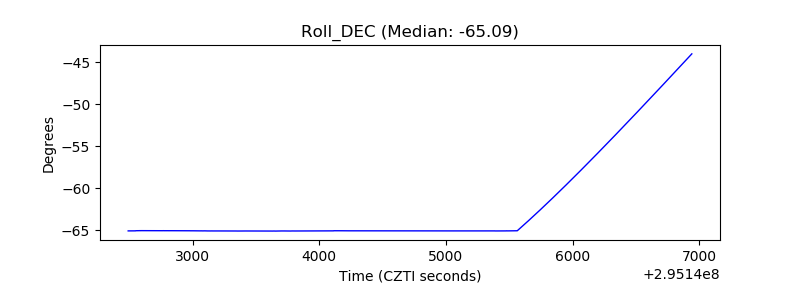 |
| _Roll_RA | 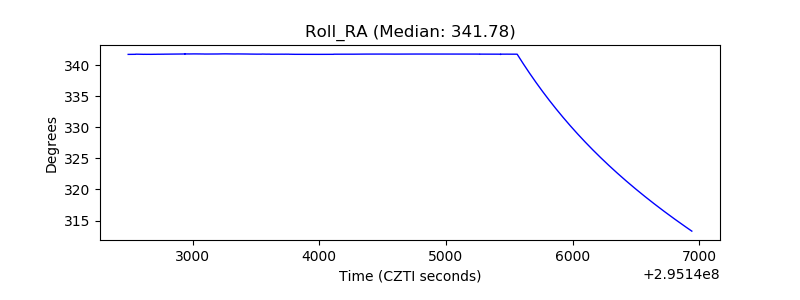 |
| Veto Counter | 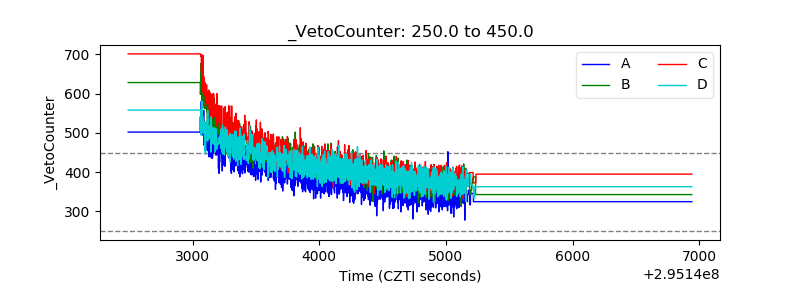 |