| Param | Original file | Final file |
|---|---|---|
| Filename | modeM0/AS1A05_101T05_9000002902_19540cztM0_level2.evt | modeM0/AS1A05_101T05_9000002902_19540cztM0_level2_quad_clean.evt |
| Size (bytes) | 262,186,560 | 77,460,480 |
| Size | 250.0 MB | 73.9 MB |
| Events in quadrant A | 1,813,805 | 521,535 |
| Events in quadrant B | 1,869,458 | 527,030 |
| Events in quadrant C | 2,088,075 | 507,066 |
| Events in quadrant D | 1,891,226 | 503,766 |
| Mode SS | |||
|---|---|---|---|
| Quadrant | BADHDUFLAG | Total packets | Discarded packets |
| A | 0 | 82 | 0 |
| B | 0 | 82 | 0 |
| C | 0 | 82 | 0 |
| D | 0 | 82 | 0 |
| Mode M9 | |||
|---|---|---|---|
| Quadrant | BADHDUFLAG | Total packets | Discarded packets |
| A | 0 | 7 | 0 |
| B | 0 | 8 | 0 |
| C | 0 | 8 | 0 |
| D | 0 | 8 | 0 |
| Mode M0 | |||
|---|---|---|---|
| Quadrant | BADHDUFLAG | Total packets | Discarded packets |
| A | 0 | 8185 | 1 |
| B | 0 | 8270 | 1 |
| C | 0 | 8599 | 1 |
| D | 0 | 8522 | 1 |
| Quadrant | Total seconds | Saturated seconds | Saturation percentage |
|---|---|---|---|
| A | 4059 | 3 | 0.073910% |
| B | 4059 | 10 | 0.246366% |
| C | 4059 | 17 | 0.418822% |
| D | 4059 | 15 | 0.369549% |
Noise dominated data is calculated using 1-second bins in cleaned event files. If a bin has >2000 counts, and if more than 50% of those come from <1% of pixels, then it is considered to be noise-dominated and hence unusable.
| Quadrant | # 1 sec bins | Bins with >0 counts | Bins with >2000 counts | High rate bins dominated by noise | Noise dominated (total time) | Noise dominated (detector-on time) | Marked lightcurve |
|---|---|---|---|---|---|---|---|
| A | 4059 | 4059 | 0 | 0 | 0.00% | 0.00% | 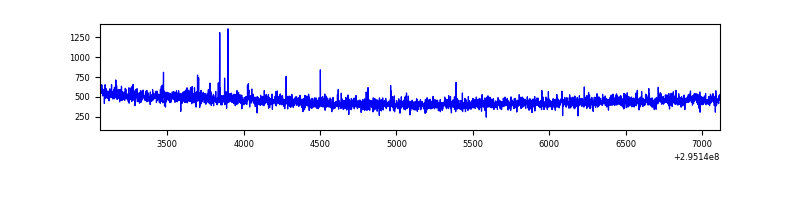 |
| B | 4059 | 4059 | 4 | 4 | 0.10% | 0.10% | 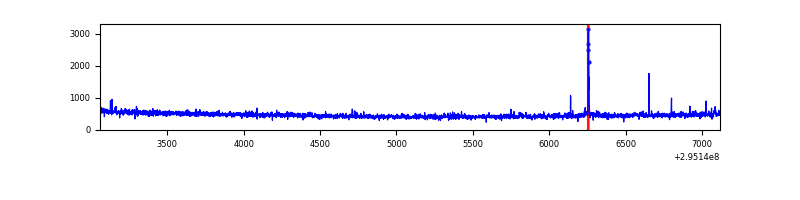 |
| C | 4059 | 4059 | 0 | 0 | 0.00% | 0.00% | 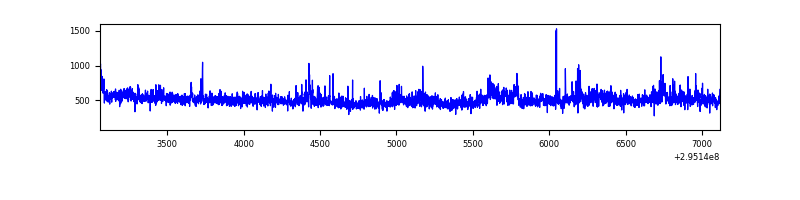 |
| D | 4059 | 4059 | 11 | 11 | 0.27% | 0.27% | 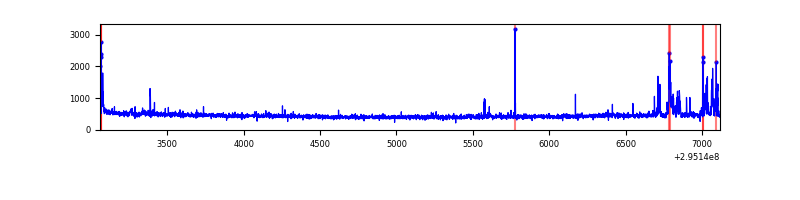 |
Top three noisy pixels from each quadrant. If the there are fewer than three noisy pixels in the level2.evt file, extra rows are filled as -1
| Pixel properties | Quadrant properties | ||||||
|---|---|---|---|---|---|---|---|
| Quadrant | DetID | PixID | Counts | Sigma | Mean | Median | Sigma |
| A | 4 | 2 | 7459 | 73.25 | 468 | 458 | 95.6 |
| A | 13 | 254 | 5524 | 53.01 | 468 | 458 | 95.6 |
| A | 0 | 226 | 3965 | 36.69 | 468 | 458 | 95.6 |
| B | 3 | 64 | 20987 | 231.73 | 467 | 456 | 88.6 |
| B | 0 | 198 | 10921 | 118.12 | 467 | 456 | 88.6 |
| B | 12 | 111 | 10493 | 113.29 | 467 | 456 | 88.6 |
| C | 3 | 233 | 215809 | 1984.82 | 459 | 464 | 108.5 |
| C | 14 | 238 | 72113 | 660.38 | 459 | 464 | 108.5 |
| C | 0 | 207 | 8913 | 77.87 | 459 | 464 | 108.5 |
| D | 12 | 233 | 74632 | 662.55 | 462 | 450 | 112.0 |
| D | 12 | 218 | 41583 | 367.38 | 462 | 450 | 112.0 |
| D | 2 | 234 | 14581 | 126.21 | 462 | 450 | 112.0 |
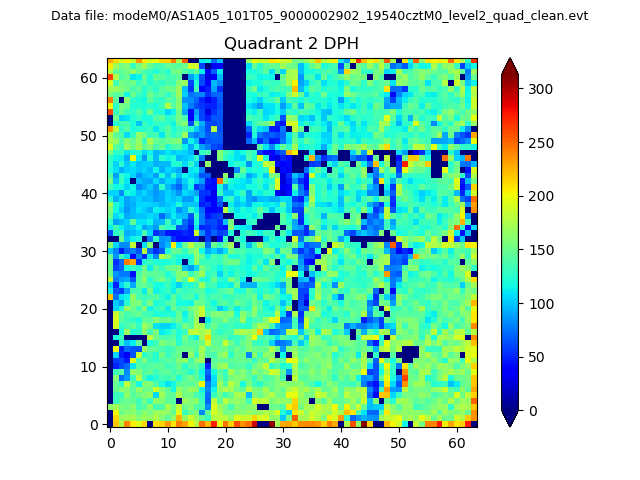
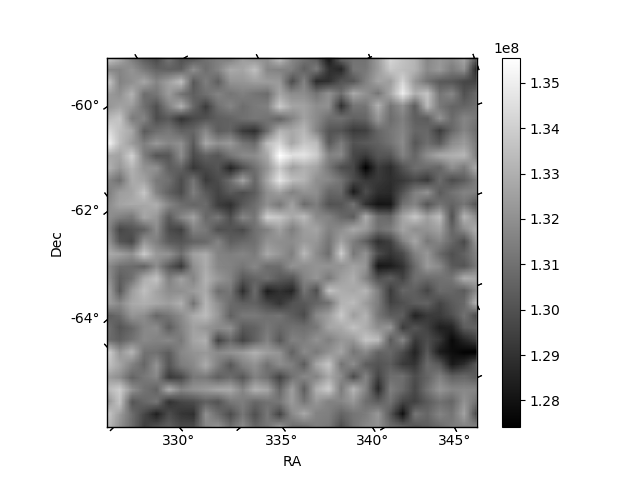
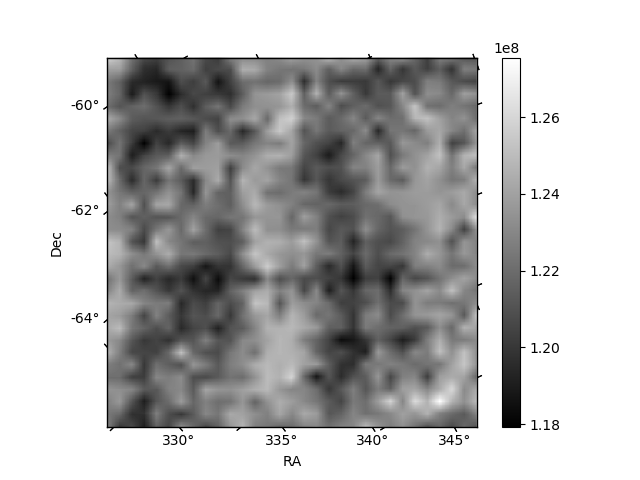
Histogram calculated using DETX and DETY for each event in the final _common_clean file
| Quadrant A | 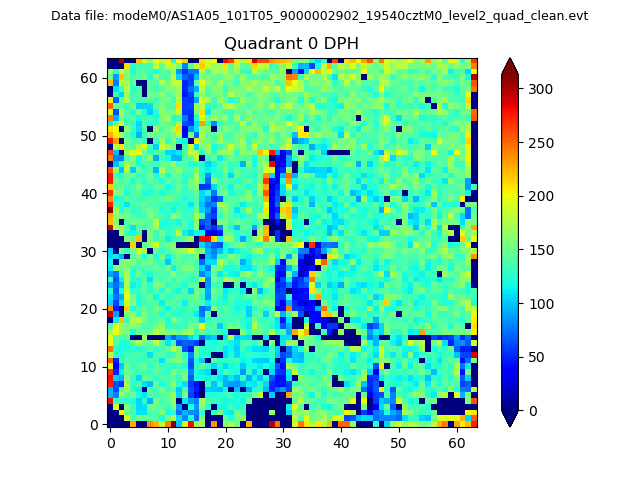 |
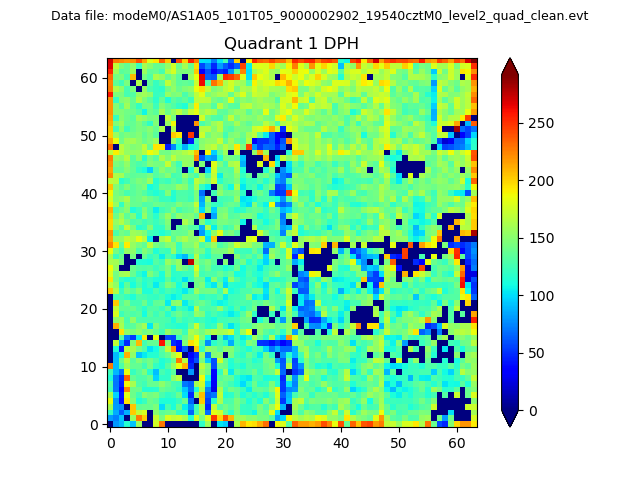 |
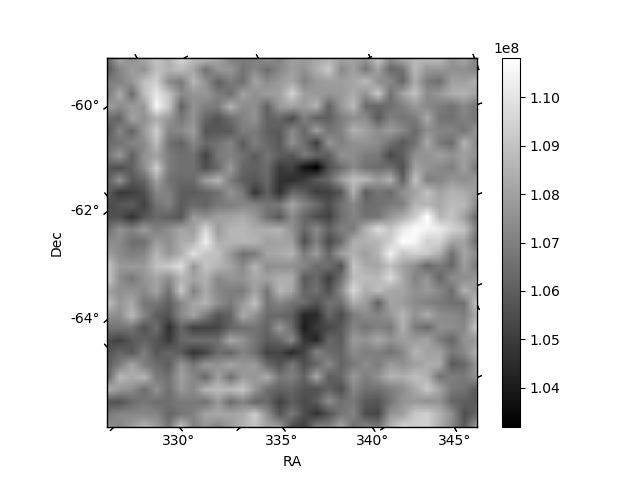
Quadrant B |
|---|---|---|---|
| Quadrant D | 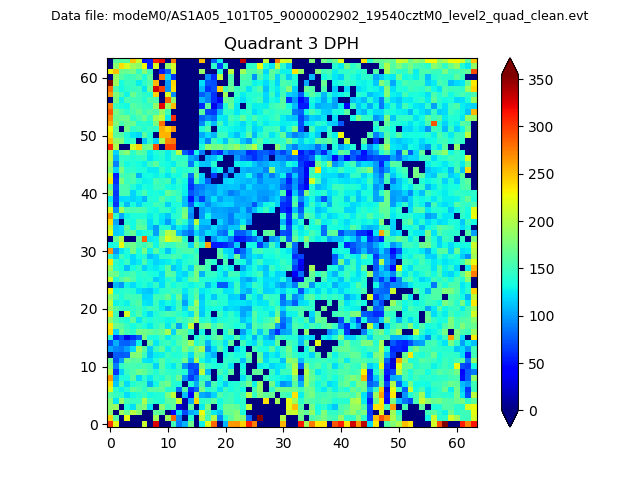 |
 |
Quadrant C |
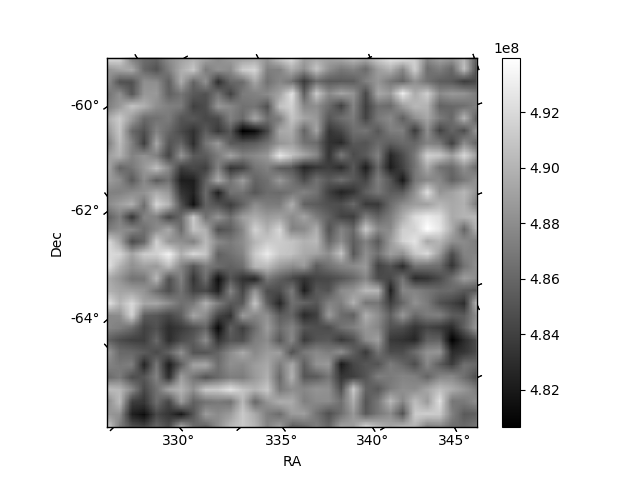
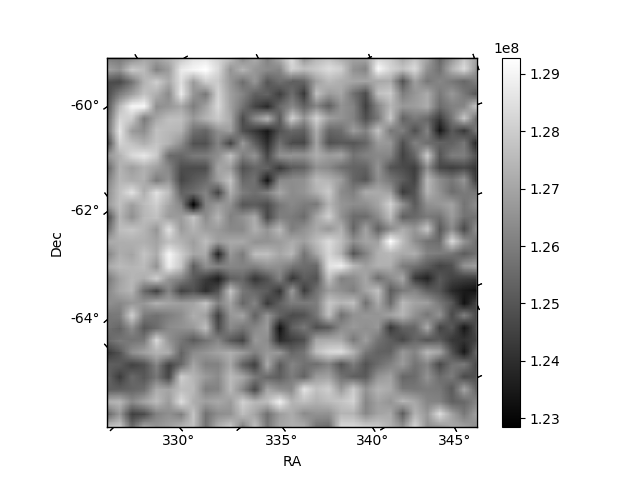
| Plot type | Count rate plots | Images |
|---|---|---|
| Comparison with Poisson distribution Blue bars denote a histogram of data divided into 1 sec bins. Red curve is a Poisson curve with rate = median count rate of data. |
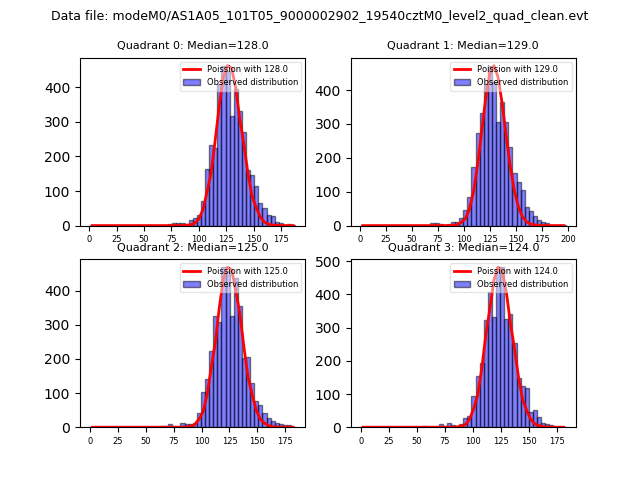 |
 |
| Quadrant-wise count rates Data is divided into 100 sec bins |
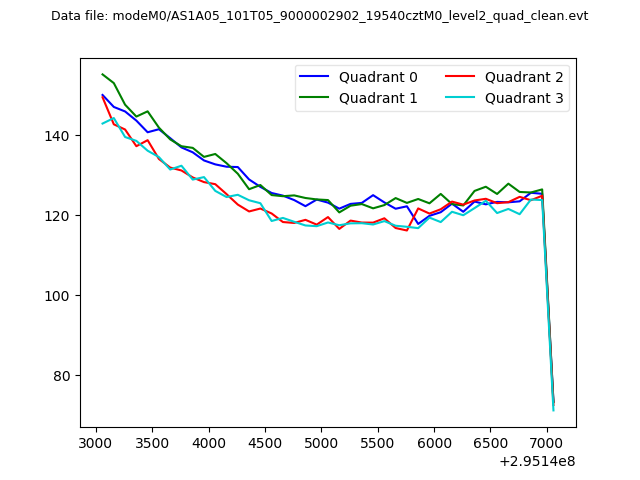 |
|
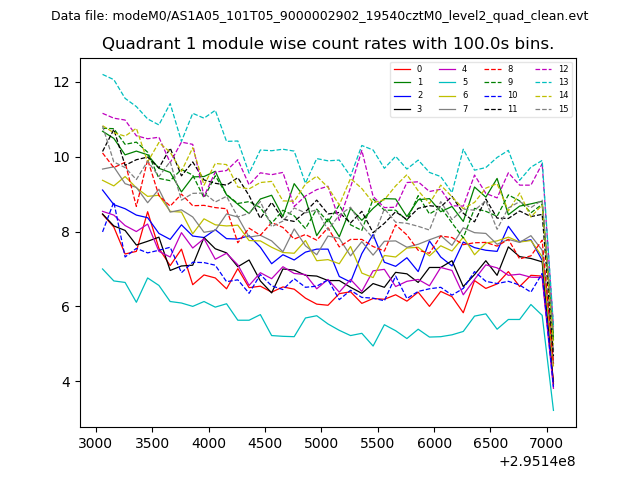
| Module-wise count rates for Quadrant A Data is divided into 100 sec bins |
 |
 |
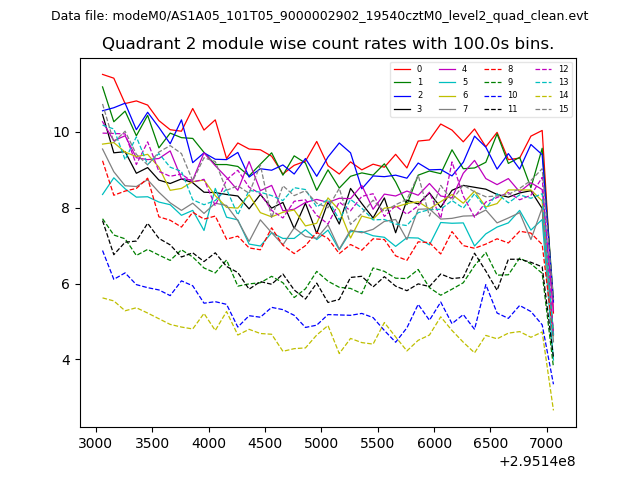
| Module-wise count rates for Quadrant B Data is divided into 100 sec bins |
 |
 |
| Module-wise count rates for Quadrant C Data is divided into 100 sec bins |
 |
 |
| Module-wise count rates for Quadrant D Data is divided into 100 sec bins |
 |
 |
| Parameter | Plot |
|---|---|
| CZT HV Monitor | 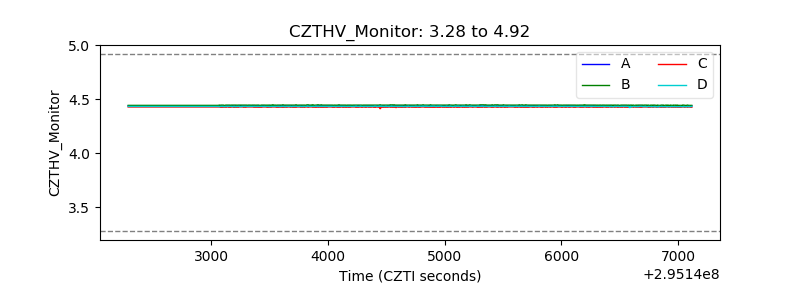 |
| D_VDD | 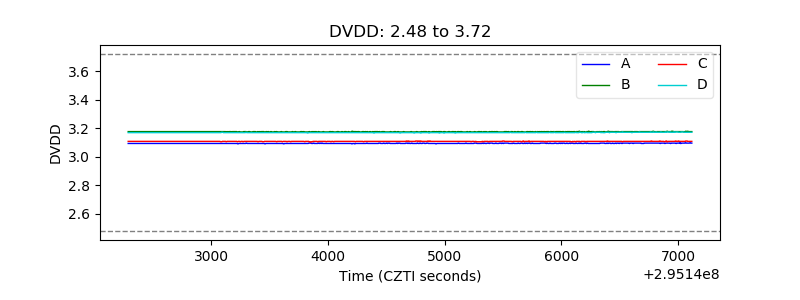 |
| Temperature 1 | 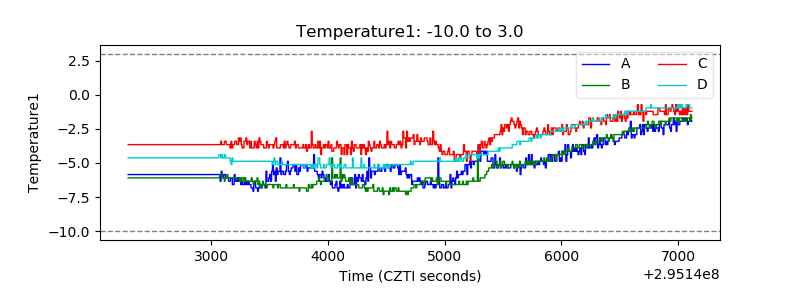 |
| Veto HV Monitor | 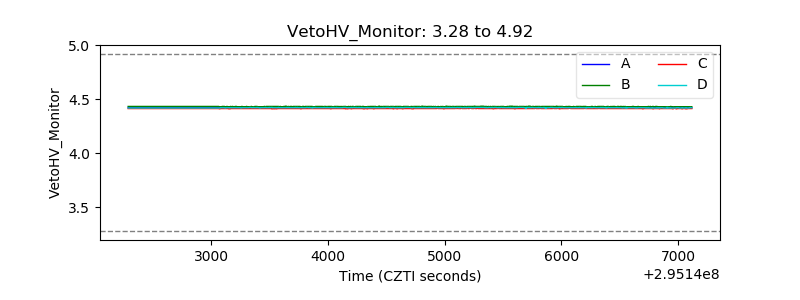 |
| Veto LLD |  |
| Alpha Counter | 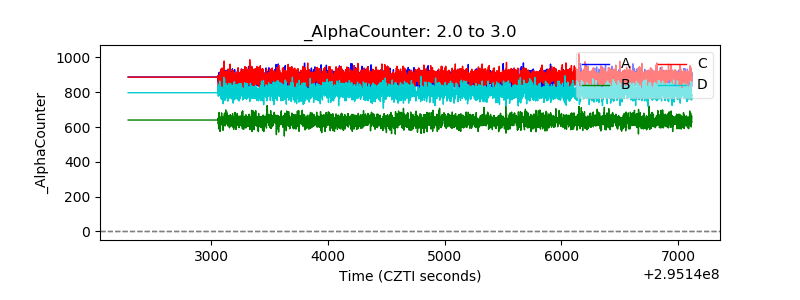 |
| _CPM_Rate | 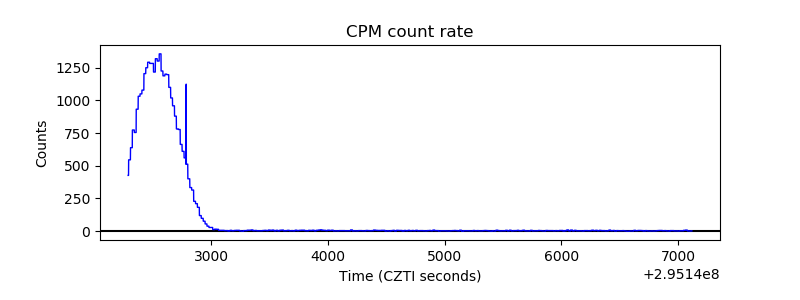 |
| CZT Counter | 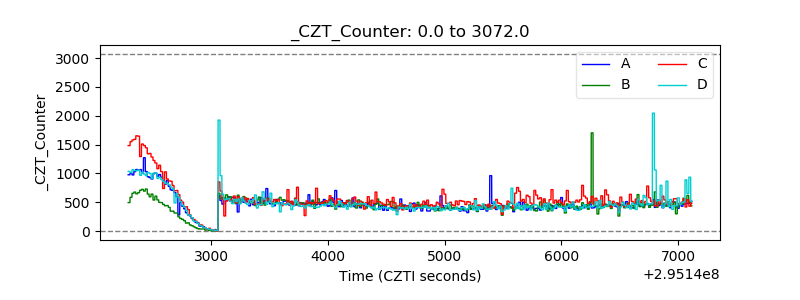 |
| +2.5 Volts monitor |  |
| +5 Volts monitor |  |
| _ROLL_ROT | 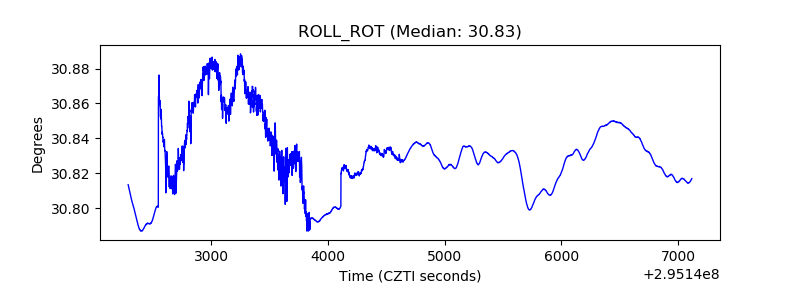 |
| _Roll_DEC | 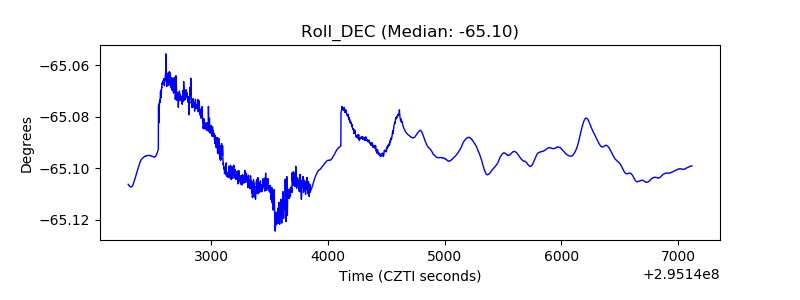 |
| _Roll_RA | 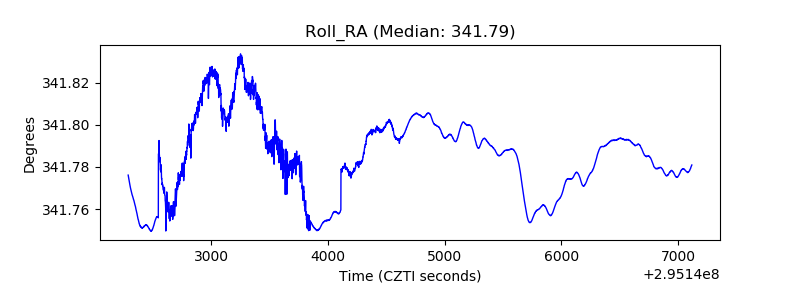 |
| Veto Counter |  |