| Param | Original file | Final file |
|---|---|---|
| Filename | modeM0/AS1T03_056T01_9000002900cztM0_level2.fits | modeM0/AS1T03_056T01_9000002900cztM0_level2_quad_clean.evt |
| Size (bytes) | 81,662,400 | 80,956,800 |
| Size | 77.9 MB | 77.2 MB |
| Events in quadrant A | 497,080 | 484,877 |
| Events in quadrant B | 475,236 | 481,910 |
| Events in quadrant C | 477,920 | 454,577 |
| Events in quadrant D | 417,504 | 424,398 |
| Mode SS | |||
|---|---|---|---|
| Quadrant | BADHDUFLAG | Total packets | Discarded packets |
| A | 0 | 176 | 0 |
| B | 0 | 176 | 0 |
| C | 0 | 176 | 0 |
| D | 0 | 176 | 0 |
| Mode M9 | |||
|---|---|---|---|
| Quadrant | BADHDUFLAG | Total packets | Discarded packets |
| A | 0 | 5 | 0 |
| B | 0 | 5 | 0 |
| C | 0 | 5 | 0 |
| D | 0 | 5 | 0 |
| Mode M0 | |||
|---|---|---|---|
| Quadrant | BADHDUFLAG | Total packets | Discarded packets |
| A | 0 | 17910 | 0 |
| B | 0 | 18529 | 0 |
| C | 0 | 18956 | 0 |
| D | 0 | 21300 | 0 |
| Quadrant | Total seconds | Saturated seconds | Saturation percentage |
|---|---|---|---|
| A | 8723 | 127 | 1.455921% |
| B | 8723 | 161 | 1.845695% |
| C | 8723 | 221 | 2.533532% |
| D | 8723 | 431 | 4.940961% |
Noise dominated data is calculated using 1-second bins in cleaned event files. If a bin has >2000 counts, and if more than 50% of those come from <1% of pixels, then it is considered to be noise-dominated and hence unusable.
| Quadrant | # 1 sec bins | Bins with >0 counts | Bins with >2000 counts | High rate bins dominated by noise | Noise dominated (total time) | Noise dominated (detector-on time) | Marked lightcurve |
|---|---|---|---|---|---|---|---|
| A | 9062 | 8722 | 0 | 0 | 0.00% | 0.00% |  |
| B | 9062 | 8722 | 0 | 0 | 0.00% | 0.00% |  |
| C | 9062 | 8722 | 0 | 0 | 0.00% | 0.00% |  |
| D | 9061 | 8716 | 0 | 0 | 0.00% | 0.00% |  |
Top three noisy pixels from each quadrant. If the there are fewer than three noisy pixels in the level2.evt file, extra rows are filled as -1
| Pixel properties | Quadrant properties | ||||||
|---|---|---|---|---|---|---|---|
| Quadrant | DetID | PixID | Counts | Sigma | Mean | Median | Sigma |
| A | 0 | 29 | 494 | 10.5 | 129 | 121 | 35.5 |
| A | 7 | 110 | 384 | 7.4 | 129 | 121 | 35.5 |
| A | 9 | 19 | 379 | 7.26 | 129 | 121 | 35.5 |
| B | 2 | 9 | 376 | 9.09 | 125 | 119 | 28.3 |
| B | 5 | 225 | 329 | 7.43 | 125 | 119 | 28.3 |
| B | 3 | 17 | 328 | 7.39 | 125 | 119 | 28.3 |
| C | 12 | 250 | 342 | 6.58 | 126 | 117 | 34.2 |
| C | 12 | 249 | 341 | 6.56 | 126 | 117 | 34.2 |
| C | 2 | 31 | 340 | 6.53 | 126 | 117 | 34.2 |
| D | 1 | 19 | 317 | 6.26 | 119 | 108 | 33.4 |
| D | 3 | 14 | 313 | 6.14 | 119 | 108 | 33.4 |
| D | 1 | 3 | 306 | 5.93 | 119 | 108 | 33.4 |
Histogram calculated using DETX and DETY for each event in the final _common_clean file
| Quadrant A |  |
 |
Quadrant B |
|---|---|---|---|
| Quadrant D |  |
 |
Quadrant C |
| Plot type | Count rate plots | Images |
|---|---|---|
| Comparison with Poisson distribution Blue bars denote a histogram of data divided into 1 sec bins. Red curve is a Poisson curve with rate = median count rate of data. |
 |
 |
| Quadrant-wise count rates Data is divided into 100 sec bins |
 |
|
| Module-wise count rates for Quadrant A Data is divided into 100 sec bins |
 |
 |
| Module-wise count rates for Quadrant B Data is divided into 100 sec bins |
 |
 |
| Module-wise count rates for Quadrant C Data is divided into 100 sec bins |
 |
 |
| Module-wise count rates for Quadrant D Data is divided into 100 sec bins |
 |
 |
| Parameter | Plot |
|---|---|
| CZT HV Monitor |  |
| D_VDD |  |
| Temperature 1 | 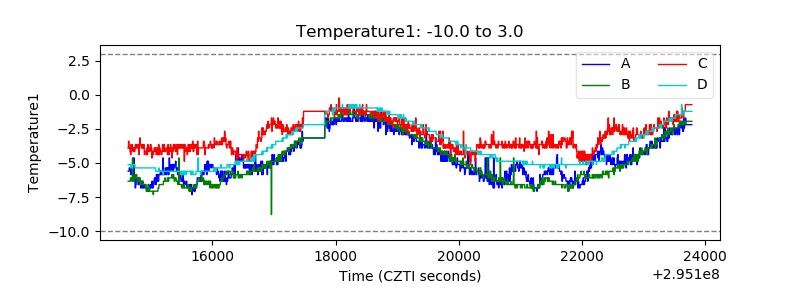 |
| Veto HV Monitor |  |
| Veto LLD |  |
| Alpha Counter |  |
| _CPM_Rate |  |
| CZT Counter |  |
| +2.5 Volts monitor |  |
| +5 Volts monitor |  |
| _ROLL_ROT |  |
| _Roll_DEC |  |
| _Roll_RA |  |
| Veto Counter |  |