| Param | Original file | Final file |
|---|---|---|
| Filename | modeM0/AS1T03_056T01_9000002900_19534cztM0_level2.evt | modeM0/AS1T03_056T01_9000002900_19534cztM0_level2_quad_clean.evt |
| Size (bytes) | 431,182,080 | 72,264,960 |
| Size | 411.2 MB | 68.9 MB |
| Events in quadrant A | 2,795,732 | 453,320 |
| Events in quadrant B | 3,013,689 | 456,284 |
| Events in quadrant C | 3,019,831 | 434,982 |
| Events in quadrant D | 3,827,516 | 431,027 |
| Mode SS | |||
|---|---|---|---|
| Quadrant | BADHDUFLAG | Total packets | Discarded packets |
| A | 0 | 120 | 0 |
| B | 0 | 120 | 0 |
| C | 0 | 120 | 0 |
| D | 0 | 120 | 0 |
| Mode M9 | |||
|---|---|---|---|
| Quadrant | BADHDUFLAG | Total packets | Discarded packets |
| A | 0 | 5 | 0 |
| B | 0 | 5 | 0 |
| C | 0 | 5 | 0 |
| D | 0 | 5 | 0 |
| Mode M0 | |||
|---|---|---|---|
| Quadrant | BADHDUFLAG | Total packets | Discarded packets |
| A | 0 | 12148 | 1 |
| B | 0 | 12772 | 1 |
| C | 0 | 12647 | 1 |
| D | 0 | 15415 | 1 |
| Quadrant | Total seconds | Saturated seconds | Saturation percentage |
|---|---|---|---|
| A | 5903 | 111 | 1.880400% |
| B | 5904 | 129 | 2.184959% |
| C | 5904 | 180 | 3.048780% |
| D | 5904 | 406 | 6.876694% |
Noise dominated data is calculated using 1-second bins in cleaned event files. If a bin has >2000 counts, and if more than 50% of those come from <1% of pixels, then it is considered to be noise-dominated and hence unusable.
| Quadrant | # 1 sec bins | Bins with >0 counts | Bins with >2000 counts | High rate bins dominated by noise | Noise dominated (total time) | Noise dominated (detector-on time) | Marked lightcurve |
|---|---|---|---|---|---|---|---|
| A | 6242 | 5903 | 0 | 0 | 0.00% | 0.00% | 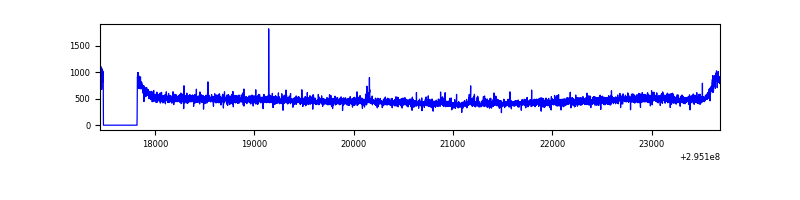 |
| B | 6243 | 5904 | 8 | 8 | 0.13% | 0.14% | 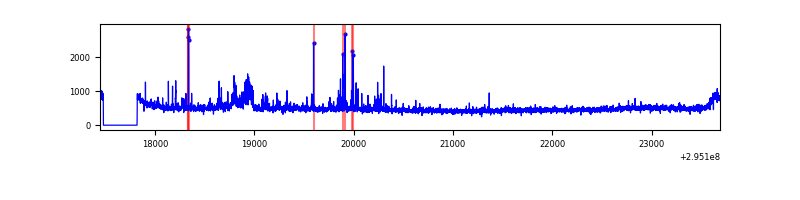 |
| C | 6243 | 5904 | 6 | 6 | 0.10% | 0.10% | 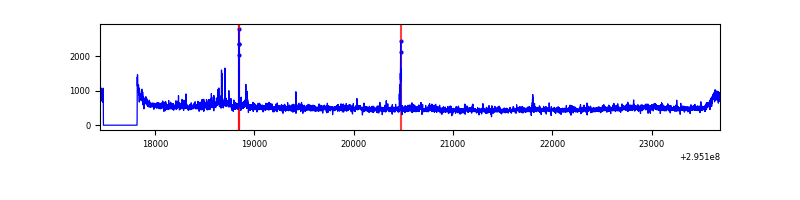 |
| D | 6243 | 5904 | 251 | 251 | 4.02% | 4.25% | 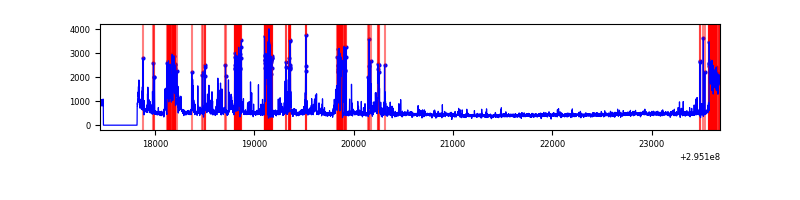 |
Top three noisy pixels from each quadrant. If the there are fewer than three noisy pixels in the level2.evt file, extra rows are filled as -1
| Pixel properties | Quadrant properties | ||||||
|---|---|---|---|---|---|---|---|
| Quadrant | DetID | PixID | Counts | Sigma | Mean | Median | Sigma |
| A | 12 | 16 | 10880 | 68.86 | 720 | 703 | 147.8 |
| A | 13 | 254 | 7546 | 46.3 | 720 | 703 | 147.8 |
| A | 12 | 194 | 6913 | 42.02 | 720 | 703 | 147.8 |
| B | 0 | 190 | 86487 | 611.24 | 713 | 695 | 140.4 |
| B | 7 | 220 | 30053 | 209.17 | 713 | 695 | 140.4 |
| B | 6 | 36 | 23381 | 161.63 | 713 | 695 | 140.4 |
| C | 3 | 233 | 228997 | 1416.89 | 682 | 685 | 161.1 |
| C | 14 | 238 | 107059 | 660.15 | 682 | 685 | 161.1 |
| C | 10 | 223 | 14732 | 87.17 | 682 | 685 | 161.1 |
| D | 12 | 218 | 561617 | 3382.03 | 676 | 656 | 165.9 |
| D | 12 | 233 | 499907 | 3009.98 | 676 | 656 | 165.9 |
| D | 10 | 34 | 65300 | 389.74 | 676 | 656 | 165.9 |
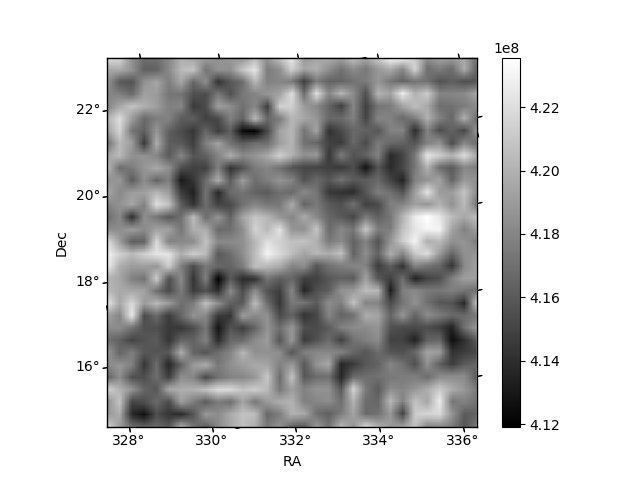
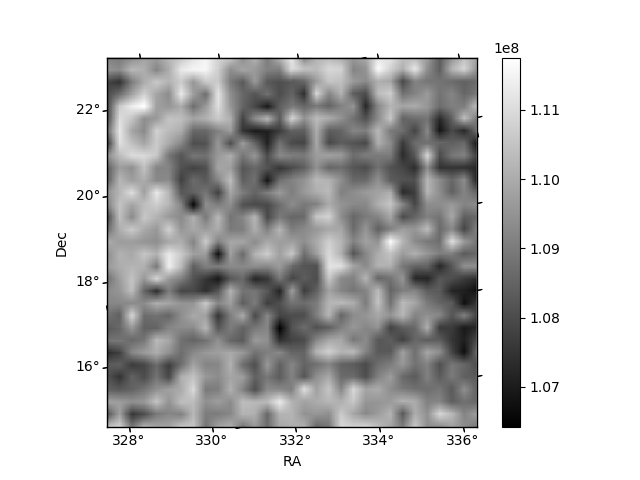
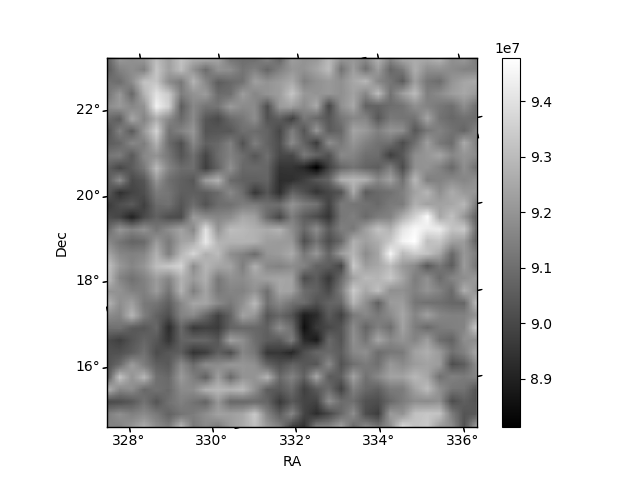
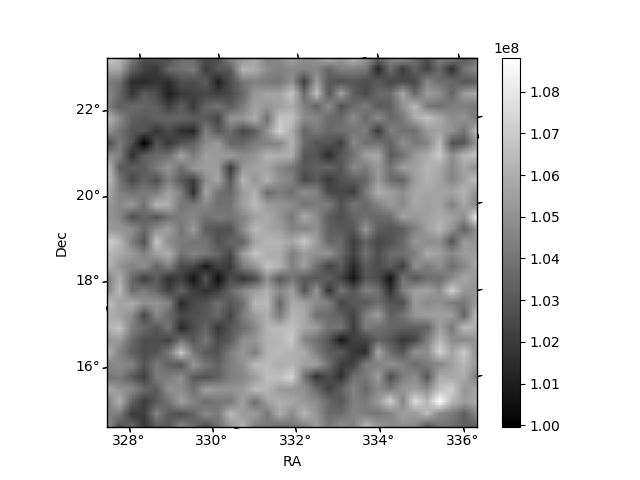
Histogram calculated using DETX and DETY for each event in the final _common_clean file
| Quadrant A | 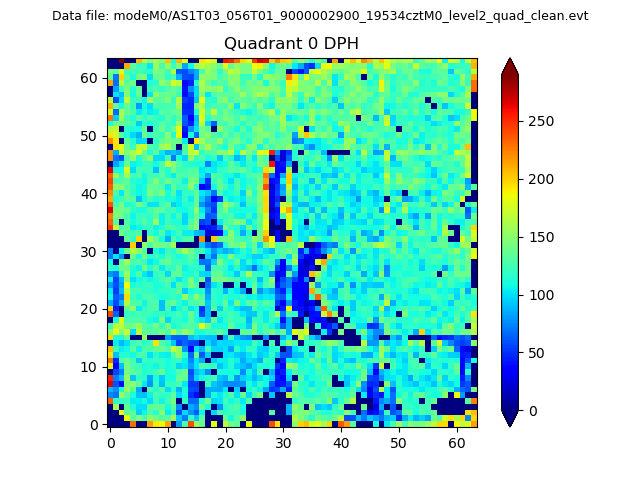 |
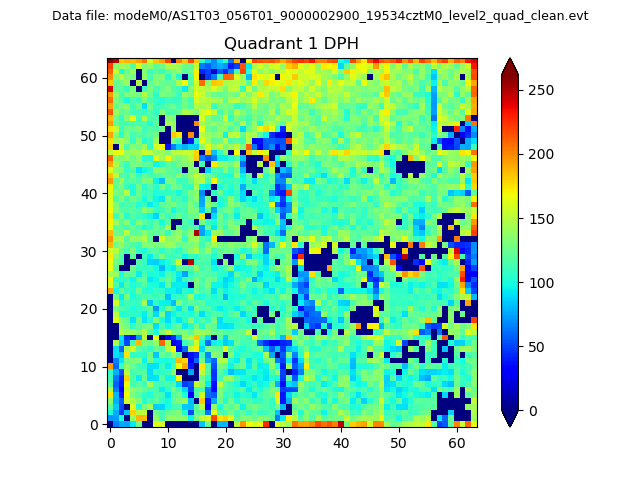 |
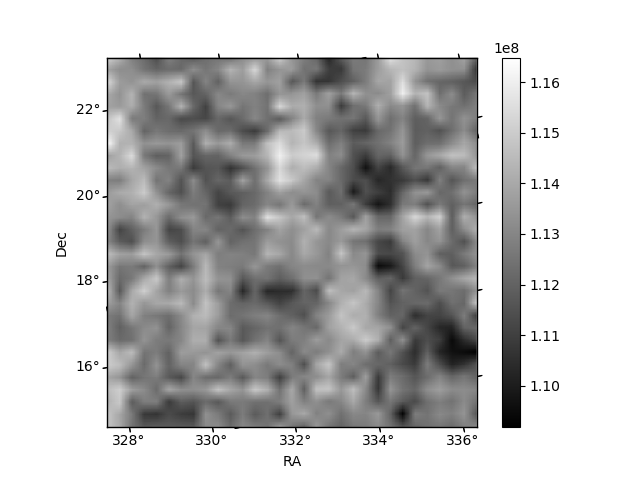
Quadrant B |
|---|---|---|---|
| Quadrant D | 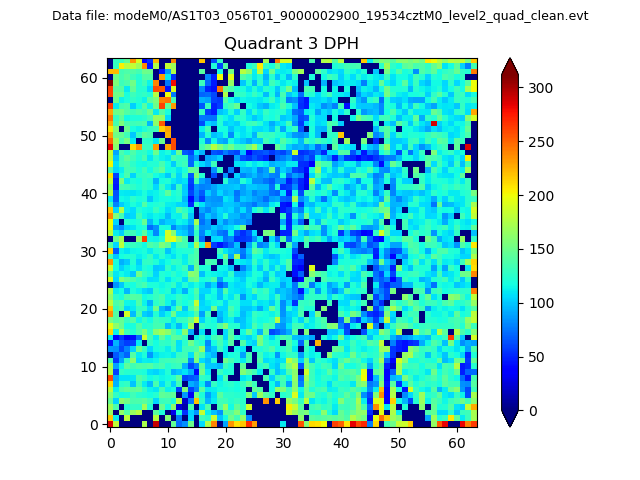 |
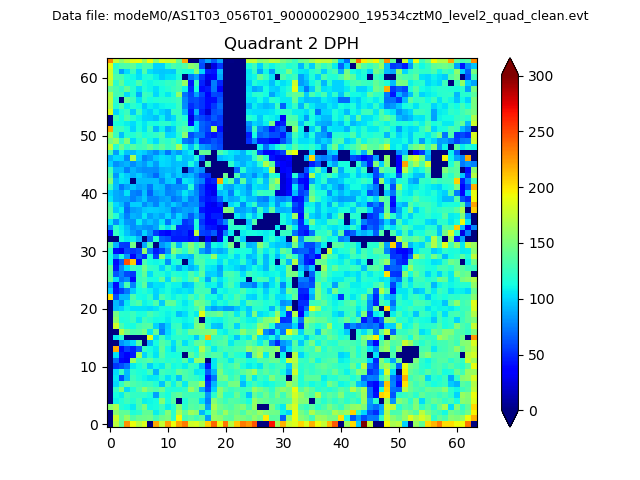 |
Quadrant C |
| Plot type | Count rate plots | Images |
|---|---|---|
| Comparison with Poisson distribution Blue bars denote a histogram of data divided into 1 sec bins. Red curve is a Poisson curve with rate = median count rate of data. |
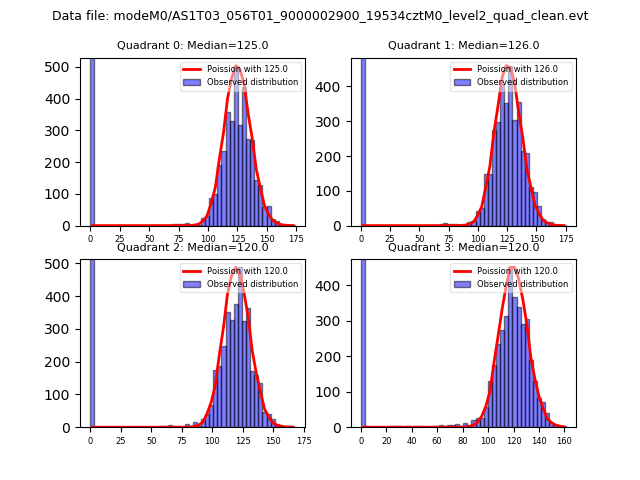 |
 |
| Quadrant-wise count rates Data is divided into 100 sec bins |
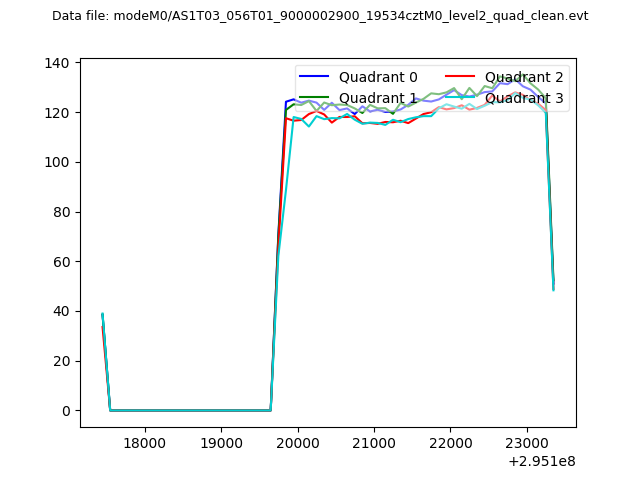 |
|
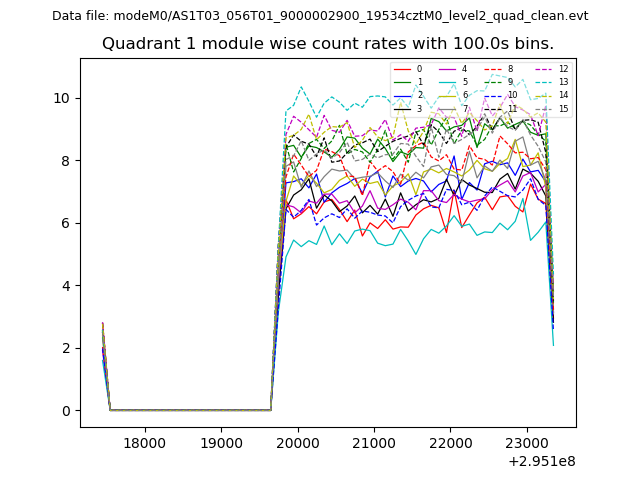
| Module-wise count rates for Quadrant A Data is divided into 100 sec bins |
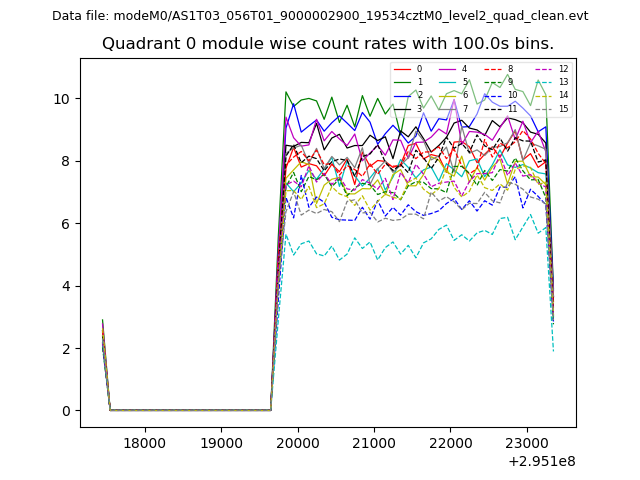 |
 |
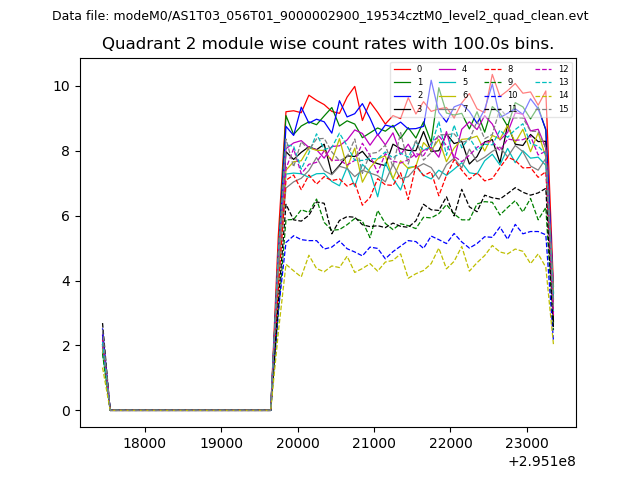
| Module-wise count rates for Quadrant B Data is divided into 100 sec bins |
 |
 |
| Module-wise count rates for Quadrant C Data is divided into 100 sec bins |
 |
 |
| Module-wise count rates for Quadrant D Data is divided into 100 sec bins |
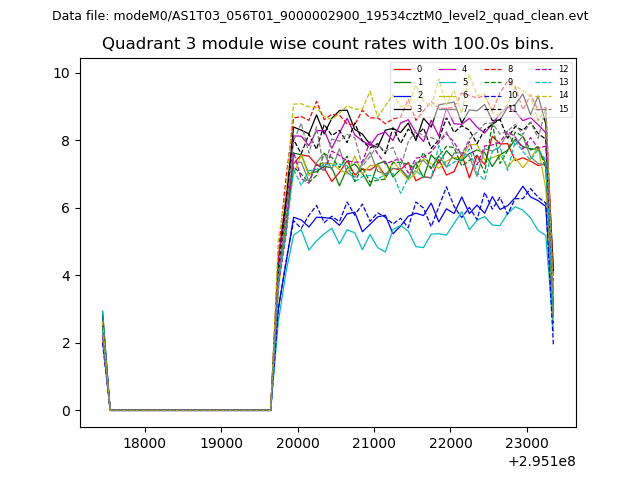 |
 |
| Parameter | Plot |
|---|---|
| CZT HV Monitor | 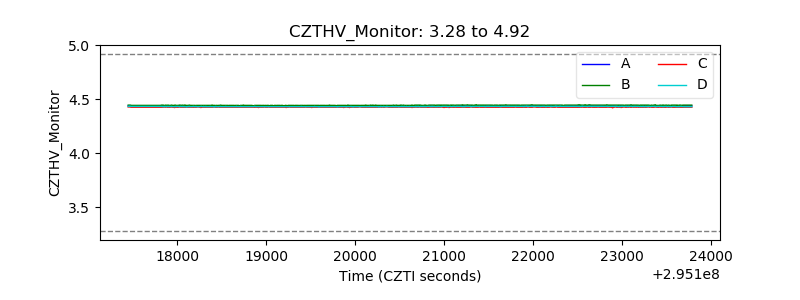 |
| D_VDD | 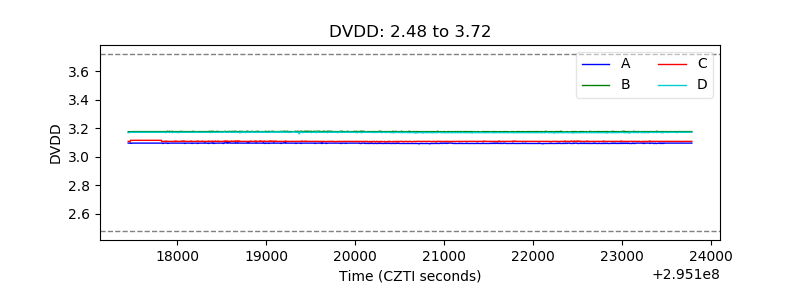 |
| Temperature 1 | 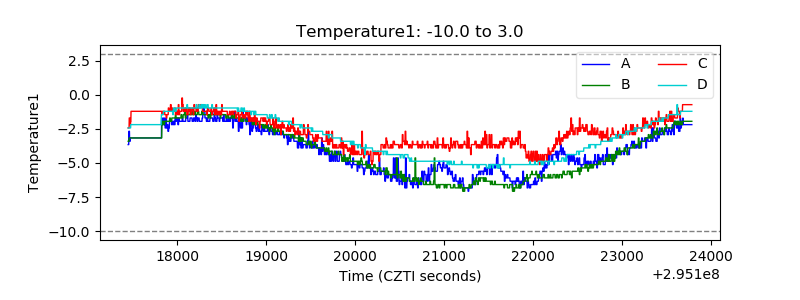 |
| Veto HV Monitor | 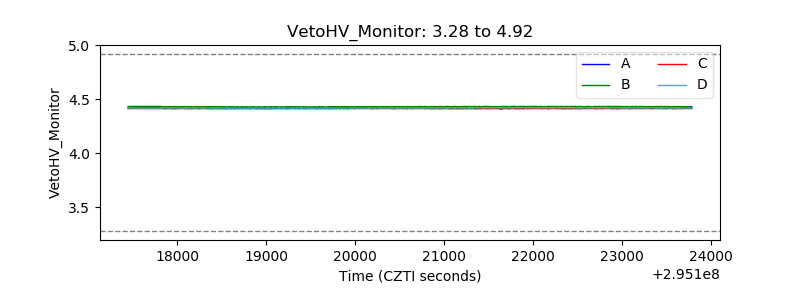 |
| Veto LLD | 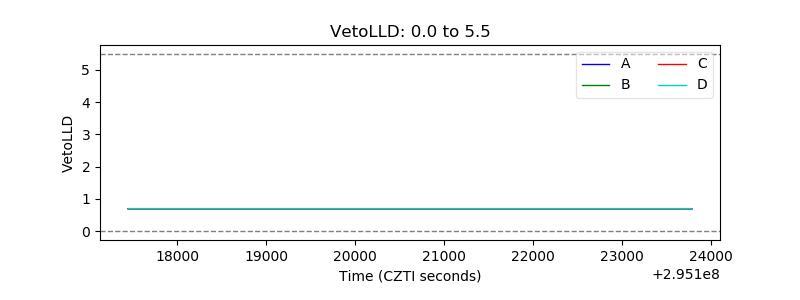 |
| Alpha Counter | 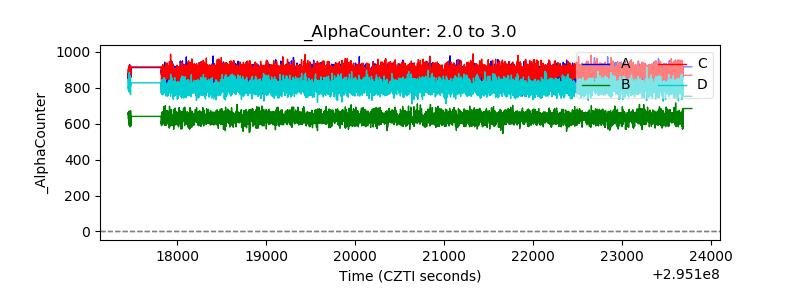 |
| _CPM_Rate | 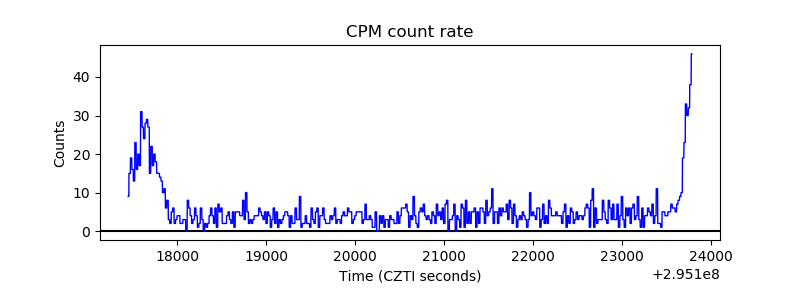 |
| CZT Counter | 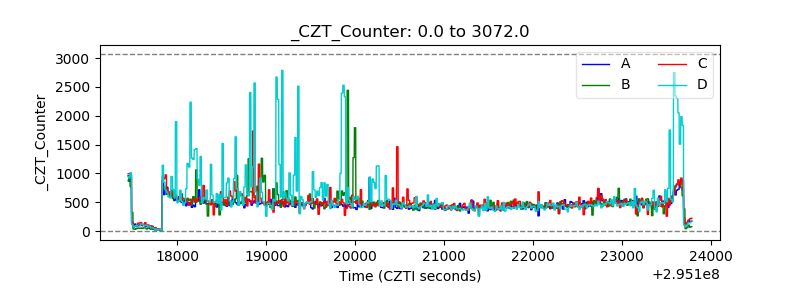 |
| +2.5 Volts monitor | 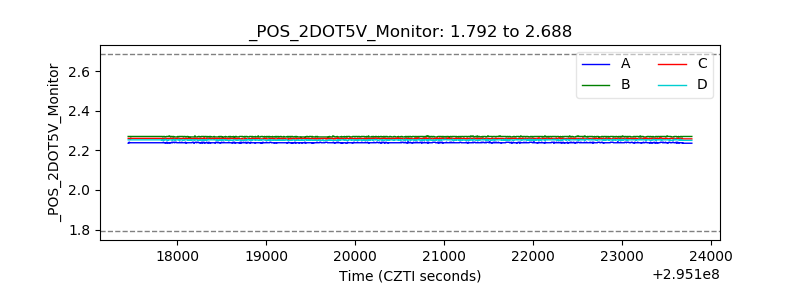 |
| +5 Volts monitor | 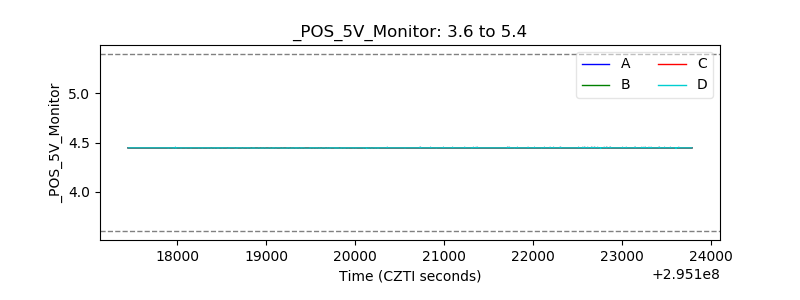 |
| _ROLL_ROT | 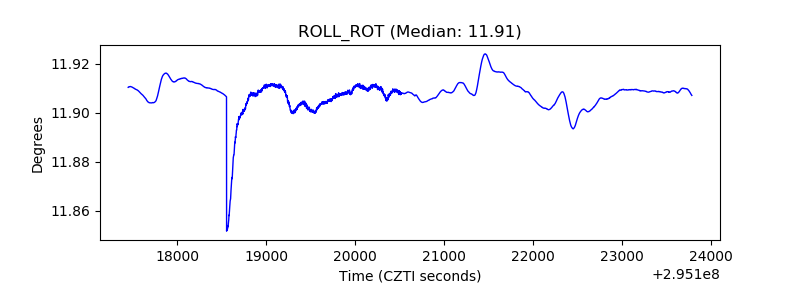 |
| _Roll_DEC | 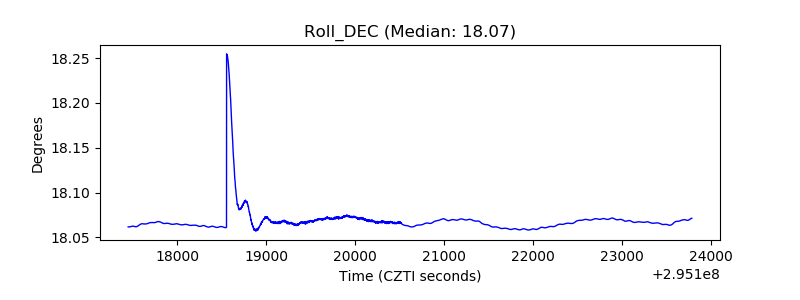 |
| _Roll_RA | 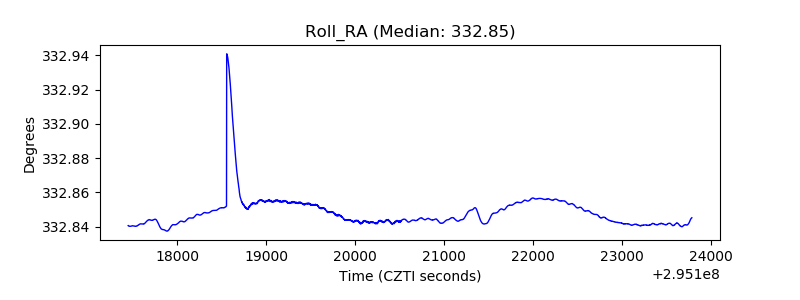 |
| Veto Counter | 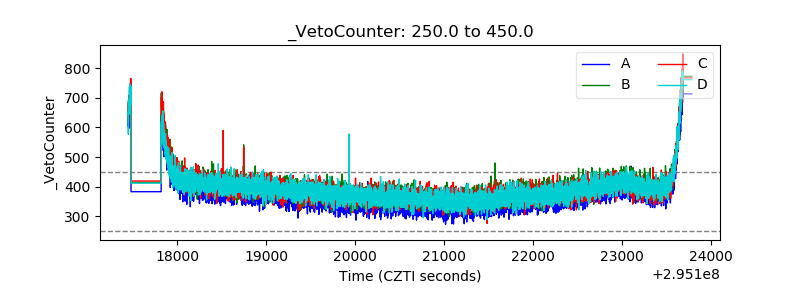 |