| Param | Original file | Final file |
|---|---|---|
| Filename | modeM0/AS1T03_108T01_9000002898cztM0_level2.fits | modeM0/AS1T03_108T01_9000002898cztM0_level2_quad_clean.evt |
| Size (bytes) | 334,036,800 | 245,753,280 |
| Size | 318.6 MB | 234.4 MB |
| Events in quadrant A | 2,094,640 | 1,369,276 |
| Events in quadrant B | 1,994,648 | 1,363,246 |
| Events in quadrant C | 2,025,396 | 1,303,687 |
| Events in quadrant D | 1,785,604 | 1,188,754 |
| Mode M0 | |||
|---|---|---|---|
| Quadrant | BADHDUFLAG | Total packets | Discarded packets |
| A | 0 | 67416 | 0 |
| B | 0 | 69086 | 0 |
| C | 0 | 68694 | 0 |
| D | 0 | 76450 | 0 |
| Mode SS | |||
|---|---|---|---|
| Quadrant | BADHDUFLAG | Total packets | Discarded packets |
| A | 0 | 654 | 0 |
| B | 0 | 654 | 0 |
| C | 0 | 654 | 0 |
| D | 0 | 654 | 0 |
| Mode M9 | |||
|---|---|---|---|
| Quadrant | BADHDUFLAG | Total packets | Discarded packets |
| A | 0 | 60 | 0 |
| B | 0 | 60 | 0 |
| C | 0 | 60 | 0 |
| D | 0 | 60 | 0 |
| Quadrant | Total seconds | Saturated seconds | Saturation percentage |
|---|---|---|---|
| A | 32260 | 483 | 1.497210% |
| B | 32260 | 637 | 1.974582% |
| C | 32260 | 632 | 1.959082% |
| D | 32260 | 938 | 2.907626% |
Noise dominated data is calculated using 1-second bins in cleaned event files. If a bin has >2000 counts, and if more than 50% of those come from <1% of pixels, then it is considered to be noise-dominated and hence unusable.
| Quadrant | # 1 sec bins | Bins with >0 counts | Bins with >2000 counts | High rate bins dominated by noise | Noise dominated (total time) | Noise dominated (detector-on time) | Marked lightcurve |
|---|---|---|---|---|---|---|---|
| A | 38105 | 32256 | 0 | 0 | 0.00% | 0.00% | 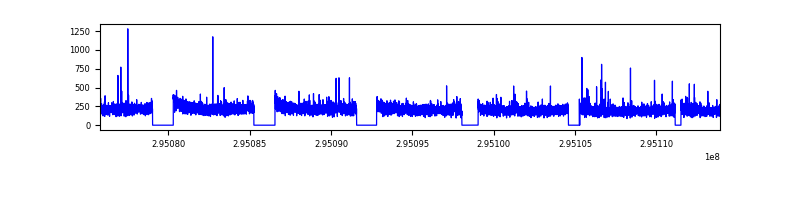 |
| B | 38105 | 32257 | 0 | 0 | 0.00% | 0.00% | 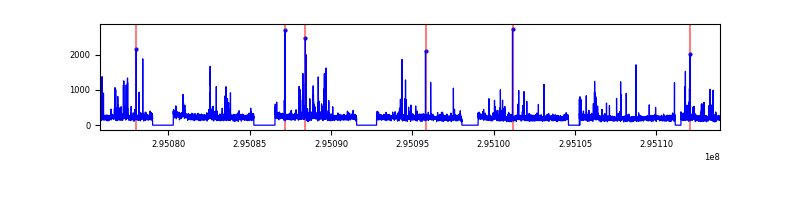 |
| C | 38105 | 32259 | 0 | 0 | 0.00% | 0.00% | 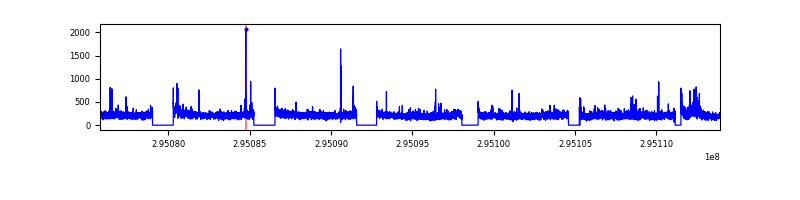 |
| D | 38105 | 32257 | 0 | 0 | 0.00% | 0.00% |  |
Top three noisy pixels from each quadrant. If the there are fewer than three noisy pixels in the level2.evt file, extra rows are filled as -1
| Pixel properties | Quadrant properties | ||||||
|---|---|---|---|---|---|---|---|
| Quadrant | DetID | PixID | Counts | Sigma | Mean | Median | Sigma |
| A | 0 | 29 | 1981 | 11.02 | 545 | 513 | 133.2 |
| A | 7 | 110 | 1716 | 9.03 | 545 | 513 | 133.2 |
| A | 0 | 30 | 1607 | 8.21 | 545 | 513 | 133.2 |
| B | 2 | 9 | 1580 | 10.29 | 526 | 504 | 104.6 |
| B | 5 | 225 | 1373 | 8.31 | 526 | 504 | 104.6 |
| B | 5 | 232 | 1325 | 7.85 | 526 | 504 | 104.6 |
| C | 1 | 80 | 1506 | 7.34 | 535 | 502 | 136.7 |
| C | 1 | 81 | 1446 | 6.9 | 535 | 502 | 136.7 |
| C | 12 | 241 | 1404 | 6.6 | 535 | 502 | 136.7 |
| D | 3 | 14 | 1288 | 6.11 | 511 | 469 | 134.0 |
| D | 15 | 46 | 1283 | 6.07 | 511 | 469 | 134.0 |
| D | 6 | 231 | 1265 | 5.94 | 511 | 469 | 134.0 |
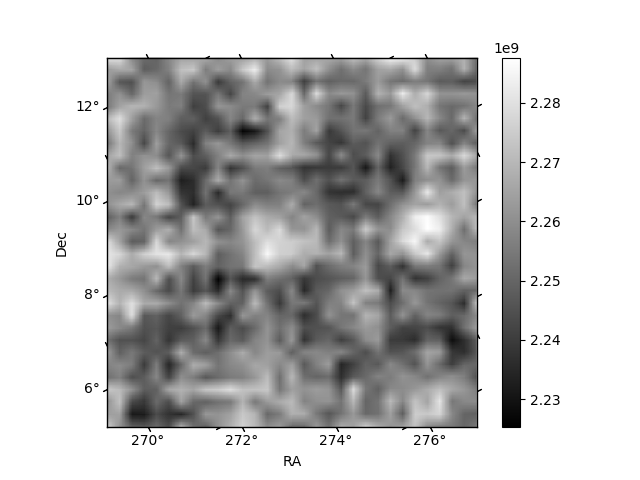
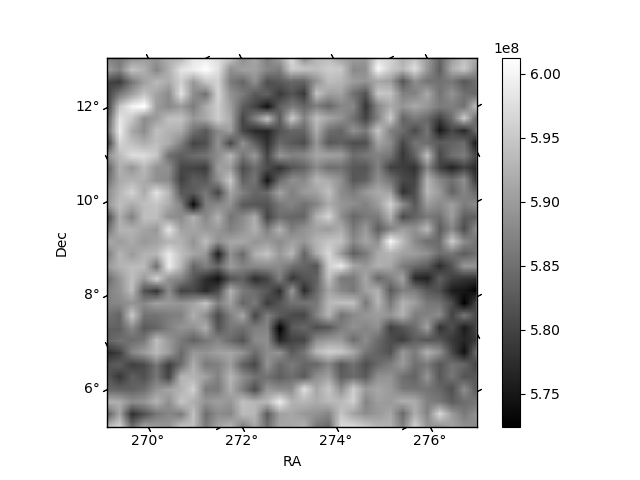
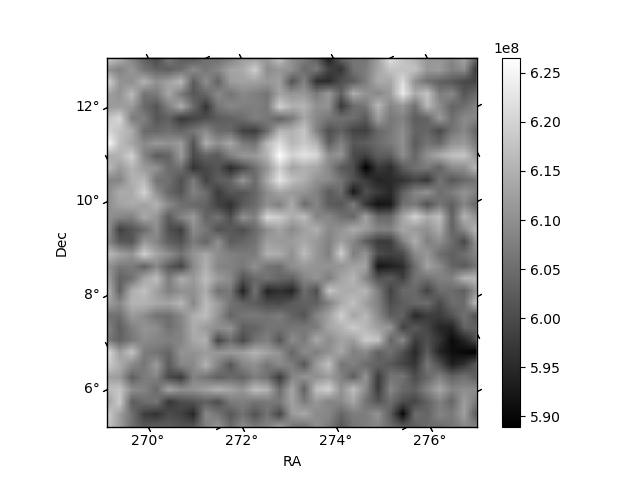
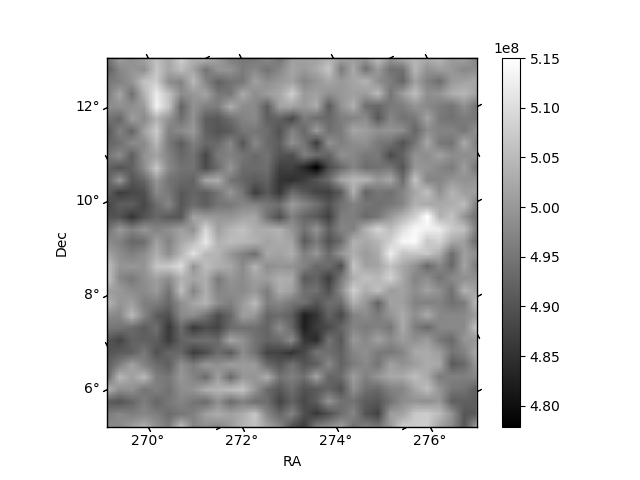
Histogram calculated using DETX and DETY for each event in the final _common_clean file
| Quadrant A | 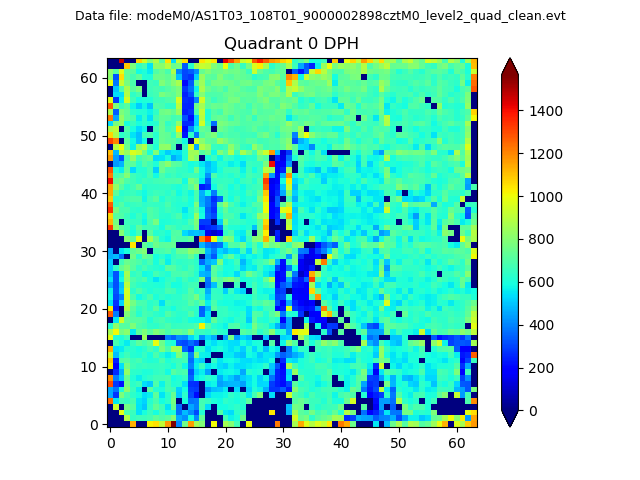 |
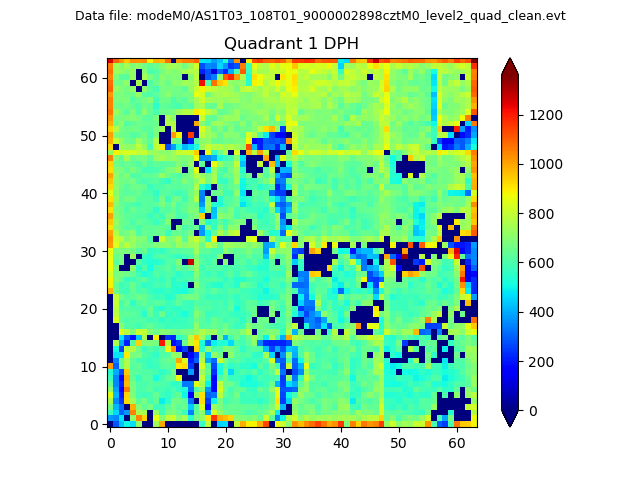 |
Quadrant B |
|---|---|---|---|
| Quadrant D | 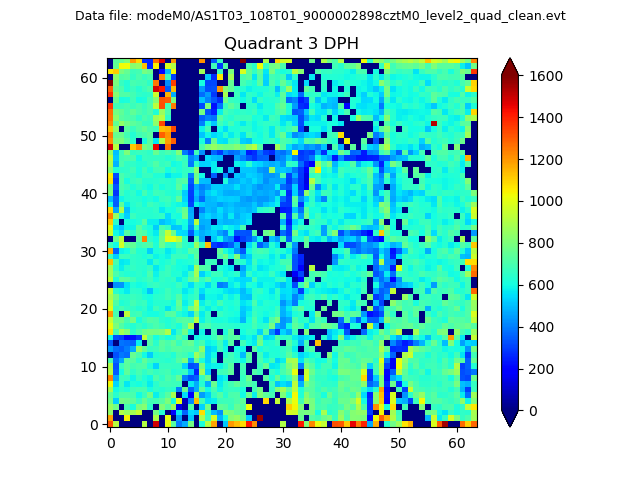 |
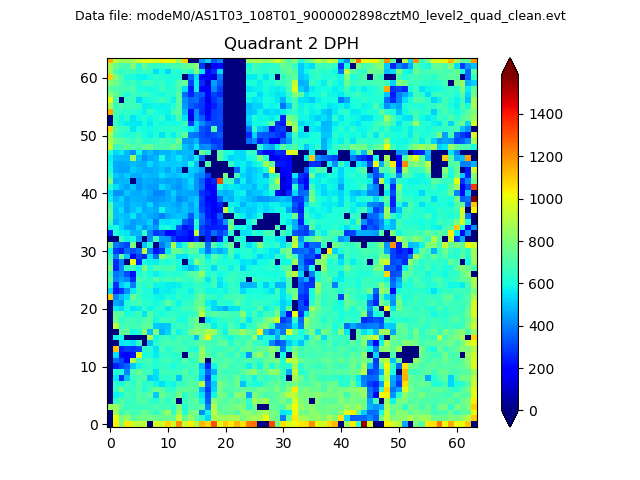 |
Quadrant C |
| Plot type | Count rate plots | Images |
|---|---|---|
| Comparison with Poisson distribution Blue bars denote a histogram of data divided into 1 sec bins. Red curve is a Poisson curve with rate = median count rate of data. |
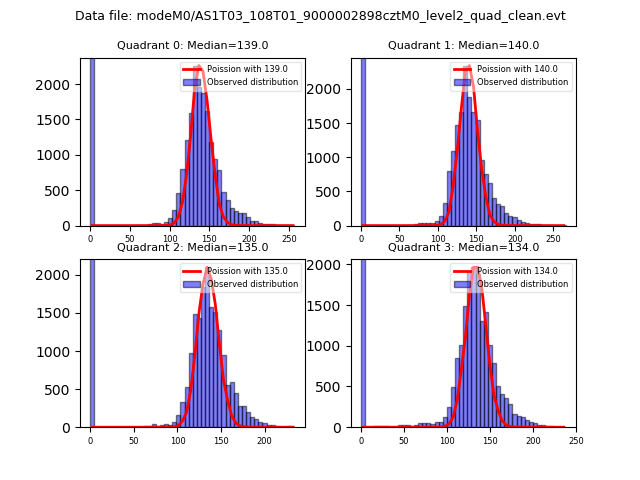 |
 |
| Quadrant-wise count rates Data is divided into 100 sec bins |
 |
|
| Module-wise count rates for Quadrant A Data is divided into 100 sec bins |
 |
 |
| Module-wise count rates for Quadrant B Data is divided into 100 sec bins |
 |
 |
| Module-wise count rates for Quadrant C Data is divided into 100 sec bins |
 |
 |
| Module-wise count rates for Quadrant D Data is divided into 100 sec bins |
 |
 |
| Parameter | Plot |
|---|---|
| CZT HV Monitor |  |
| D_VDD | 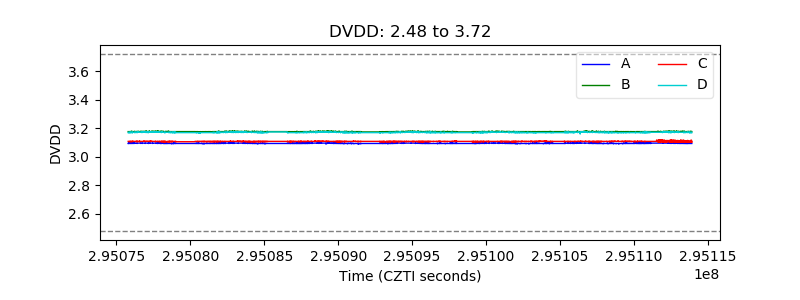 |
| Temperature 1 | 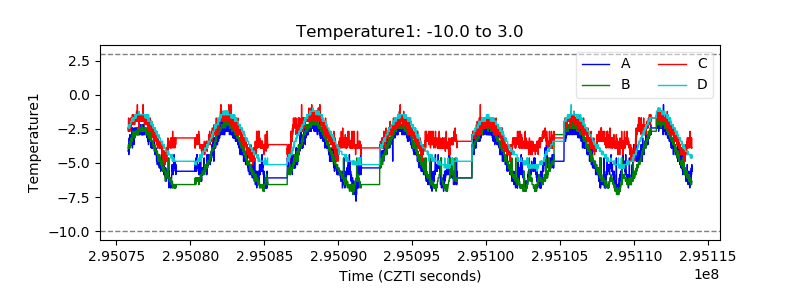 |
| Veto HV Monitor |  |
| Veto LLD | 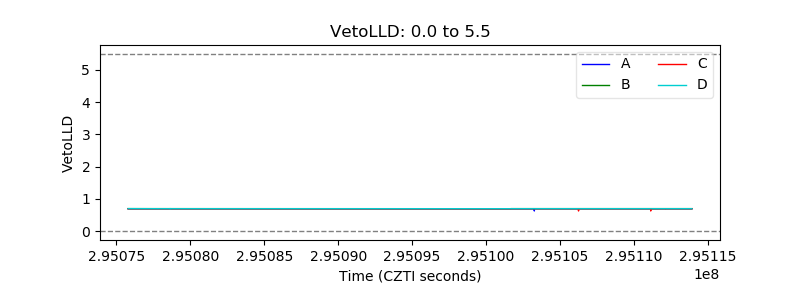 |
| Alpha Counter | 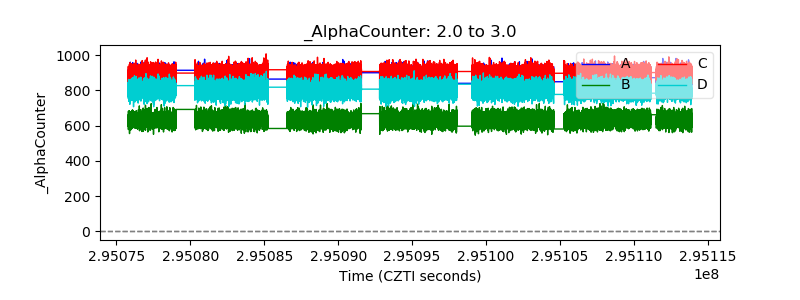 |
| _CPM_Rate | 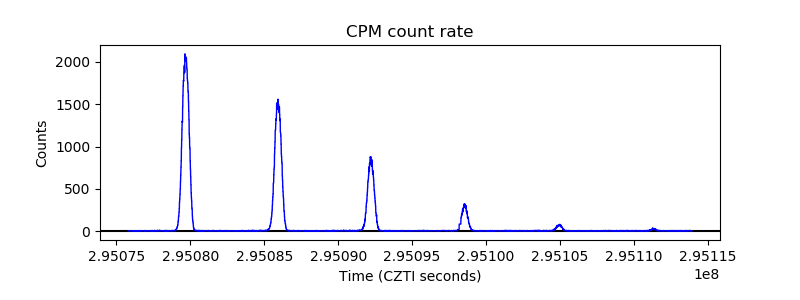 |
| CZT Counter | 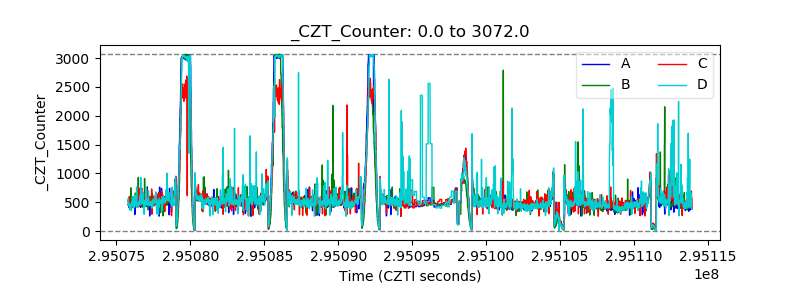 |
| +2.5 Volts monitor | 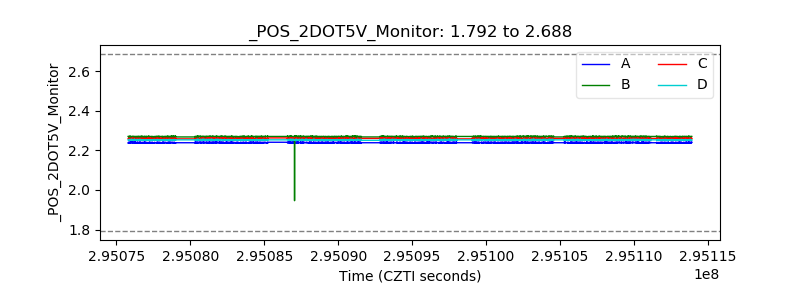 |
| +5 Volts monitor |  |
| _ROLL_ROT |  |
| _Roll_DEC | 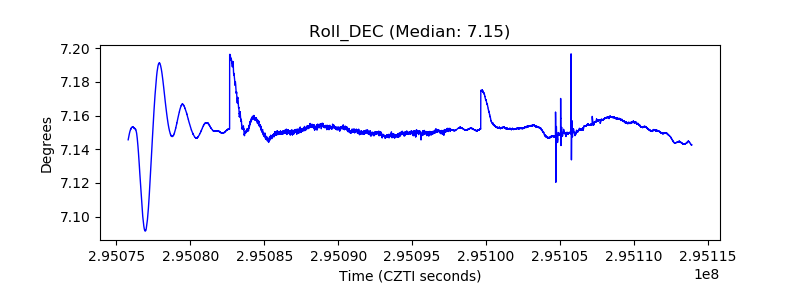 |
| _Roll_RA | 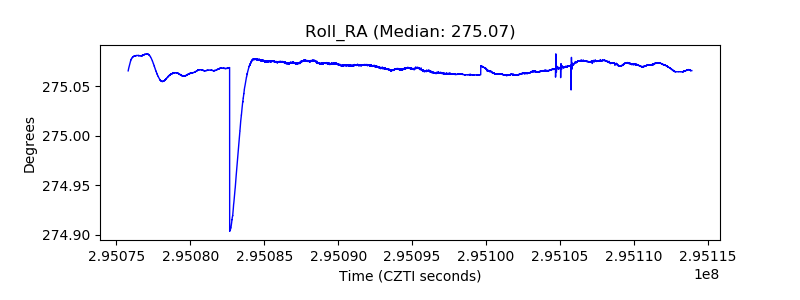 |
| Veto Counter | 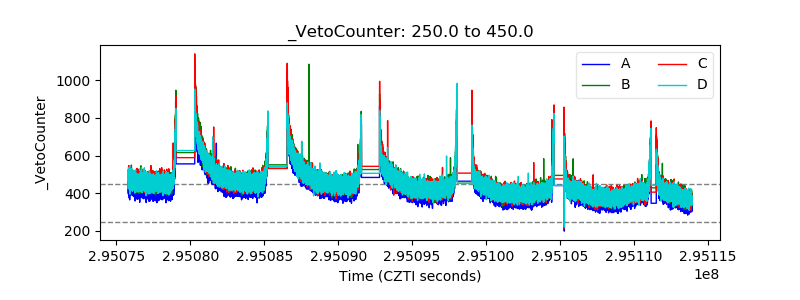 |