| Param | Original file | Final file |
|---|---|---|
| Filename | modeM0/AS1T03_108T01_9000002898_19526cztM0_level2.evt | modeM0/AS1T03_108T01_9000002898_19526cztM0_level2_quad_clean.evt |
| Size (bytes) | 444,196,800 | 73,157,760 |
| Size | 423.6 MB | 69.8 MB |
| Events in quadrant A | 3,146,504 | 457,872 |
| Events in quadrant B | 3,267,444 | 463,135 |
| Events in quadrant C | 3,178,372 | 442,382 |
| Events in quadrant D | 3,455,918 | 435,976 |
| Mode M0 | |||
|---|---|---|---|
| Quadrant | BADHDUFLAG | Total packets | Discarded packets |
| A | 0 | 12555 | 1 |
| B | 0 | 12991 | 1 |
| C | 0 | 12721 | 1 |
| D | 0 | 13745 | 1 |
| Mode SS | |||
|---|---|---|---|
| Quadrant | BADHDUFLAG | Total packets | Discarded packets |
| A | 0 | 120 | 0 |
| B | 0 | 120 | 0 |
| C | 0 | 120 | 0 |
| D | 0 | 120 | 0 |
| Mode M9 | |||
|---|---|---|---|
| Quadrant | BADHDUFLAG | Total packets | Discarded packets |
| A | 0 | 13 | 0 |
| B | 0 | 13 | 0 |
| C | 0 | 13 | 0 |
| D | 0 | 13 | 0 |
| Quadrant | Total seconds | Saturated seconds | Saturation percentage |
|---|---|---|---|
| A | 5956 | 60 | 1.007388% |
| B | 5957 | 88 | 1.477254% |
| C | 5957 | 80 | 1.342958% |
| D | 5956 | 105 | 1.762928% |
Noise dominated data is calculated using 1-second bins in cleaned event files. If a bin has >2000 counts, and if more than 50% of those come from <1% of pixels, then it is considered to be noise-dominated and hence unusable.
| Quadrant | # 1 sec bins | Bins with >0 counts | Bins with >2000 counts | High rate bins dominated by noise | Noise dominated (total time) | Noise dominated (detector-on time) | Marked lightcurve |
|---|---|---|---|---|---|---|---|
| A | 7256 | 5957 | 1 | 1 | 0.01% | 0.02% | 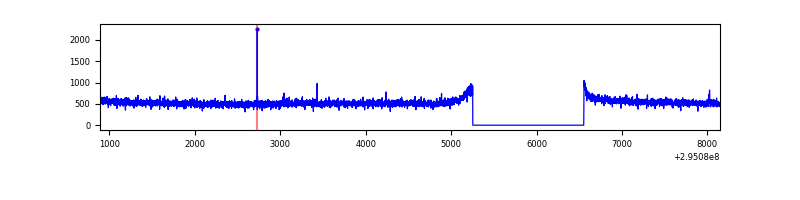 |
| B | 7257 | 5957 | 11 | 11 | 0.15% | 0.18% | 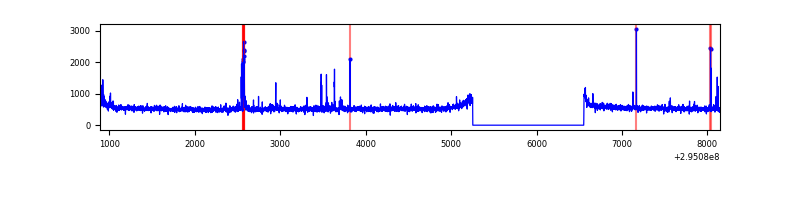 |
| C | 7257 | 5958 | 2 | 2 | 0.03% | 0.03% | 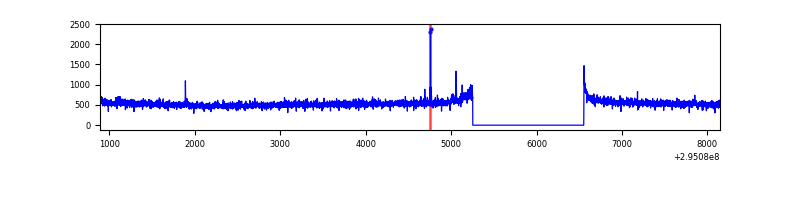 |
| D | 7256 | 5957 | 55 | 55 | 0.76% | 0.92% | 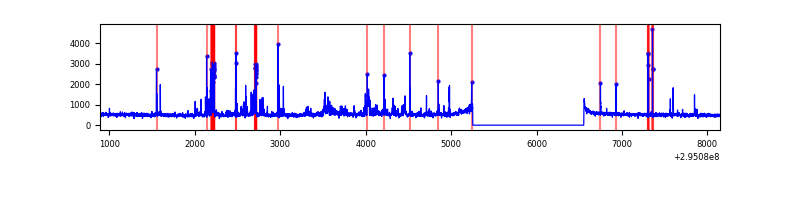 |
Top three noisy pixels from each quadrant. If the there are fewer than three noisy pixels in the level2.evt file, extra rows are filled as -1
| Pixel properties | Quadrant properties | ||||||
|---|---|---|---|---|---|---|---|
| Quadrant | DetID | PixID | Counts | Sigma | Mean | Median | Sigma |
| A | 13 | 254 | 8228 | 45.67 | 815 | 801 | 162.6 |
| A | 0 | 226 | 7221 | 39.48 | 815 | 801 | 162.6 |
| A | 3 | 137 | 6132 | 32.78 | 815 | 801 | 162.6 |
| B | 0 | 244 | 51281 | 332.98 | 800 | 783 | 151.7 |
| B | 0 | 230 | 30463 | 195.71 | 800 | 783 | 151.7 |
| B | 7 | 220 | 22617 | 143.97 | 800 | 783 | 151.7 |
| C | 14 | 238 | 122233 | 686.51 | 765 | 772 | 176.9 |
| C | 3 | 233 | 44265 | 245.83 | 765 | 772 | 176.9 |
| C | 9 | 221 | 20617 | 112.17 | 765 | 772 | 176.9 |
| D | 12 | 233 | 158805 | 821.1 | 787 | 766 | 192.5 |
| D | 1 | 52 | 96627 | 498.05 | 787 | 766 | 192.5 |
| D | 13 | 104 | 76445 | 393.19 | 787 | 766 | 192.5 |
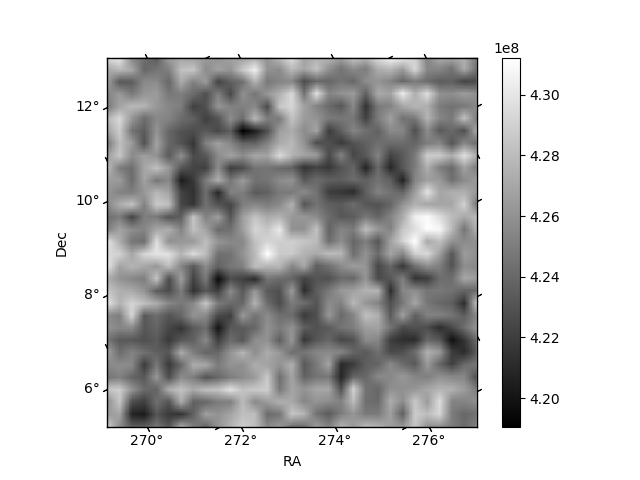
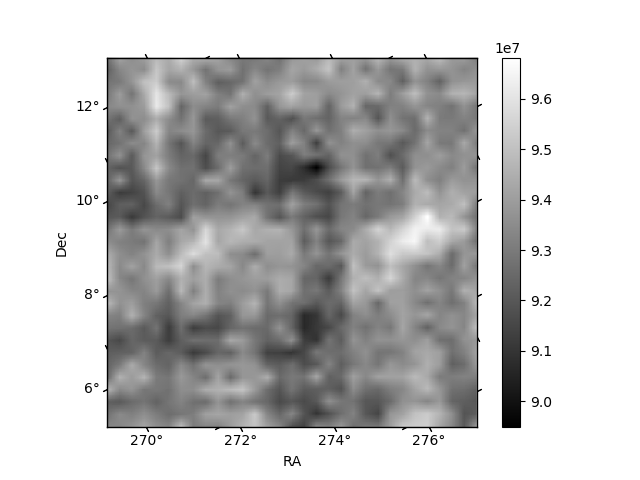
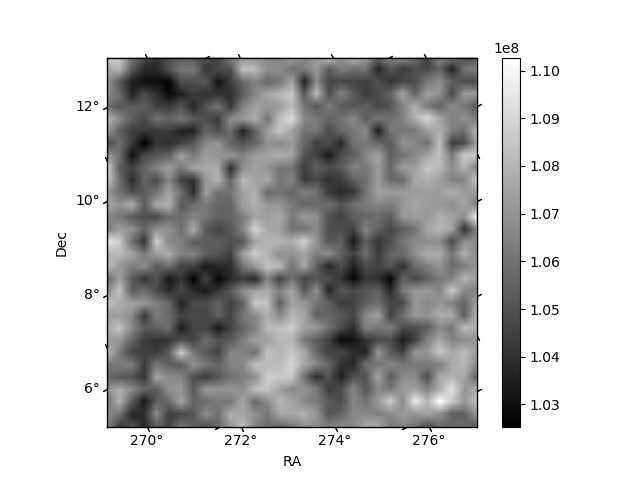
Histogram calculated using DETX and DETY for each event in the final _common_clean file
| Quadrant A | 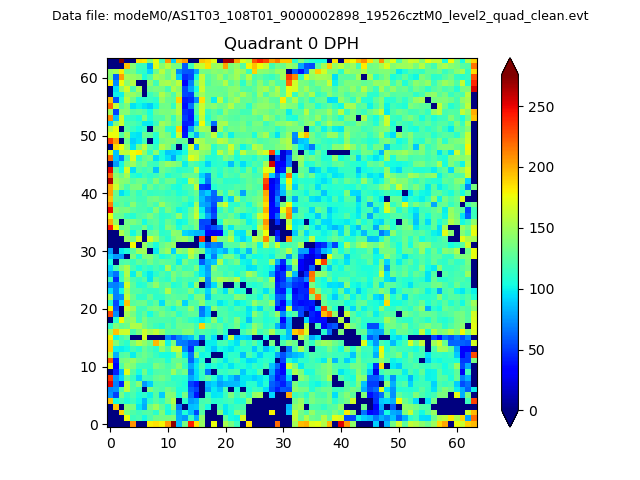 |
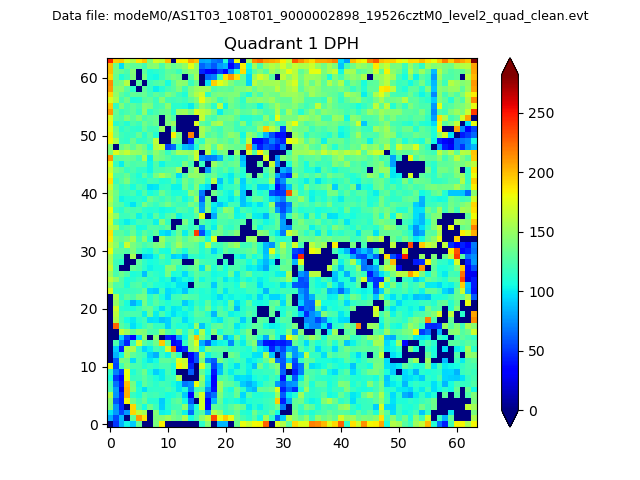 |
Quadrant B |
|---|---|---|---|
| Quadrant D | 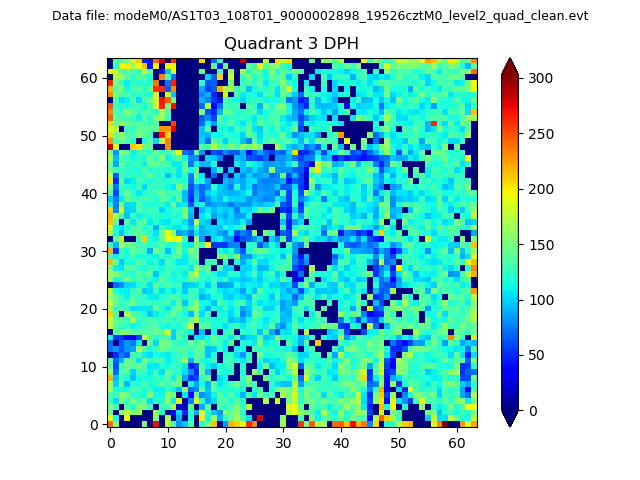 |
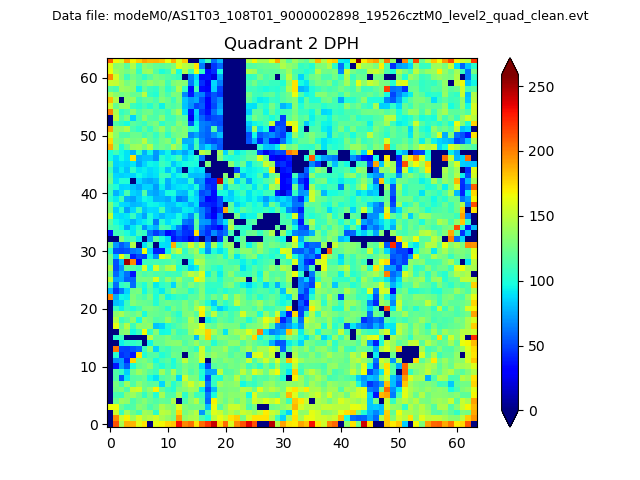 |
Quadrant C |
| Plot type | Count rate plots | Images |
|---|---|---|
| Comparison with Poisson distribution Blue bars denote a histogram of data divided into 1 sec bins. Red curve is a Poisson curve with rate = median count rate of data. |
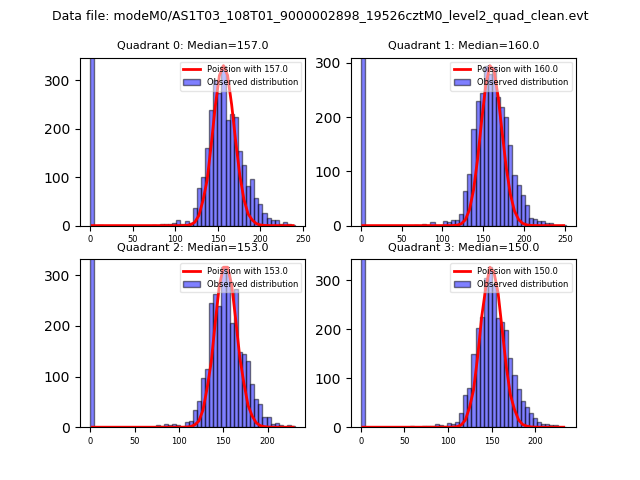 |
 |
| Quadrant-wise count rates Data is divided into 100 sec bins |
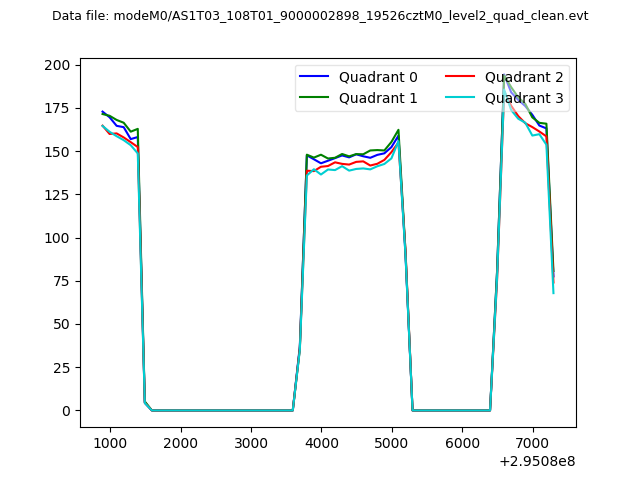 |
|
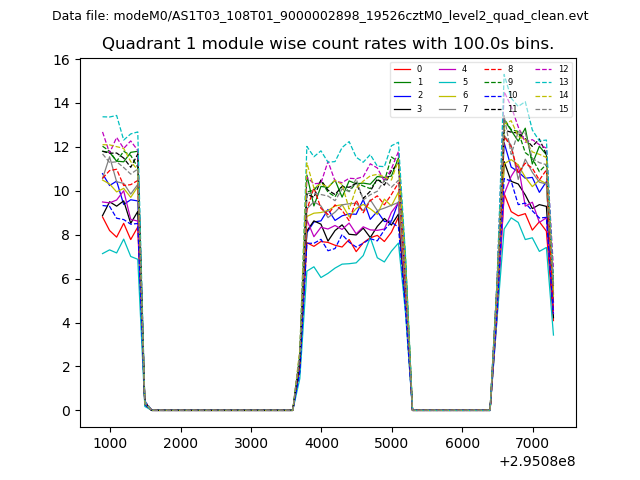
| Module-wise count rates for Quadrant A Data is divided into 100 sec bins |
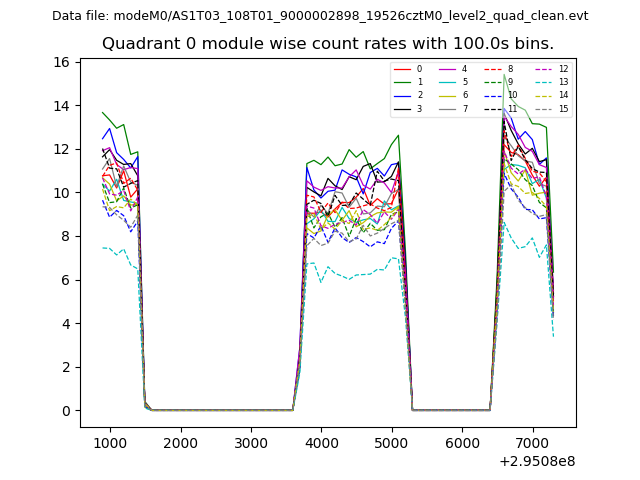 |
 |
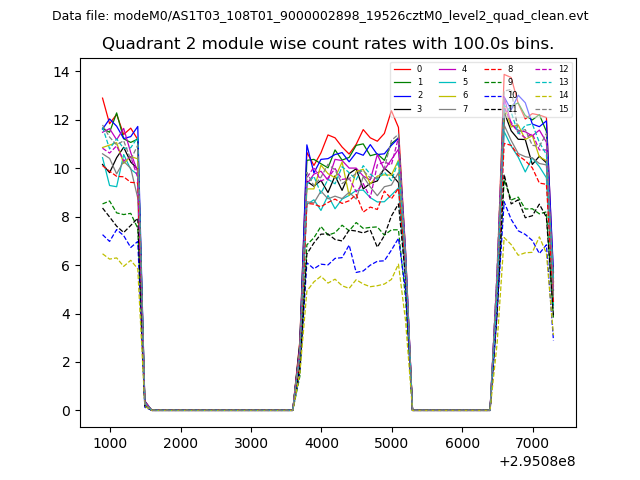
| Module-wise count rates for Quadrant B Data is divided into 100 sec bins |
 |
 |
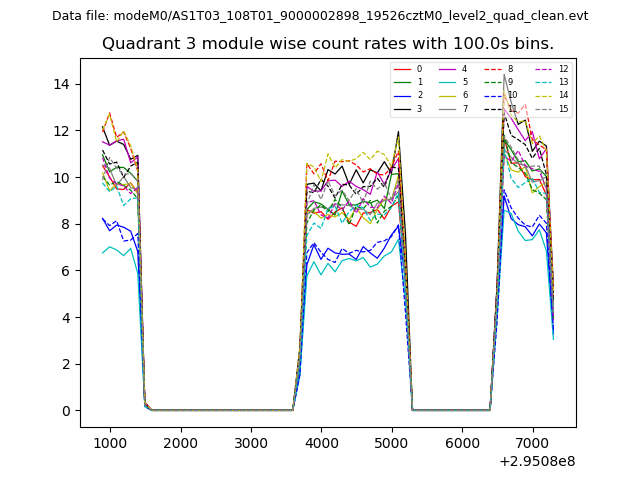
| Module-wise count rates for Quadrant C Data is divided into 100 sec bins |
 |
 |
| Module-wise count rates for Quadrant D Data is divided into 100 sec bins |
 |
 |
| Parameter | Plot |
|---|---|
| CZT HV Monitor | 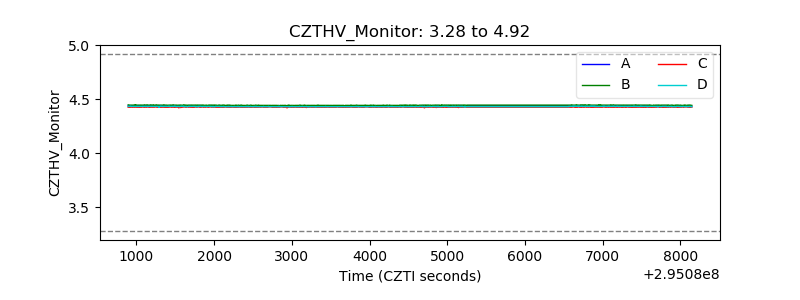 |
| D_VDD | 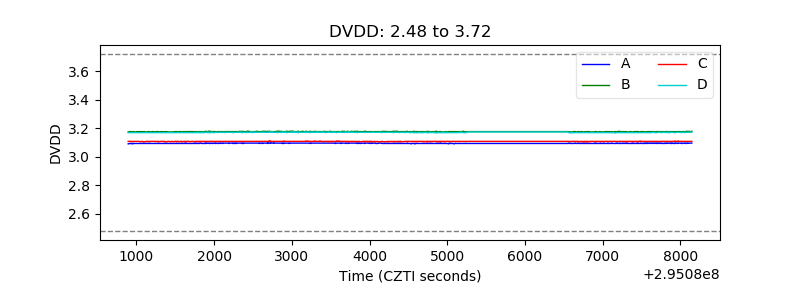 |
| Temperature 1 | 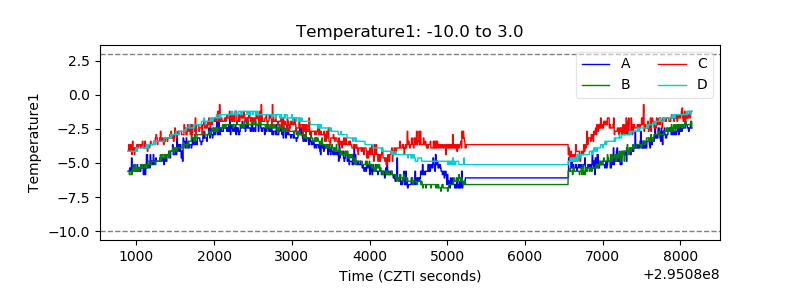 |
| Veto HV Monitor | 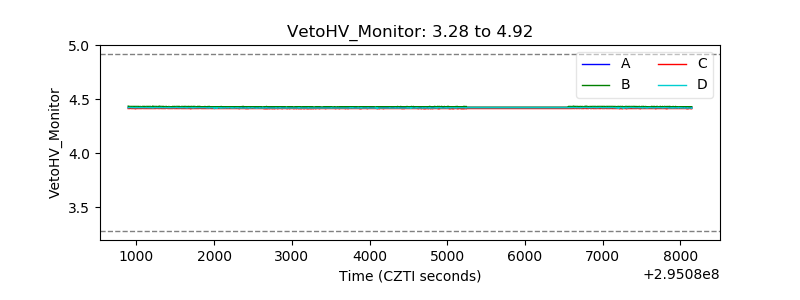 |
| Veto LLD |  |
| Alpha Counter | 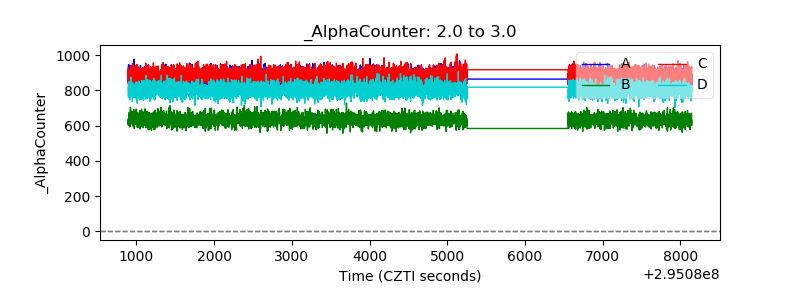 |
| _CPM_Rate |  |
| CZT Counter | 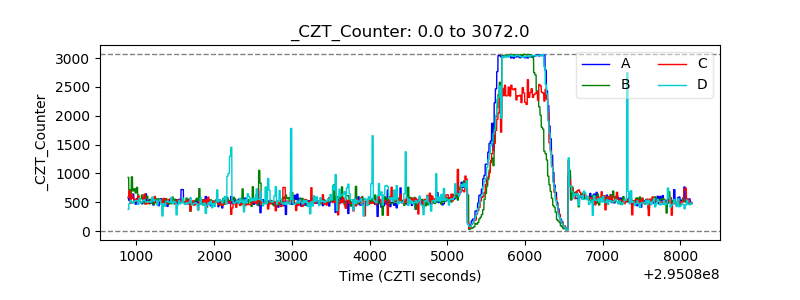 |
| +2.5 Volts monitor |  |
| +5 Volts monitor |  |
| _ROLL_ROT | 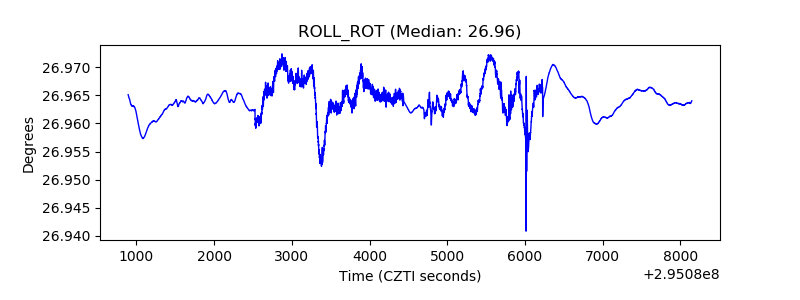 |
| _Roll_DEC | 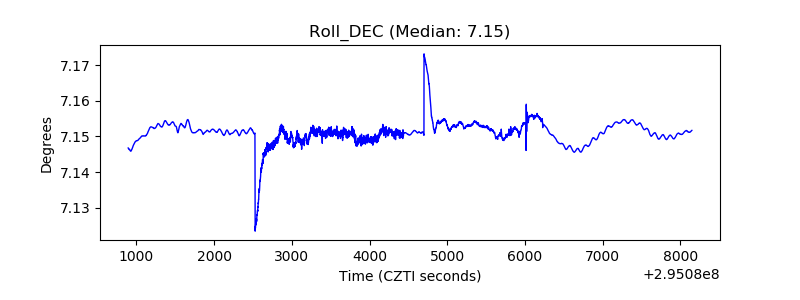 |
| _Roll_RA | 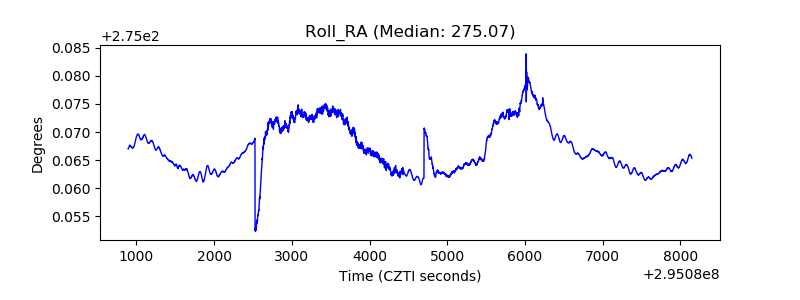 |
| Veto Counter | 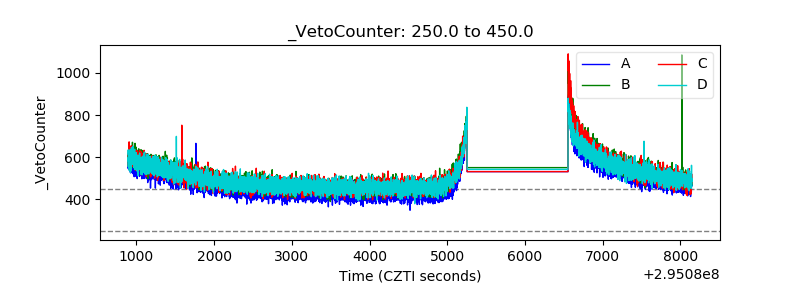 |