| Param | Original file | Final file |
|---|---|---|
| Filename | modeM0/AS1T03_108T01_9000002898_19527cztM0_level2.evt | modeM0/AS1T03_108T01_9000002898_19527cztM0_level2_quad_clean.evt |
| Size (bytes) | 458,035,200 | 67,893,120 |
| Size | 436.8 MB | 64.7 MB |
| Events in quadrant A | 3,241,548 | 411,187 |
| Events in quadrant B | 3,408,060 | 414,231 |
| Events in quadrant C | 3,299,423 | 400,007 |
| Events in quadrant D | 3,499,153 | 395,035 |
| Mode M0 | |||
|---|---|---|---|
| Quadrant | BADHDUFLAG | Total packets | Discarded packets |
| A | 0 | 13043 | 1 |
| B | 0 | 13550 | 1 |
| C | 0 | 13130 | 1 |
| D | 0 | 13951 | 1 |
| Mode SS | |||
|---|---|---|---|
| Quadrant | BADHDUFLAG | Total packets | Discarded packets |
| A | 0 | 126 | 0 |
| B | 0 | 126 | 0 |
| C | 0 | 126 | 0 |
| D | 0 | 126 | 0 |
| Mode M9 | |||
|---|---|---|---|
| Quadrant | BADHDUFLAG | Total packets | Discarded packets |
| A | 0 | 13 | 0 |
| B | 0 | 13 | 0 |
| C | 0 | 13 | 0 |
| D | 0 | 13 | 0 |
| Quadrant | Total seconds | Saturated seconds | Saturation percentage |
|---|---|---|---|
| A | 6237 | 86 | 1.378868% |
| B | 6237 | 126 | 2.020202% |
| C | 6237 | 108 | 1.731602% |
| D | 6237 | 130 | 2.084335% |
Noise dominated data is calculated using 1-second bins in cleaned event files. If a bin has >2000 counts, and if more than 50% of those come from <1% of pixels, then it is considered to be noise-dominated and hence unusable.
| Quadrant | # 1 sec bins | Bins with >0 counts | Bins with >2000 counts | High rate bins dominated by noise | Noise dominated (total time) | Noise dominated (detector-on time) | Marked lightcurve |
|---|---|---|---|---|---|---|---|
| A | 7467 | 6237 | 0 | 0 | 0.00% | 0.00% | 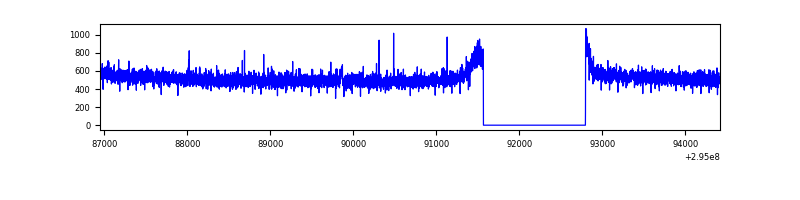 |
| B | 7467 | 6237 | 16 | 16 | 0.21% | 0.26% | 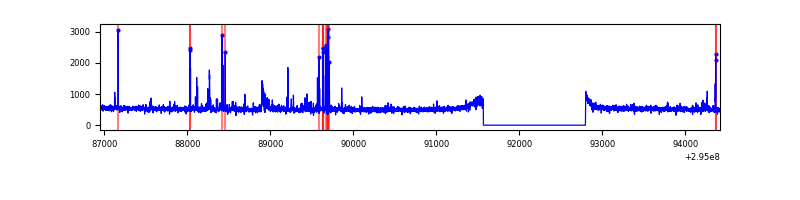 |
| C | 7467 | 6238 | 1 | 1 | 0.01% | 0.02% | 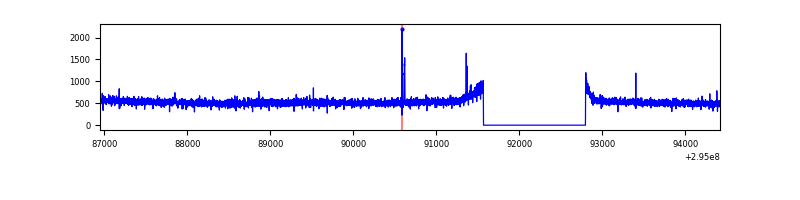 |
| D | 7467 | 6237 | 50 | 50 | 0.67% | 0.80% | 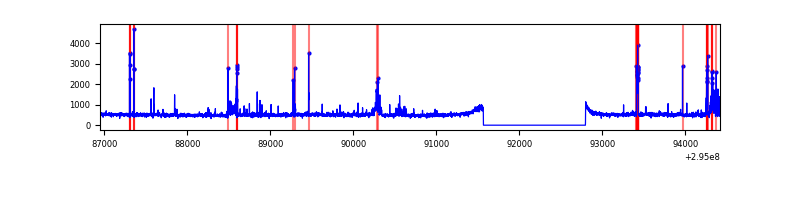 |
Top three noisy pixels from each quadrant. If the there are fewer than three noisy pixels in the level2.evt file, extra rows are filled as -1
| Pixel properties | Quadrant properties | ||||||
|---|---|---|---|---|---|---|---|
| Quadrant | DetID | PixID | Counts | Sigma | Mean | Median | Sigma |
| A | 13 | 254 | 7980 | 42.42 | 840 | 824 | 168.7 |
| A | 0 | 226 | 7271 | 38.22 | 840 | 824 | 168.7 |
| A | 3 | 137 | 6191 | 31.82 | 840 | 824 | 168.7 |
| B | 7 | 220 | 62389 | 393.03 | 823 | 804 | 156.7 |
| B | 0 | 244 | 47361 | 297.13 | 823 | 804 | 156.7 |
| B | 3 | 64 | 46196 | 289.69 | 823 | 804 | 156.7 |
| C | 14 | 238 | 124922 | 681.86 | 791 | 799 | 182.0 |
| C | 3 | 233 | 63420 | 344.01 | 791 | 799 | 182.0 |
| C | 9 | 221 | 14244 | 73.86 | 791 | 799 | 182.0 |
| D | 1 | 52 | 106726 | 536.73 | 812 | 789 | 197.4 |
| D | 12 | 233 | 102582 | 515.73 | 812 | 789 | 197.4 |
| D | 13 | 104 | 85761 | 430.51 | 812 | 789 | 197.4 |
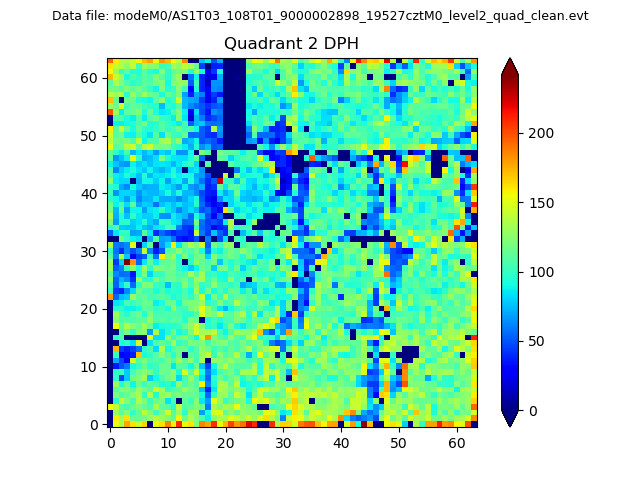
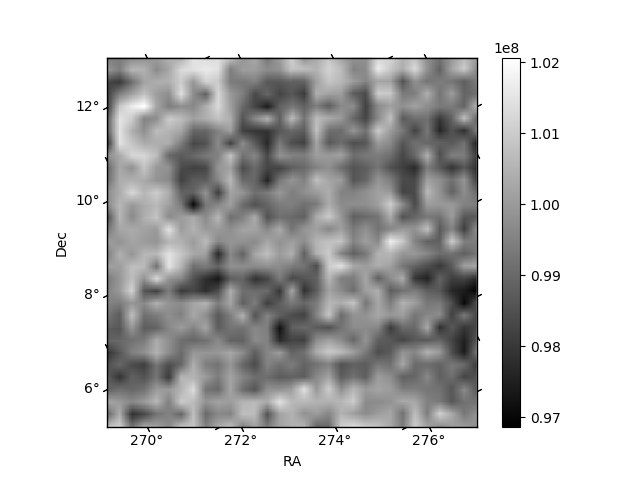
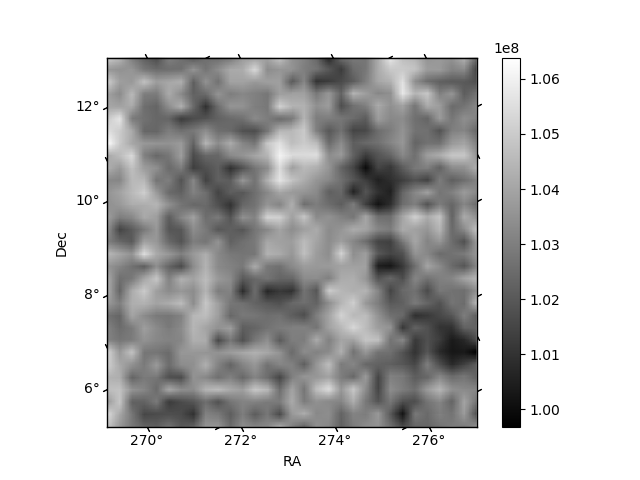
Histogram calculated using DETX and DETY for each event in the final _common_clean file
| Quadrant A | 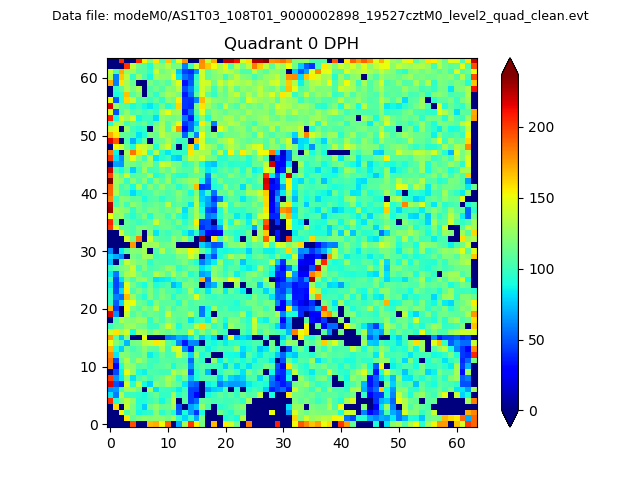 |
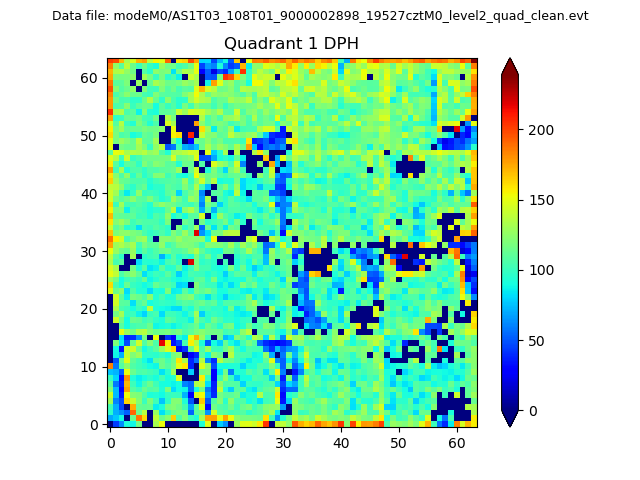 |
Quadrant B |
|---|---|---|---|
| Quadrant D | 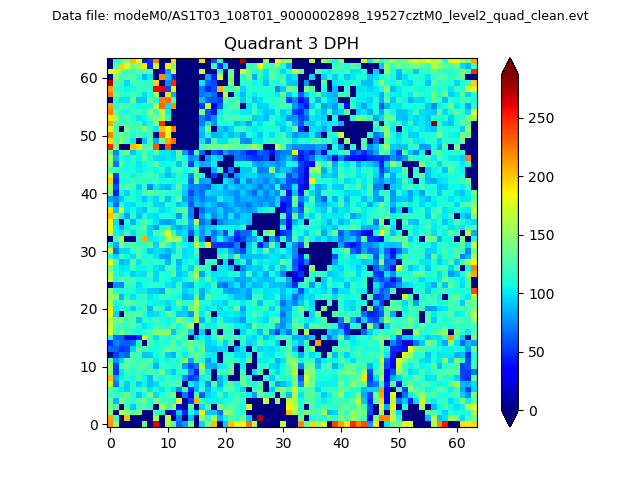 |
 |
Quadrant C |
| Plot type | Count rate plots | Images |
|---|---|---|
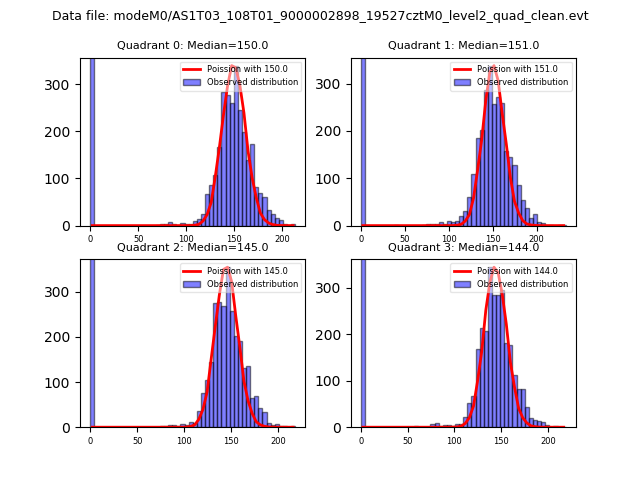
| Comparison with Poisson distribution Blue bars denote a histogram of data divided into 1 sec bins. Red curve is a Poisson curve with rate = median count rate of data. |
 |
 |
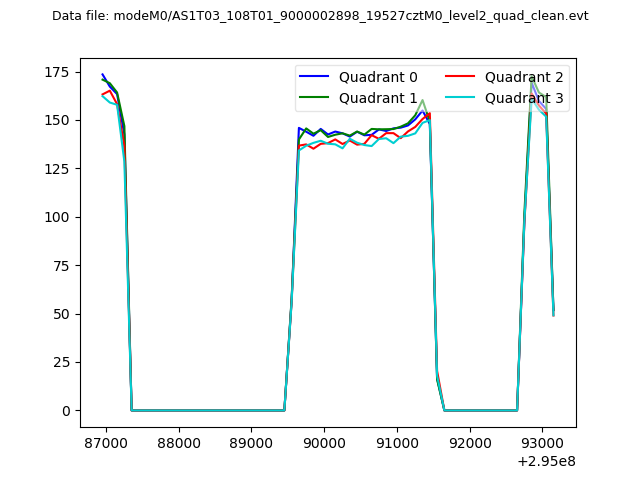
| Quadrant-wise count rates Data is divided into 100 sec bins |
 |
|
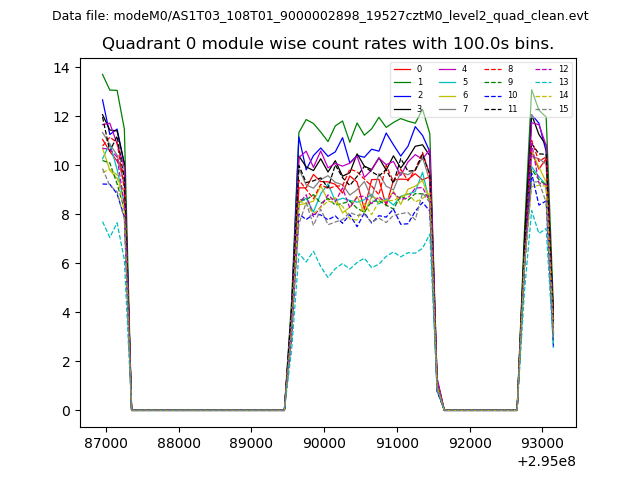
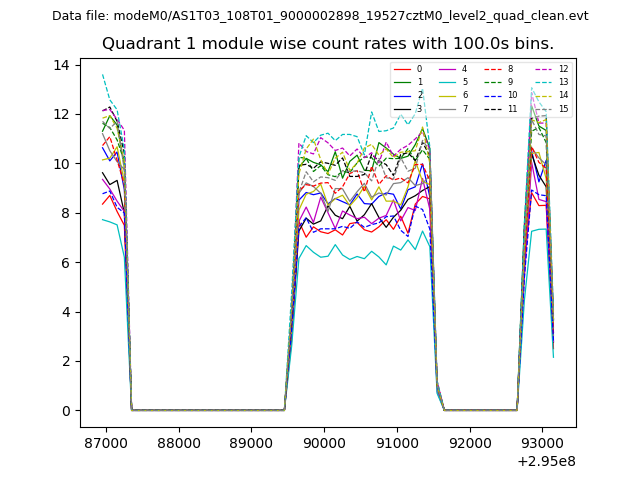
| Module-wise count rates for Quadrant A Data is divided into 100 sec bins |
 |
 |
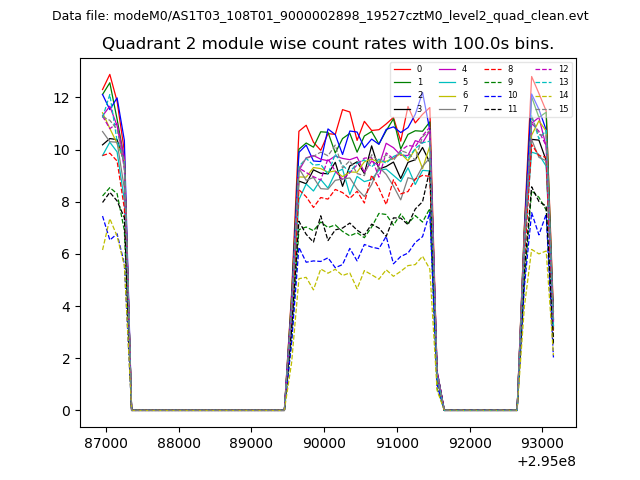
| Module-wise count rates for Quadrant B Data is divided into 100 sec bins |
 |
 |
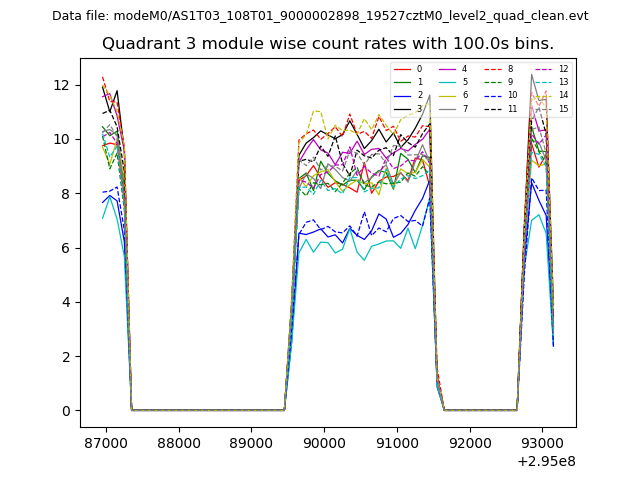
| Module-wise count rates for Quadrant C Data is divided into 100 sec bins |
 |
 |
| Module-wise count rates for Quadrant D Data is divided into 100 sec bins |
 |
 |
| Parameter | Plot |
|---|---|
| CZT HV Monitor | 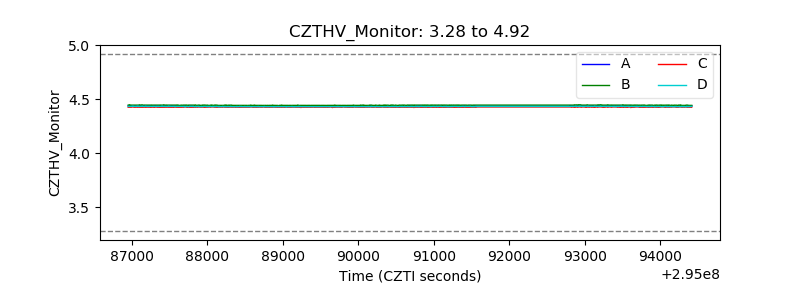 |
| D_VDD | 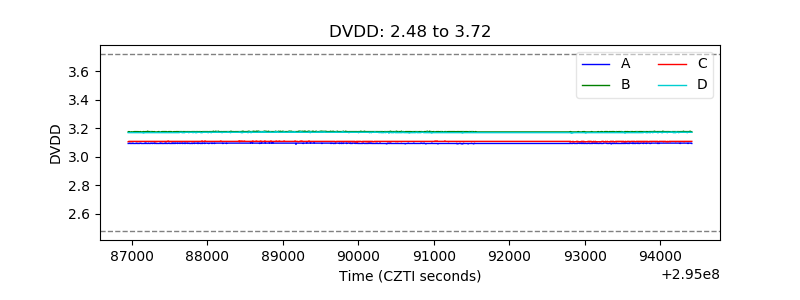 |
| Temperature 1 | 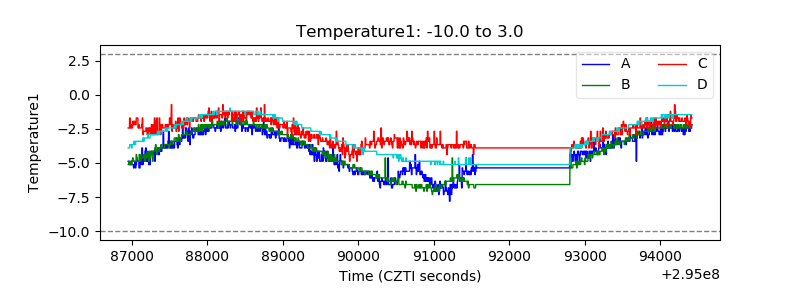 |
| Veto HV Monitor | 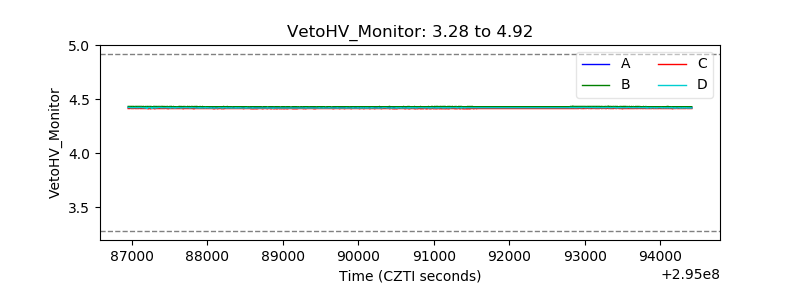 |
| Veto LLD | 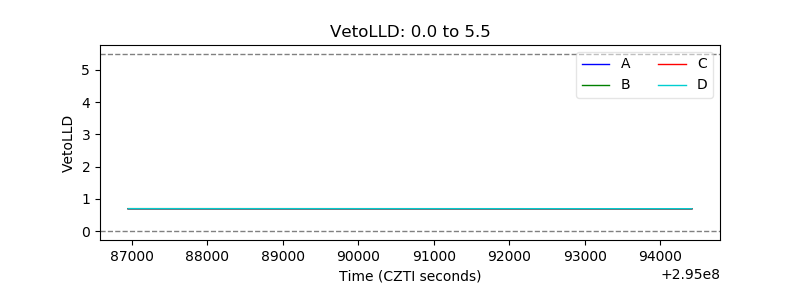 |
| Alpha Counter | 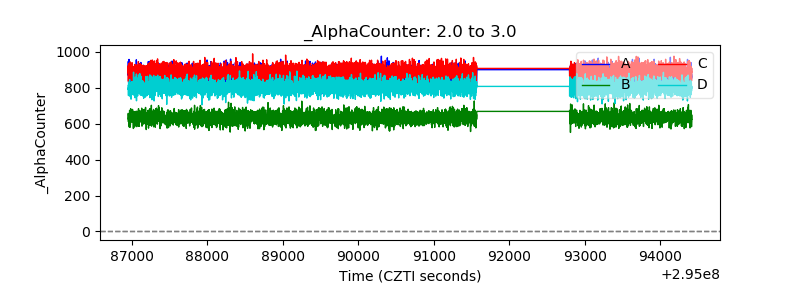 |
| _CPM_Rate | 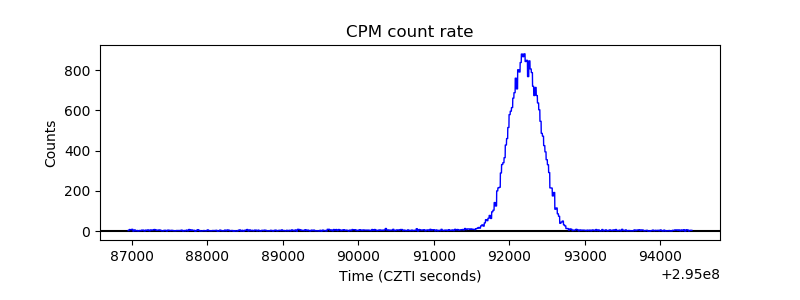 |
| CZT Counter | 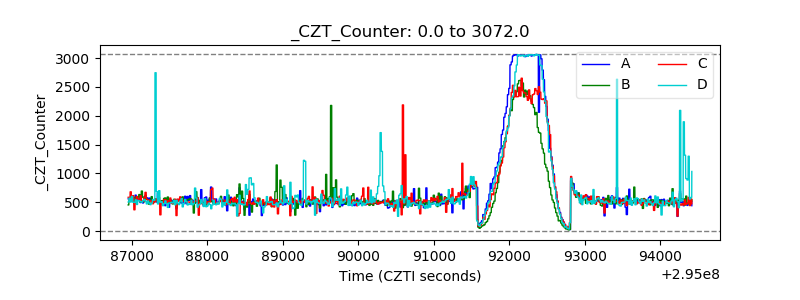 |
| +2.5 Volts monitor |  |
| +5 Volts monitor |  |
| _ROLL_ROT | 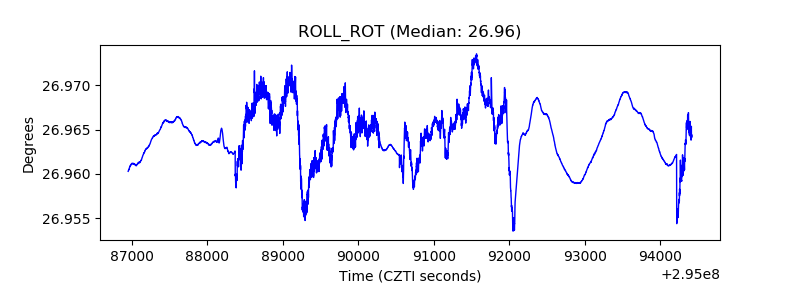 |
| _Roll_DEC | 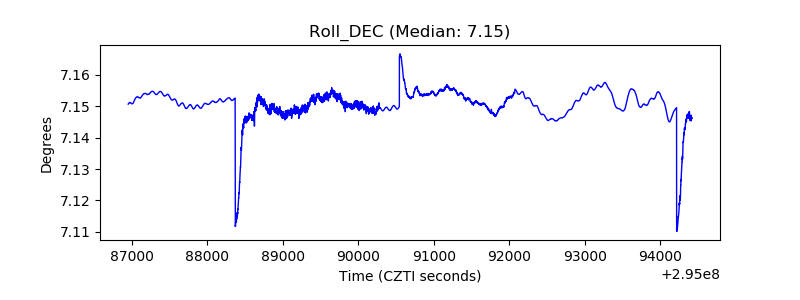 |
| _Roll_RA | 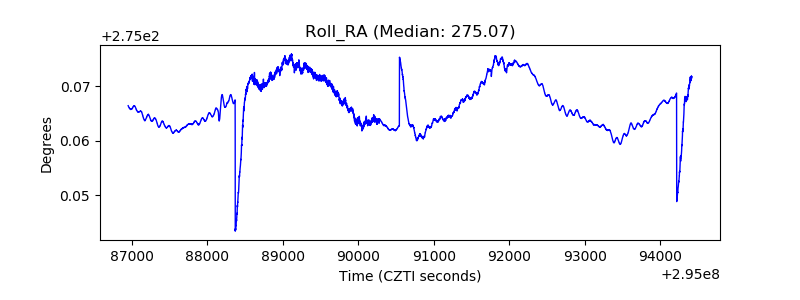 |
| Veto Counter | 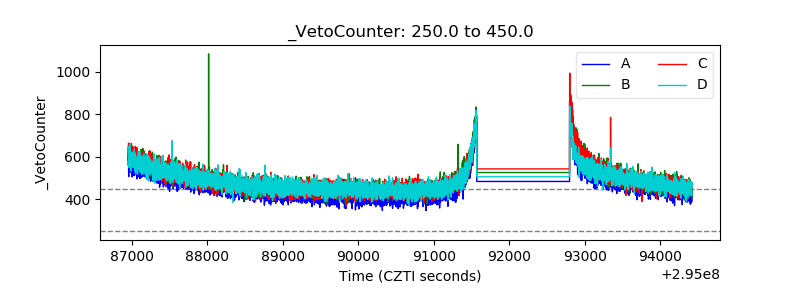 |