| Param | Original file | Final file |
|---|---|---|
| Filename | modeM0/AS1T03_108T01_9000002898_19528cztM0_level2.evt | modeM0/AS1T03_108T01_9000002898_19528cztM0_level2_quad_clean.evt |
| Size (bytes) | 518,454,720 | 69,894,720 |
| Size | 494.4 MB | 66.7 MB |
| Events in quadrant A | 3,482,190 | 421,409 |
| Events in quadrant B | 3,563,049 | 423,807 |
| Events in quadrant C | 3,548,557 | 407,796 |
| Events in quadrant D | 4,642,851 | 386,080 |
| Mode M0 | |||
|---|---|---|---|
| Quadrant | BADHDUFLAG | Total packets | Discarded packets |
| A | 0 | 14314 | 2 |
| B | 0 | 14466 | 2 |
| C | 0 | 14372 | 2 |
| D | 0 | 18029 | 2 |
| Mode SS | |||
|---|---|---|---|
| Quadrant | BADHDUFLAG | Total packets | Discarded packets |
| A | 0 | 138 | 0 |
| B | 0 | 138 | 0 |
| C | 0 | 138 | 0 |
| D | 0 | 138 | 0 |
| Mode M9 | |||
|---|---|---|---|
| Quadrant | BADHDUFLAG | Total packets | Discarded packets |
| A | 0 | 13 | 0 |
| B | 0 | 14 | 0 |
| C | 0 | 14 | 0 |
| D | 0 | 14 | 0 |
| Quadrant | Total seconds | Saturated seconds | Saturation percentage |
|---|---|---|---|
| A | 6848 | 115 | 1.679322% |
| B | 6848 | 142 | 2.073598% |
| C | 6848 | 138 | 2.015187% |
| D | 6848 | 449 | 6.556659% |
Noise dominated data is calculated using 1-second bins in cleaned event files. If a bin has >2000 counts, and if more than 50% of those come from <1% of pixels, then it is considered to be noise-dominated and hence unusable.
| Quadrant | # 1 sec bins | Bins with >0 counts | Bins with >2000 counts | High rate bins dominated by noise | Noise dominated (total time) | Noise dominated (detector-on time) | Marked lightcurve |
|---|---|---|---|---|---|---|---|
| A | 7848 | 6848 | 0 | 0 | 0.00% | 0.00% | 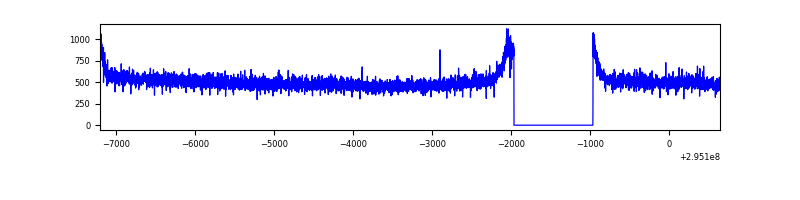 |
| B | 7848 | 6848 | 4 | 4 | 0.05% | 0.06% | 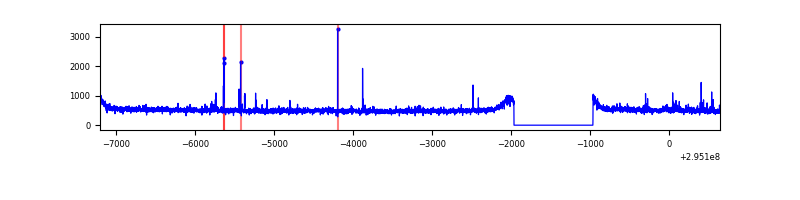 |
| C | 7848 | 6848 | 0 | 0 | 0.00% | 0.00% | 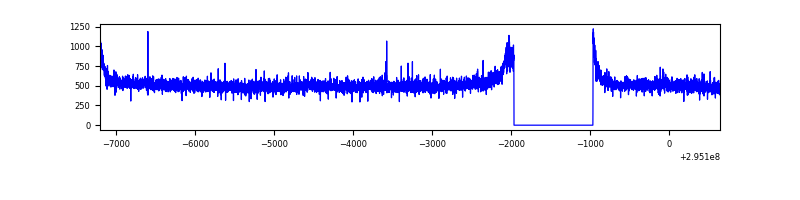 |
| D | 7848 | 6848 | 336 | 336 | 4.28% | 4.91% | 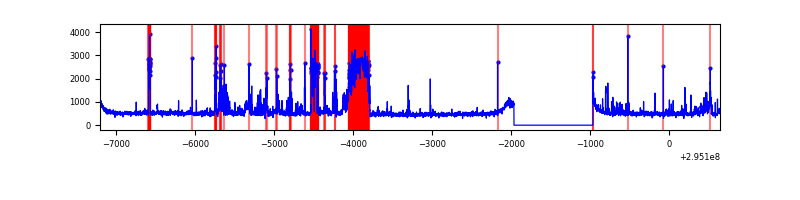 |
Top three noisy pixels from each quadrant. If the there are fewer than three noisy pixels in the level2.evt file, extra rows are filled as -1
| Pixel properties | Quadrant properties | ||||||
|---|---|---|---|---|---|---|---|
| Quadrant | DetID | PixID | Counts | Sigma | Mean | Median | Sigma |
| A | 13 | 254 | 8558 | 41.94 | 903 | 885 | 183.0 |
| A | 0 | 226 | 7869 | 38.17 | 903 | 885 | 183.0 |
| A | 3 | 137 | 7029 | 33.58 | 903 | 885 | 183.0 |
| B | 0 | 198 | 21511 | 120.28 | 890 | 867 | 171.6 |
| B | 12 | 111 | 20522 | 114.52 | 890 | 867 | 171.6 |
| B | 7 | 220 | 19930 | 111.07 | 890 | 867 | 171.6 |
| C | 14 | 238 | 133665 | 668.53 | 853 | 860 | 198.7 |
| C | 3 | 233 | 79036 | 393.53 | 853 | 860 | 198.7 |
| C | 7 | 247 | 7549 | 33.67 | 853 | 860 | 198.7 |
| D | 13 | 104 | 612671 | 2895.08 | 862 | 836 | 211.3 |
| D | 12 | 233 | 520951 | 2461.08 | 862 | 836 | 211.3 |
| D | 2 | 16 | 59714 | 278.6 | 862 | 836 | 211.3 |
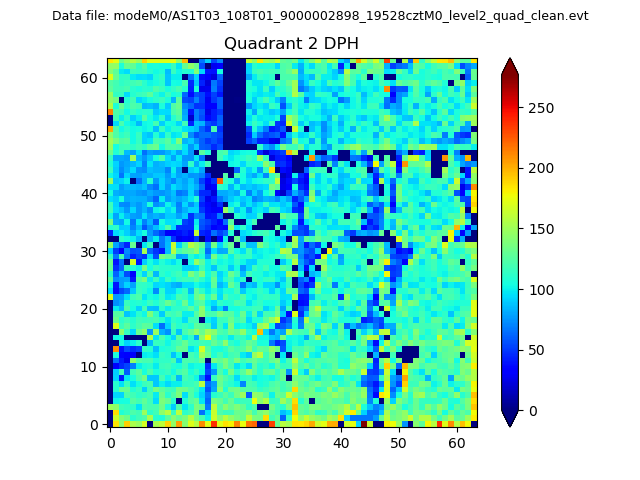
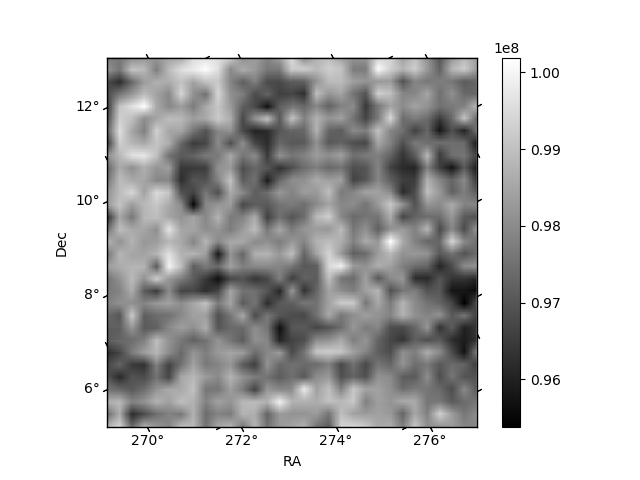
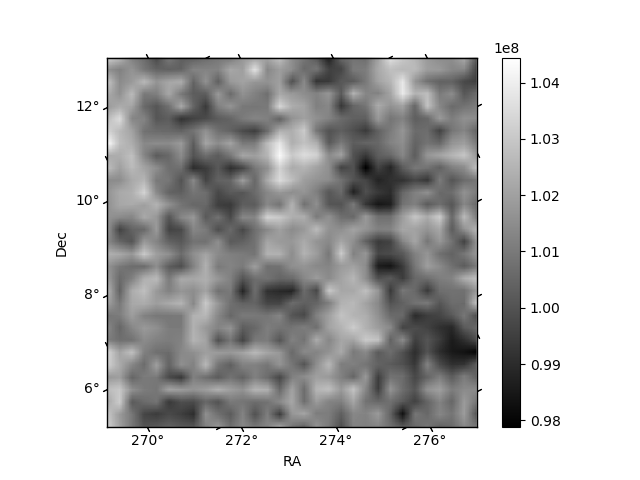
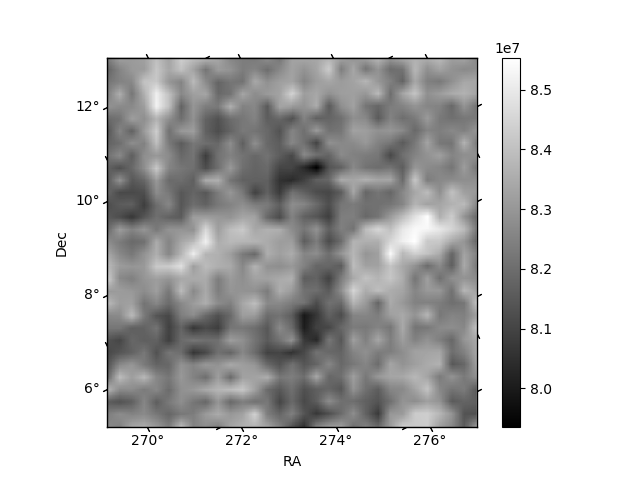
Histogram calculated using DETX and DETY for each event in the final _common_clean file
| Quadrant A | 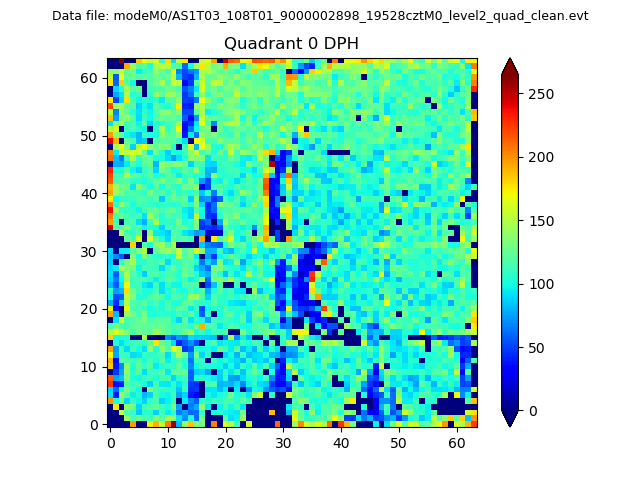 |
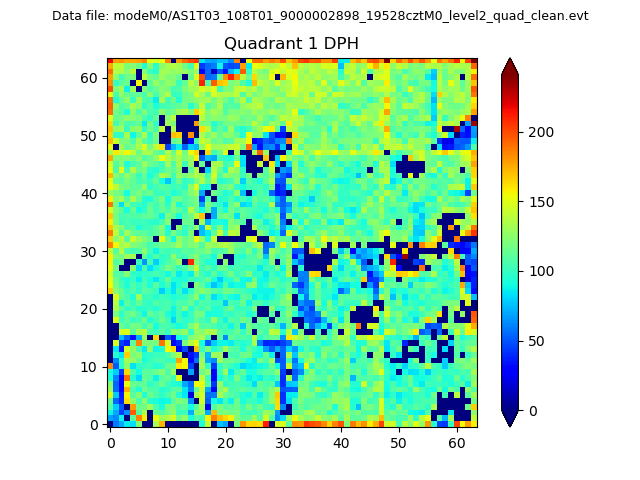 |
Quadrant B |
|---|---|---|---|
| Quadrant D | 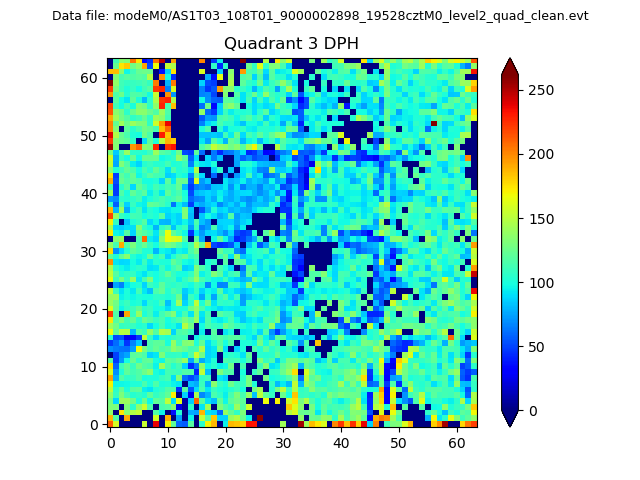 |
 |
Quadrant C |
| Plot type | Count rate plots | Images |
|---|---|---|
| Comparison with Poisson distribution Blue bars denote a histogram of data divided into 1 sec bins. Red curve is a Poisson curve with rate = median count rate of data. |
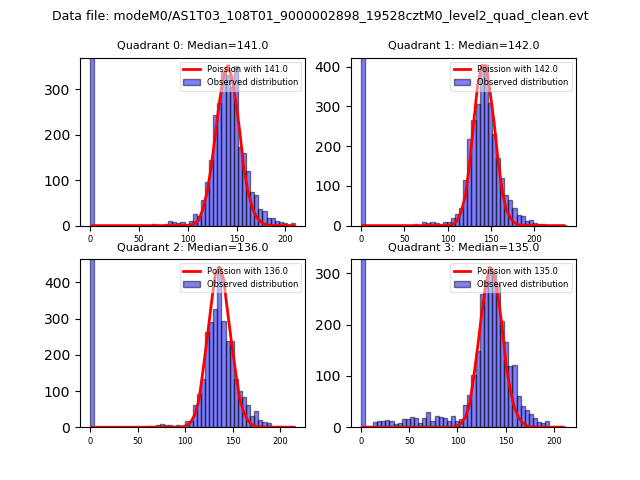 |
 |
| Quadrant-wise count rates Data is divided into 100 sec bins |
 |
|
| Module-wise count rates for Quadrant A Data is divided into 100 sec bins |
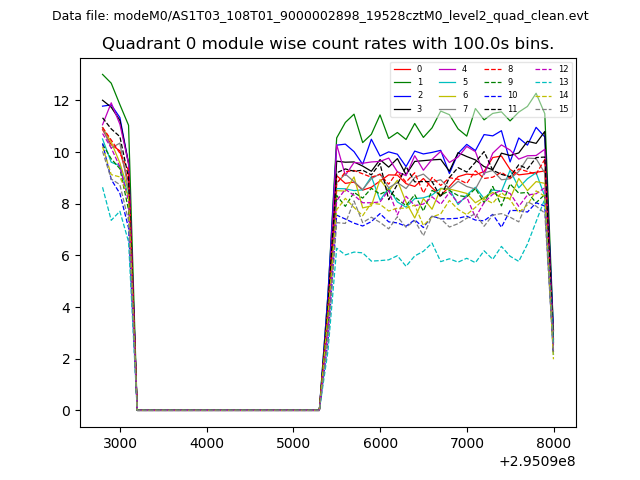 |
 |
| Module-wise count rates for Quadrant B Data is divided into 100 sec bins |
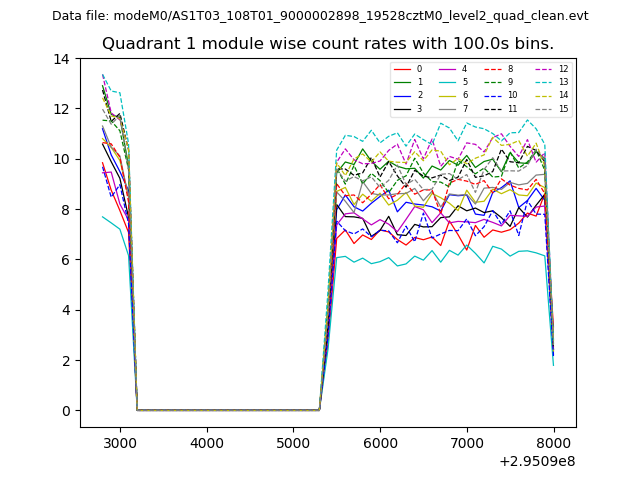 |
 |
| Module-wise count rates for Quadrant C Data is divided into 100 sec bins |
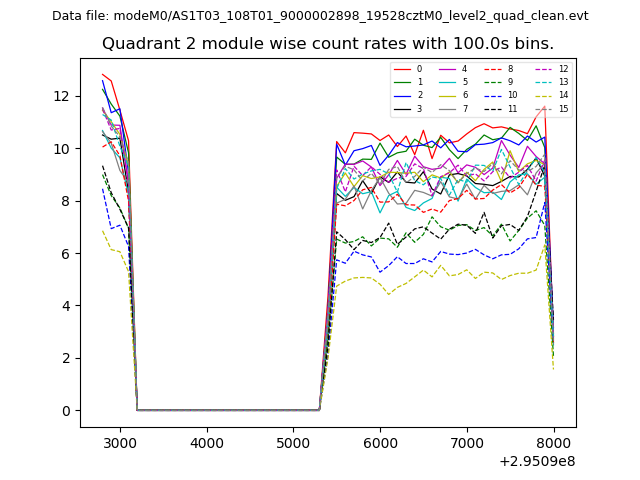 |
 |
| Module-wise count rates for Quadrant D Data is divided into 100 sec bins |
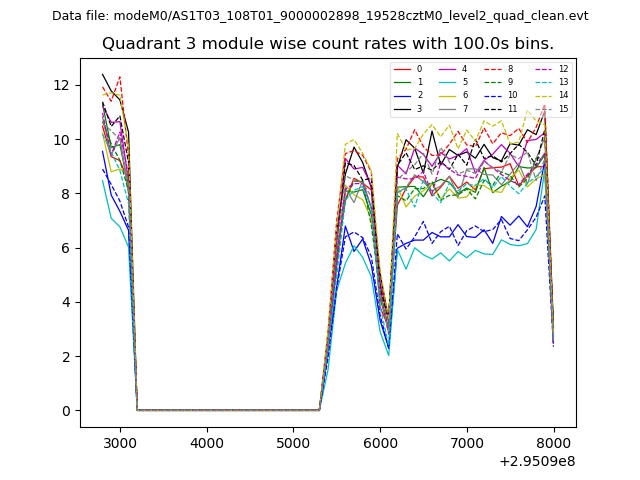 |
 |
| Parameter | Plot |
|---|---|
| CZT HV Monitor | 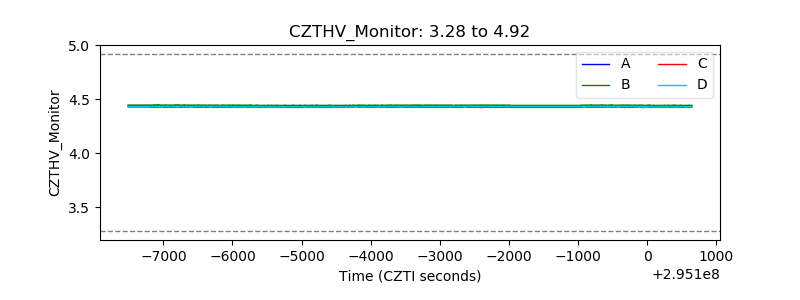 |
| D_VDD | 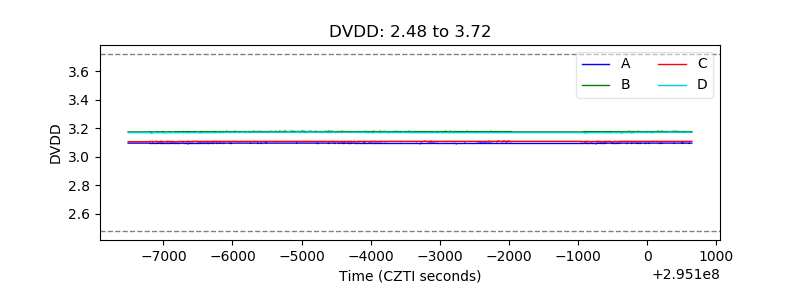 |
| Temperature 1 | 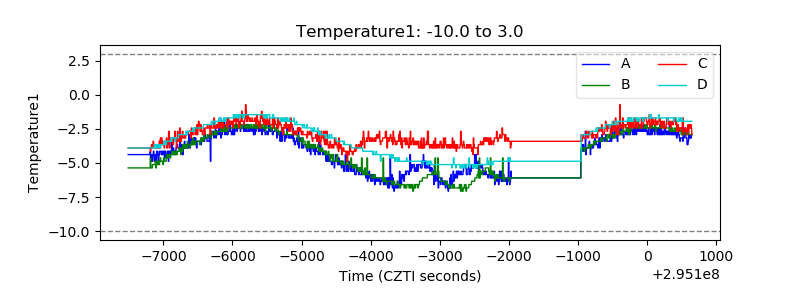 |
| Veto HV Monitor | 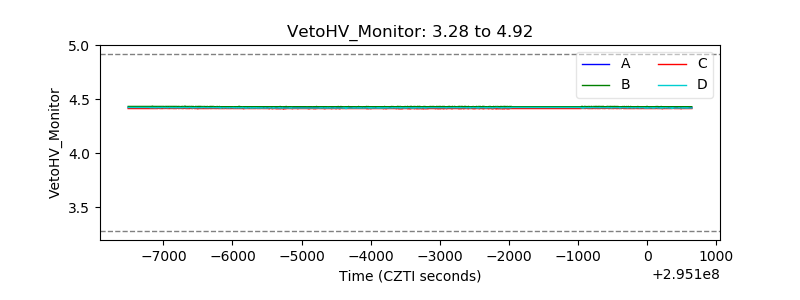 |
| Veto LLD | 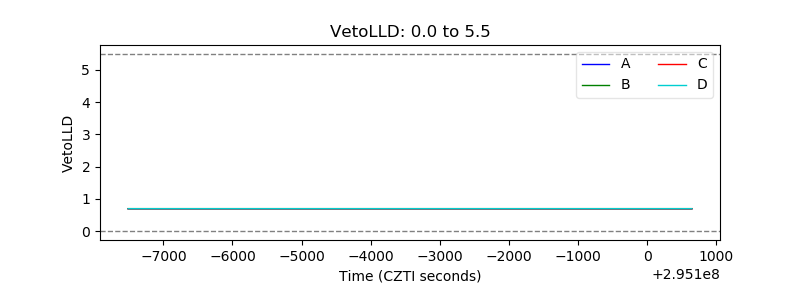 |
| Alpha Counter | 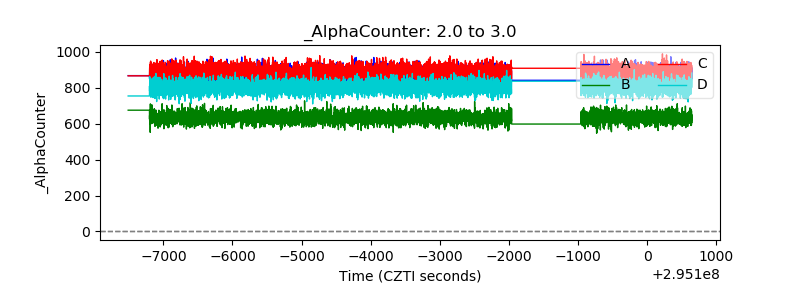 |
| _CPM_Rate | 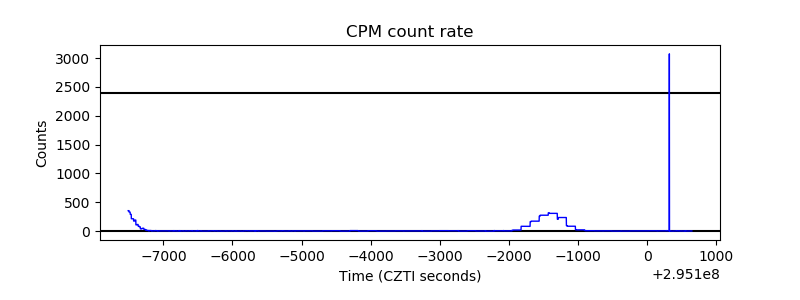 |
| CZT Counter |  |
| +2.5 Volts monitor |  |
| +5 Volts monitor |  |
| _ROLL_ROT | 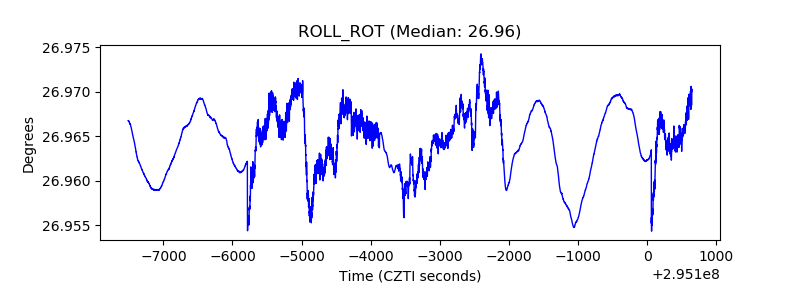 |
| _Roll_DEC | 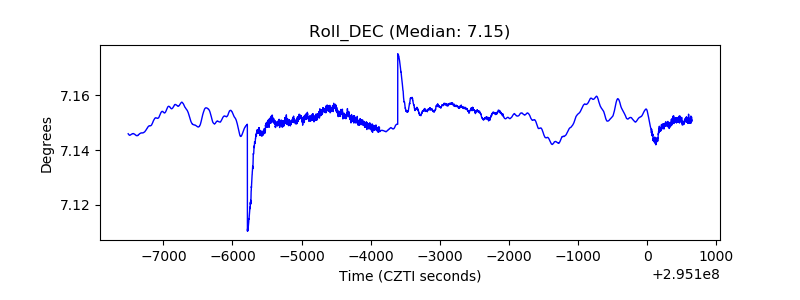 |
| _Roll_RA |  |
| Veto Counter | 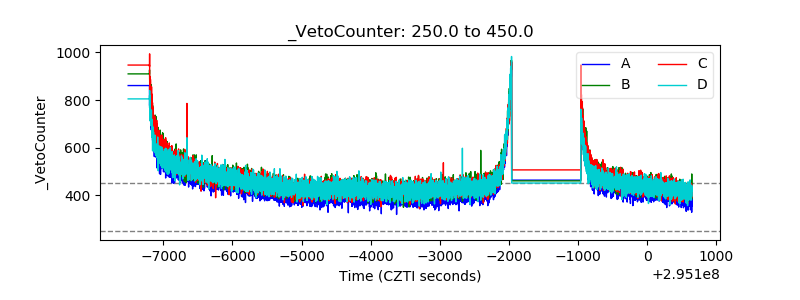 |