| Param | Original file | Final file |
|---|---|---|
| Filename | modeM0/AS1T03_108T01_9000002898_19530cztM0_level2.evt | modeM0/AS1T03_108T01_9000002898_19530cztM0_level2_quad_clean.evt |
| Size (bytes) | 559,186,560 | 82,500,480 |
| Size | 533.3 MB | 78.7 MB |
| Events in quadrant A | 3,775,078 | 497,459 |
| Events in quadrant B | 3,919,845 | 502,970 |
| Events in quadrant C | 4,070,539 | 484,814 |
| Events in quadrant D | 4,650,048 | 480,232 |
| Mode M0 | |||
|---|---|---|---|
| Quadrant | BADHDUFLAG | Total packets | Discarded packets |
| A | 0 | 16112 | 3 |
| B | 0 | 16459 | 2 |
| C | 0 | 16802 | 2 |
| D | 0 | 18947 | 2 |
| Mode SS | |||
|---|---|---|---|
| Quadrant | BADHDUFLAG | Total packets | Discarded packets |
| A | 0 | 156 | 0 |
| B | 0 | 156 | 0 |
| C | 0 | 156 | 0 |
| D | 0 | 156 | 0 |
| Mode M9 | |||
|---|---|---|---|
| Quadrant | BADHDUFLAG | Total packets | Discarded packets |
| A | 0 | 11 | 0 |
| B | 0 | 11 | 0 |
| C | 0 | 11 | 0 |
| D | 0 | 11 | 0 |
| Quadrant | Total seconds | Saturated seconds | Saturation percentage |
|---|---|---|---|
| A | 7661 | 175 | 2.284297% |
| B | 7661 | 216 | 2.819475% |
| C | 7661 | 247 | 3.224122% |
| D | 7661 | 252 | 3.289388% |
Noise dominated data is calculated using 1-second bins in cleaned event files. If a bin has >2000 counts, and if more than 50% of those come from <1% of pixels, then it is considered to be noise-dominated and hence unusable.
| Quadrant | # 1 sec bins | Bins with >0 counts | Bins with >2000 counts | High rate bins dominated by noise | Noise dominated (total time) | Noise dominated (detector-on time) | Marked lightcurve |
|---|---|---|---|---|---|---|---|
| A | 8701 | 7663 | 0 | 0 | 0.00% | 0.00% | 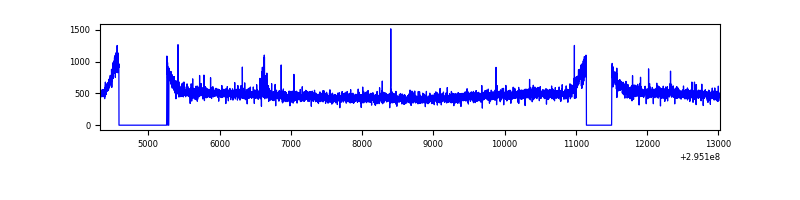 |
| B | 8701 | 7664 | 4 | 4 | 0.05% | 0.05% | 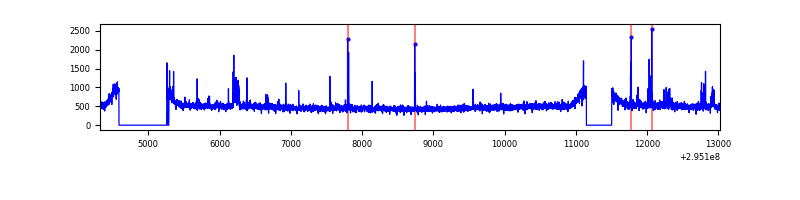 |
| C | 8701 | 7662 | 0 | 0 | 0.00% | 0.00% | 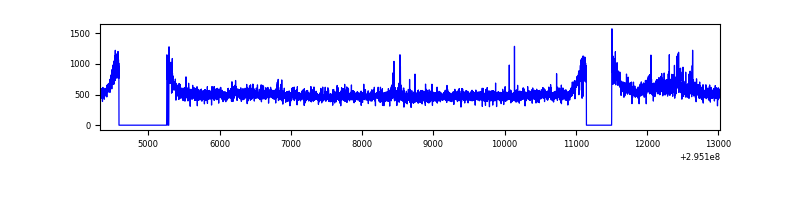 |
| D | 8701 | 7664 | 136 | 136 | 1.56% | 1.77% | 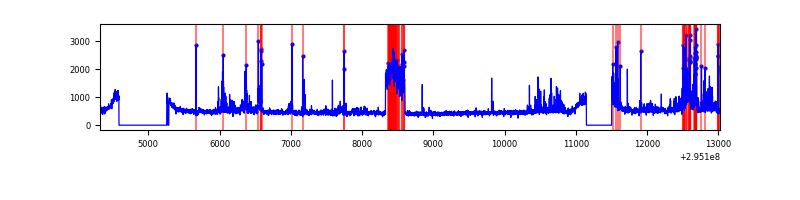 |
Top three noisy pixels from each quadrant. If the there are fewer than three noisy pixels in the level2.evt file, extra rows are filled as -1
| Pixel properties | Quadrant properties | ||||||
|---|---|---|---|---|---|---|---|
| Quadrant | DetID | PixID | Counts | Sigma | Mean | Median | Sigma |
| A | 12 | 16 | 13122 | 61.36 | 971 | 949 | 198.4 |
| A | 12 | 96 | 11887 | 55.13 | 971 | 949 | 198.4 |
| A | 13 | 254 | 10152 | 46.39 | 971 | 949 | 198.4 |
| B | 7 | 220 | 62337 | 329.5 | 964 | 939 | 186.3 |
| B | 0 | 244 | 36210 | 189.29 | 964 | 939 | 186.3 |
| B | 12 | 111 | 23278 | 119.89 | 964 | 939 | 186.3 |
| C | 3 | 233 | 303633 | 1374.1 | 926 | 933 | 220.3 |
| C | 14 | 238 | 142180 | 641.19 | 926 | 933 | 220.3 |
| C | 0 | 207 | 10157 | 41.87 | 926 | 933 | 220.3 |
| D | 1 | 52 | 436097 | 1872.26 | 945 | 918 | 232.4 |
| D | 12 | 233 | 263568 | 1129.99 | 945 | 918 | 232.4 |
| D | 12 | 218 | 248763 | 1066.3 | 945 | 918 | 232.4 |
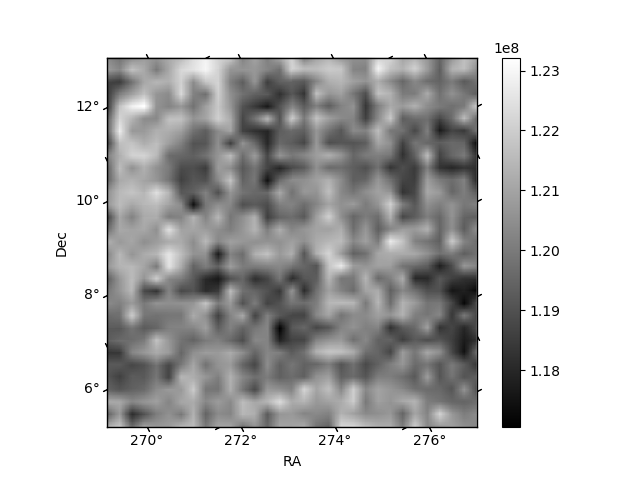
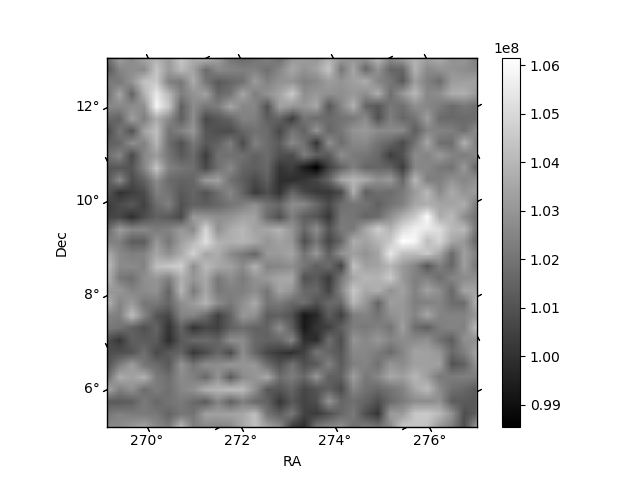
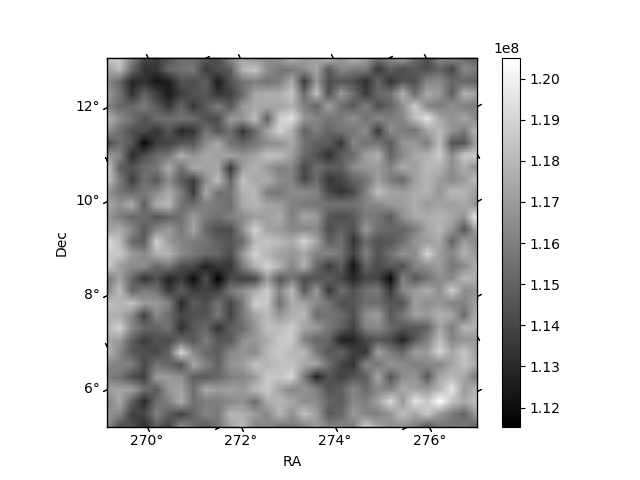
Histogram calculated using DETX and DETY for each event in the final _common_clean file
| Quadrant A | 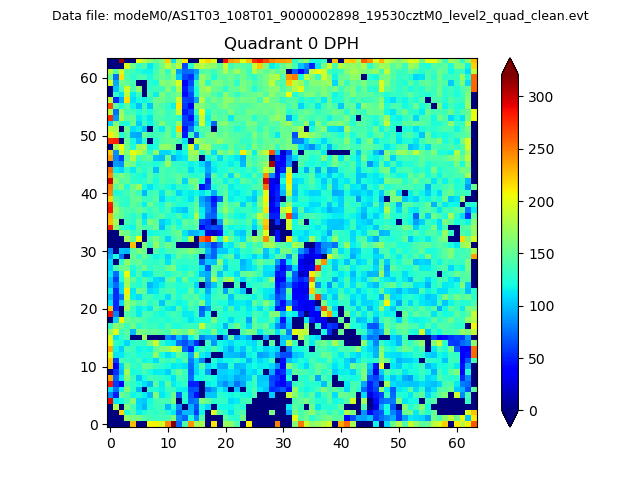 |
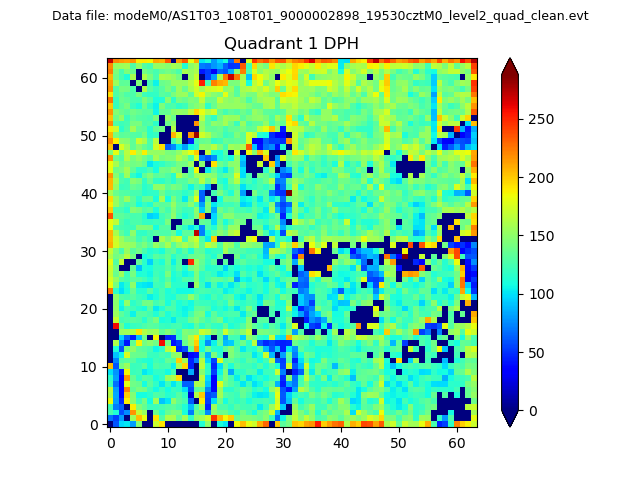 |
Quadrant B |
|---|---|---|---|
| Quadrant D | 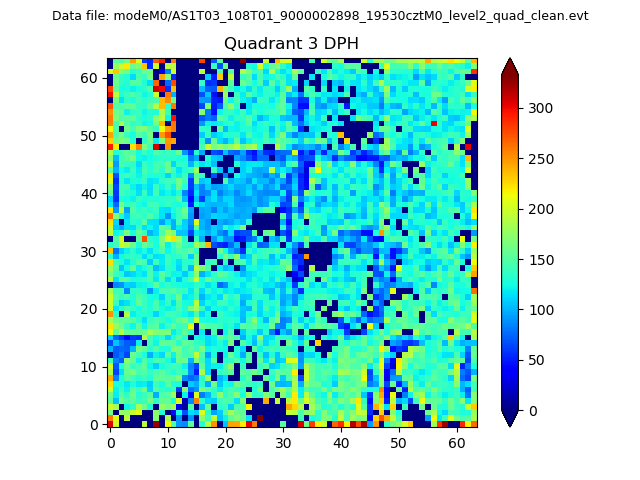 |
 |
Quadrant C |
| Plot type | Count rate plots | Images |
|---|---|---|
| Comparison with Poisson distribution Blue bars denote a histogram of data divided into 1 sec bins. Red curve is a Poisson curve with rate = median count rate of data. |
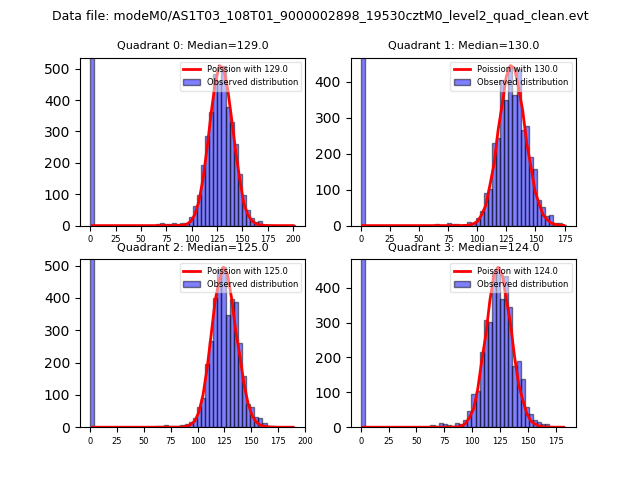 |
 |
| Quadrant-wise count rates Data is divided into 100 sec bins |
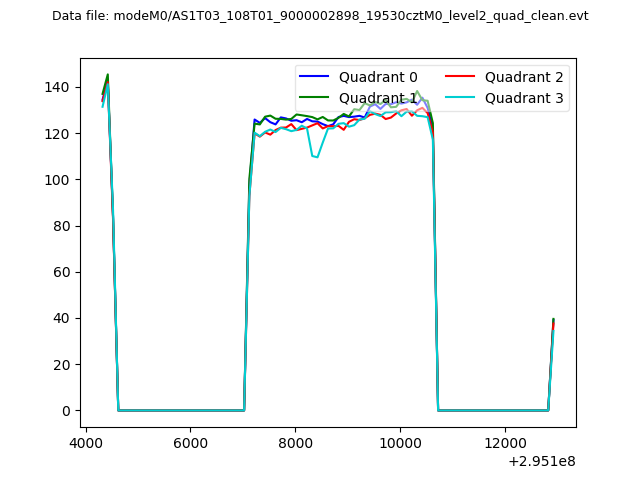 |
|
| Module-wise count rates for Quadrant A Data is divided into 100 sec bins |
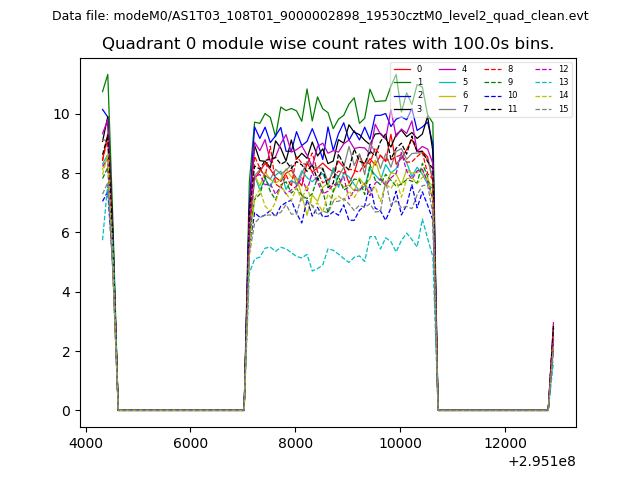 |
 |
| Module-wise count rates for Quadrant B Data is divided into 100 sec bins |
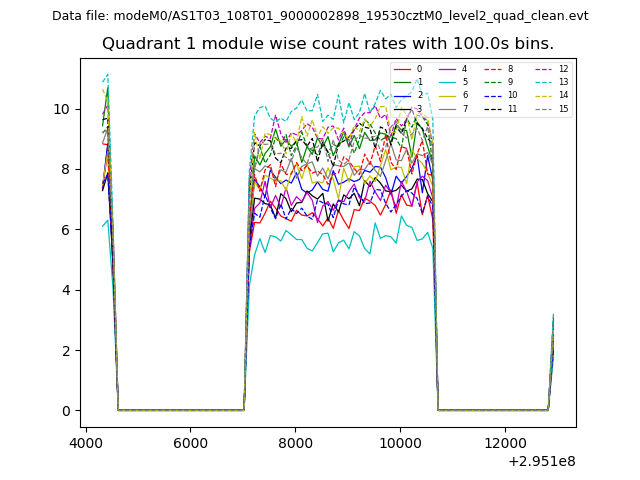 |
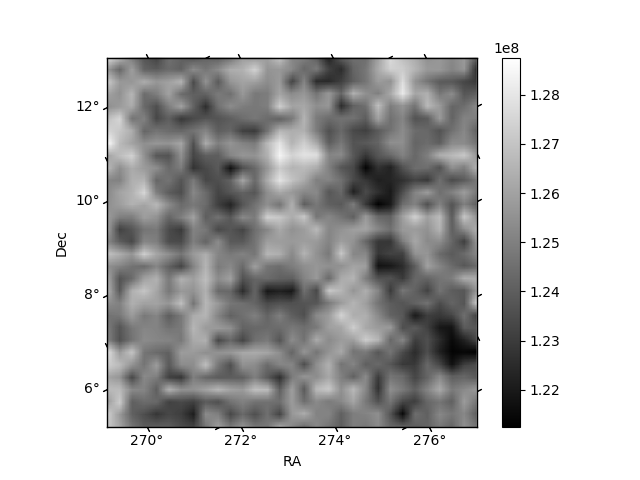 |
| Module-wise count rates for Quadrant C Data is divided into 100 sec bins |
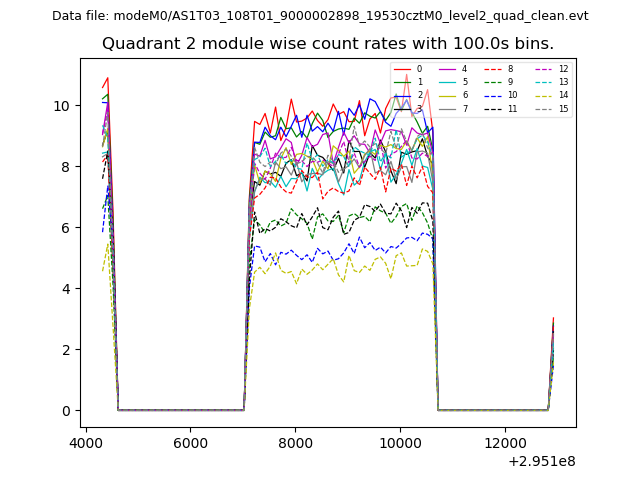 |
 |
| Module-wise count rates for Quadrant D Data is divided into 100 sec bins |
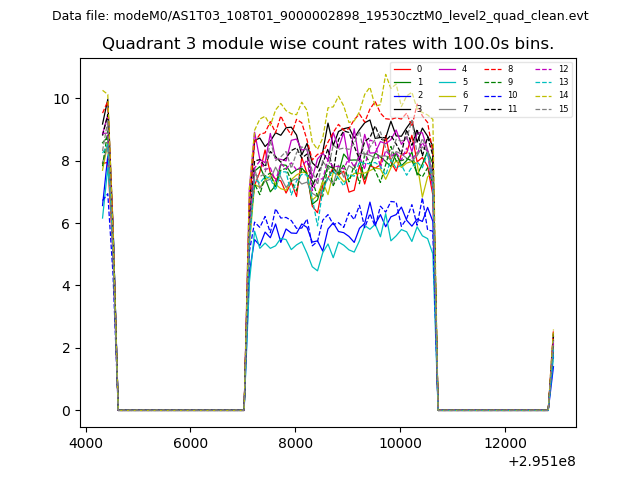 |
 |
| Parameter | Plot |
|---|---|
| CZT HV Monitor | 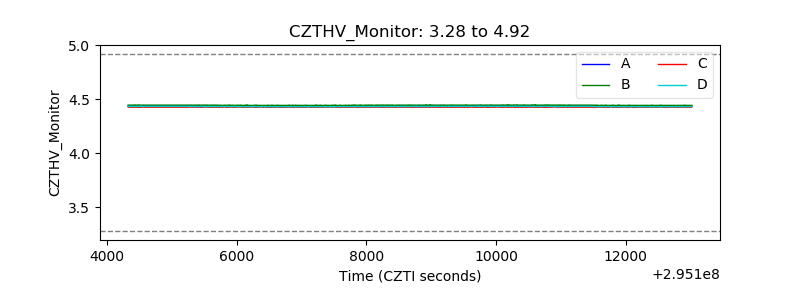 |
| D_VDD | 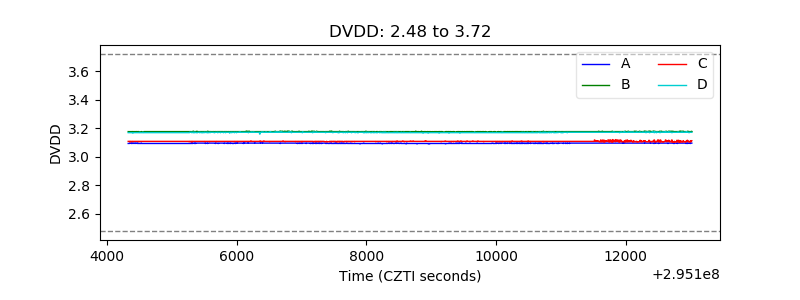 |
| Temperature 1 | 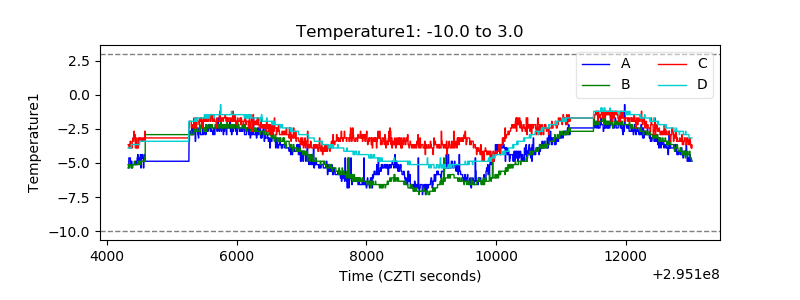 |
| Veto HV Monitor | 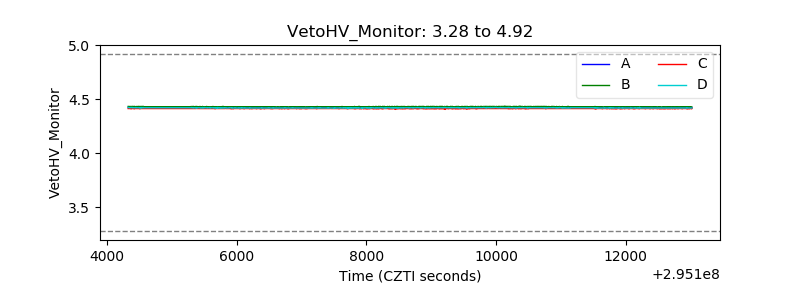 |
| Veto LLD | 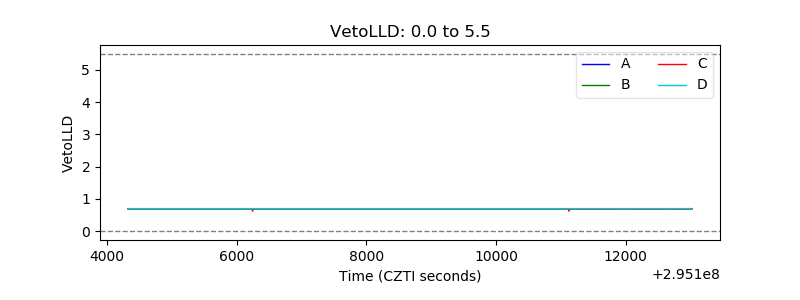 |
| Alpha Counter | 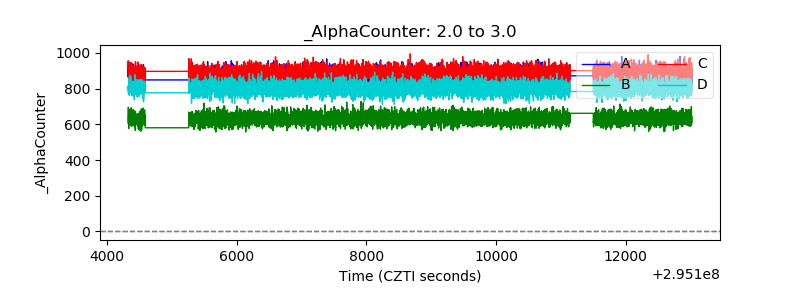 |
| _CPM_Rate | 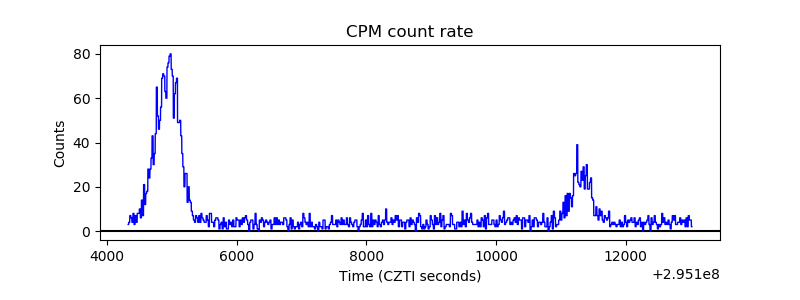 |
| CZT Counter |  |
| +2.5 Volts monitor |  |
| +5 Volts monitor |  |
| _ROLL_ROT | 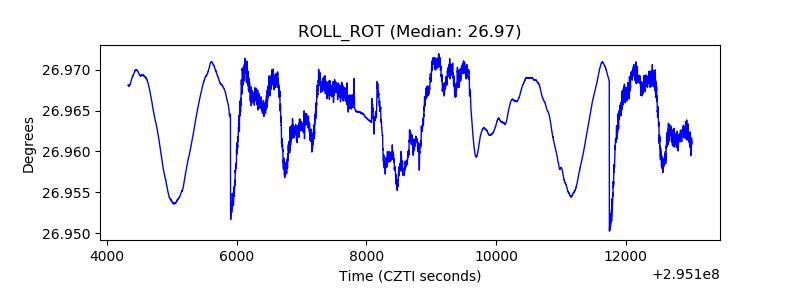 |
| _Roll_DEC | 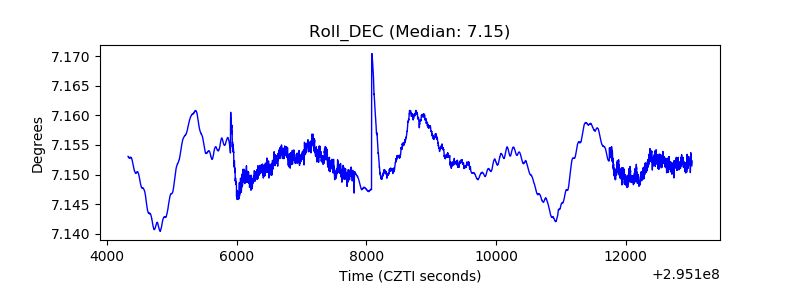 |
| _Roll_RA |  |
| Veto Counter | 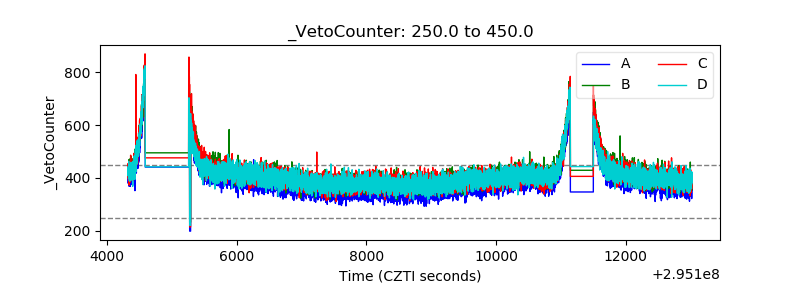 |