| Param | Original file | Final file |
|---|---|---|
| Filename | modeM0/AS1T03_108T01_9000002898_19531cztM0_level2.evt | modeM0/AS1T03_108T01_9000002898_19531cztM0_level2_quad_clean.evt |
| Size (bytes) | 222,724,800 | 22,129,920 |
| Size | 212.4 MB | 21.1 MB |
| Events in quadrant A | 1,455,530 | 118,500 |
| Events in quadrant B | 1,553,280 | 118,210 |
| Events in quadrant C | 1,638,594 | 114,880 |
| Events in quadrant D | 1,900,605 | 112,399 |
| Mode M0 | |||
|---|---|---|---|
| Quadrant | BADHDUFLAG | Total packets | Discarded packets |
| A | 0 | 6121 | 1 |
| B | 0 | 6380 | 1 |
| C | 0 | 6726 | 1 |
| D | 0 | 7477 | 1 |
| Mode SS | |||
|---|---|---|---|
| Quadrant | BADHDUFLAG | Total packets | Discarded packets |
| A | 0 | 60 | 0 |
| B | 0 | 60 | 0 |
| C | 0 | 60 | 0 |
| D | 0 | 60 | 0 |
| Mode M9 | |||
|---|---|---|---|
| Quadrant | BADHDUFLAG | Total packets | Discarded packets |
| A | 0 | 4 | 0 |
| B | 0 | 4 | 0 |
| C | 0 | 4 | 0 |
| D | 0 | 4 | 0 |
| Quadrant | Total seconds | Saturated seconds | Saturation percentage |
|---|---|---|---|
| A | 2875 | 90 | 3.130435% |
| B | 2876 | 116 | 4.033380% |
| C | 2876 | 140 | 4.867872% |
| D | 2876 | 152 | 5.285118% |
Noise dominated data is calculated using 1-second bins in cleaned event files. If a bin has >2000 counts, and if more than 50% of those come from <1% of pixels, then it is considered to be noise-dominated and hence unusable.
| Quadrant | # 1 sec bins | Bins with >0 counts | Bins with >2000 counts | High rate bins dominated by noise | Noise dominated (total time) | Noise dominated (detector-on time) | Marked lightcurve |
|---|---|---|---|---|---|---|---|
| A | 3230 | 2876 | 0 | 0 | 0.00% | 0.00% | 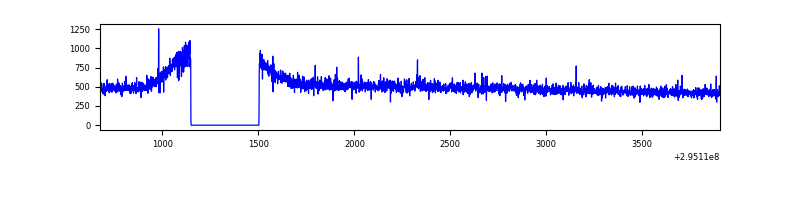 |
| B | 3231 | 2877 | 6 | 6 | 0.19% | 0.21% | 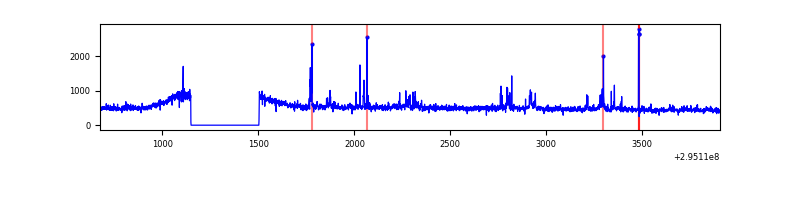 |
| C | 3231 | 2876 | 0 | 0 | 0.00% | 0.00% | 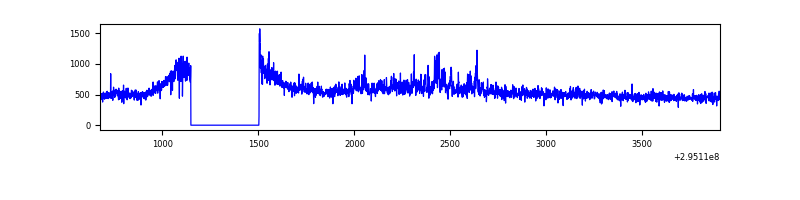 |
| D | 3231 | 2877 | 54 | 54 | 1.67% | 1.88% | 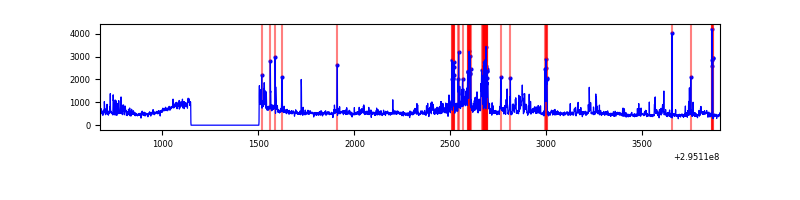 |
Top three noisy pixels from each quadrant. If the there are fewer than three noisy pixels in the level2.evt file, extra rows are filled as -1
| Pixel properties | Quadrant properties | ||||||
|---|---|---|---|---|---|---|---|
| Quadrant | DetID | PixID | Counts | Sigma | Mean | Median | Sigma |
| A | 12 | 16 | 3921 | 45.09 | 375 | 367 | 78.8 |
| A | 12 | 194 | 3490 | 39.62 | 375 | 367 | 78.8 |
| A | 13 | 254 | 3404 | 38.53 | 375 | 367 | 78.8 |
| B | 7 | 220 | 24609 | 325.82 | 372 | 363 | 74.4 |
| B | 3 | 64 | 18325 | 241.38 | 372 | 363 | 74.4 |
| B | 0 | 244 | 17774 | 233.97 | 372 | 363 | 74.4 |
| C | 3 | 233 | 185754 | 2178.11 | 355 | 356 | 85.1 |
| C | 14 | 238 | 55759 | 650.89 | 355 | 356 | 85.1 |
| C | 8 | 128 | 5686 | 62.62 | 355 | 356 | 85.1 |
| D | 12 | 218 | 197221 | 2171.57 | 363 | 352 | 90.7 |
| D | 12 | 233 | 178319 | 1963.07 | 363 | 352 | 90.7 |
| D | 1 | 52 | 71167 | 781.13 | 363 | 352 | 90.7 |
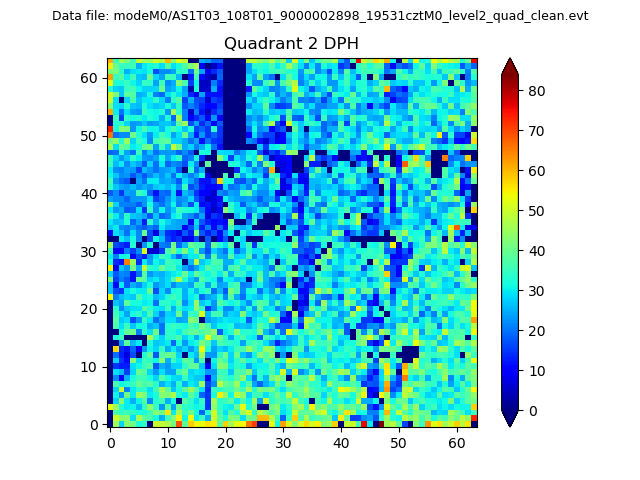
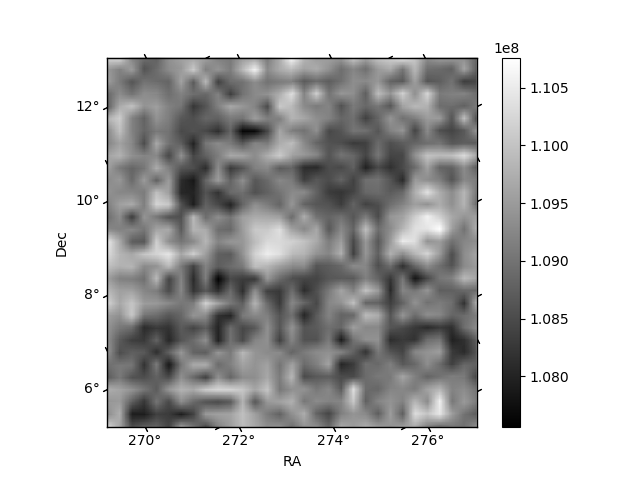
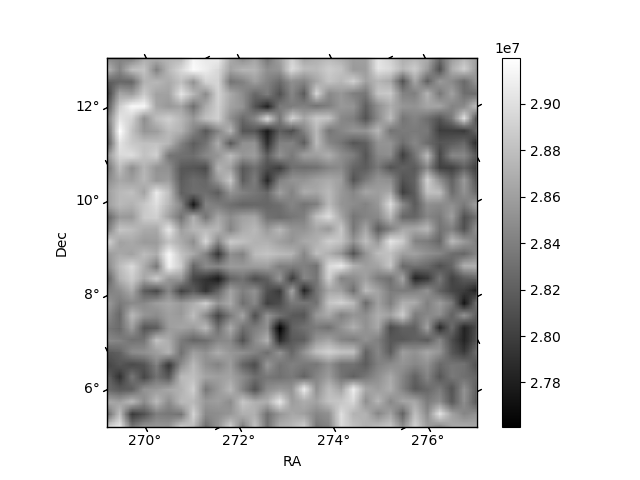
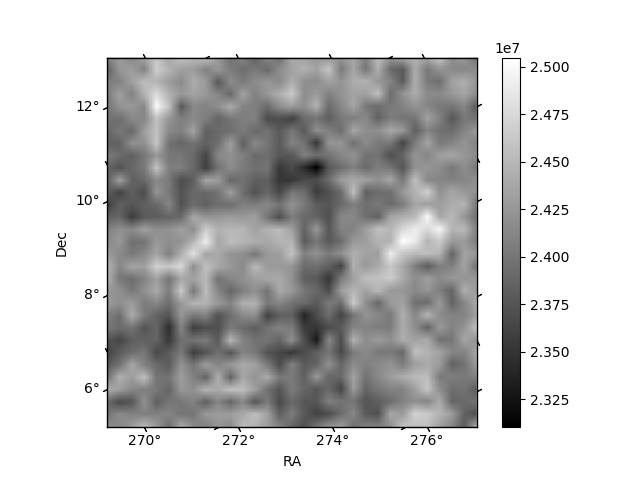
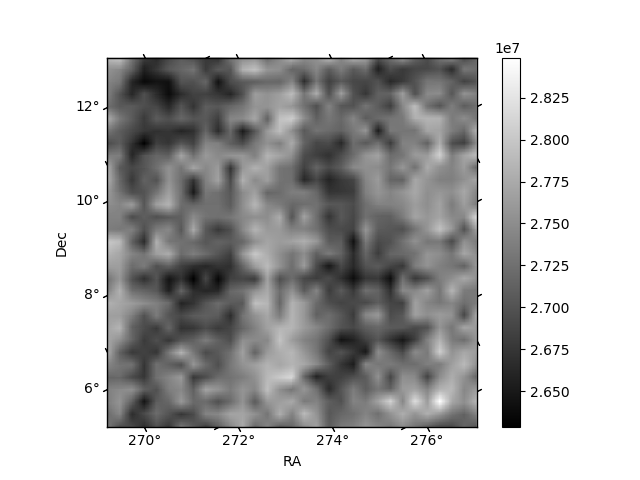
Histogram calculated using DETX and DETY for each event in the final _common_clean file
| Quadrant A | 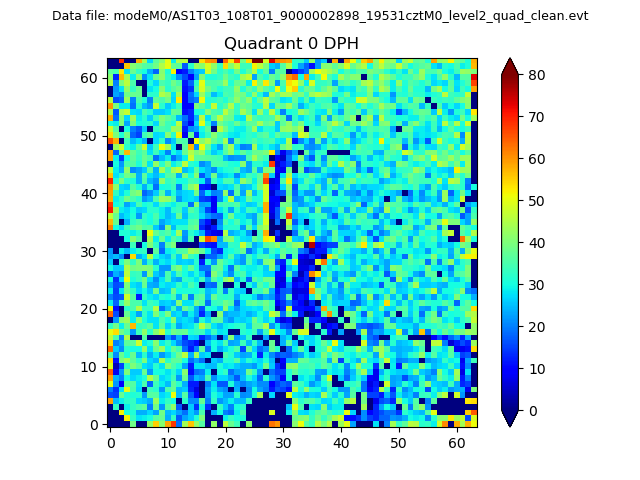 |
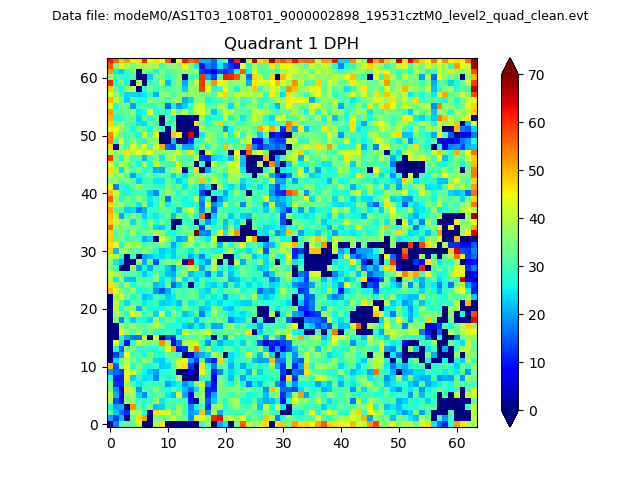 |
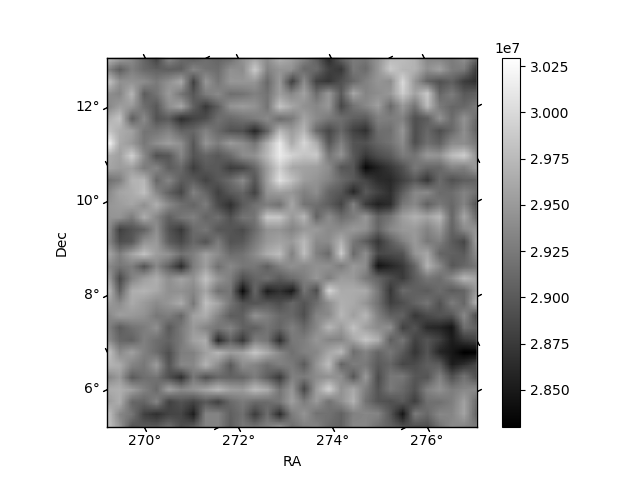
Quadrant B |
|---|---|---|---|
| Quadrant D | 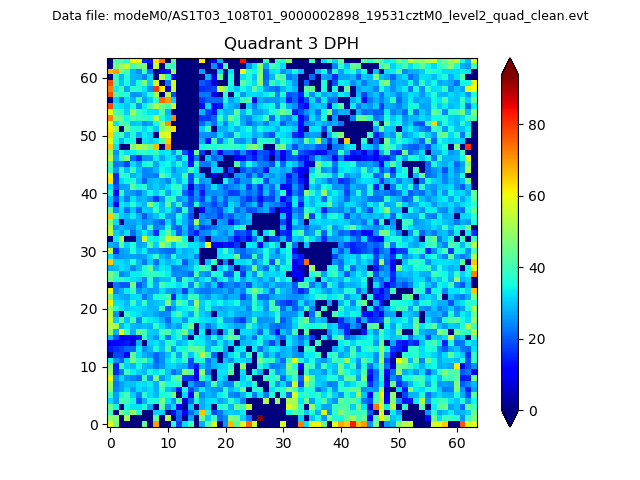 |
 |
Quadrant C |
| Plot type | Count rate plots | Images |
|---|---|---|
| Comparison with Poisson distribution Blue bars denote a histogram of data divided into 1 sec bins. Red curve is a Poisson curve with rate = median count rate of data. |
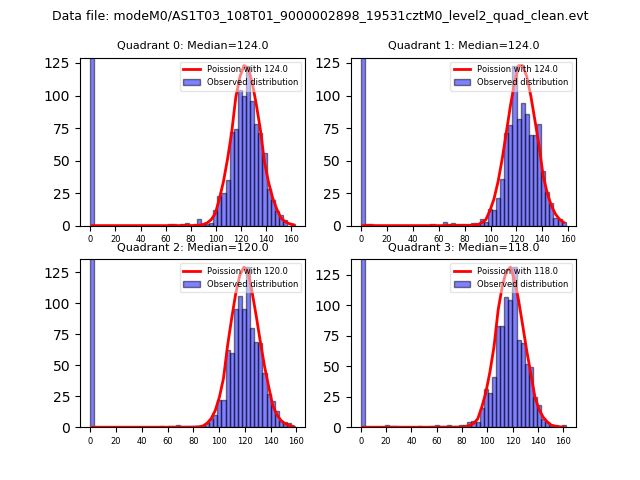 |
 |
| Quadrant-wise count rates Data is divided into 100 sec bins |
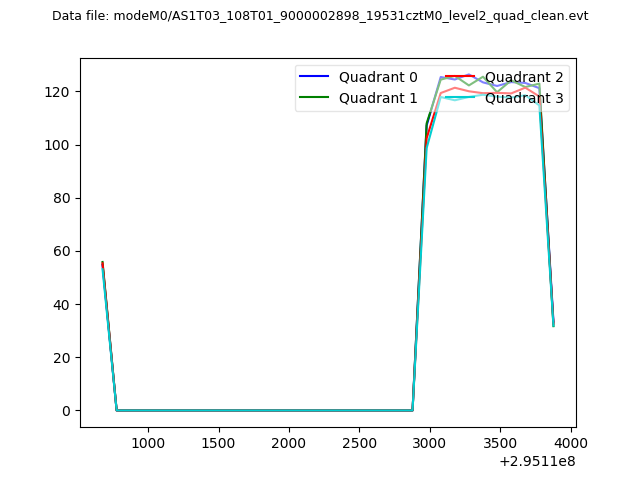 |
|
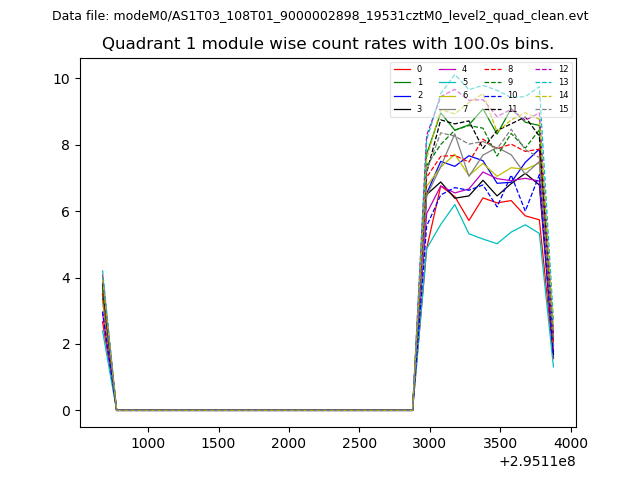
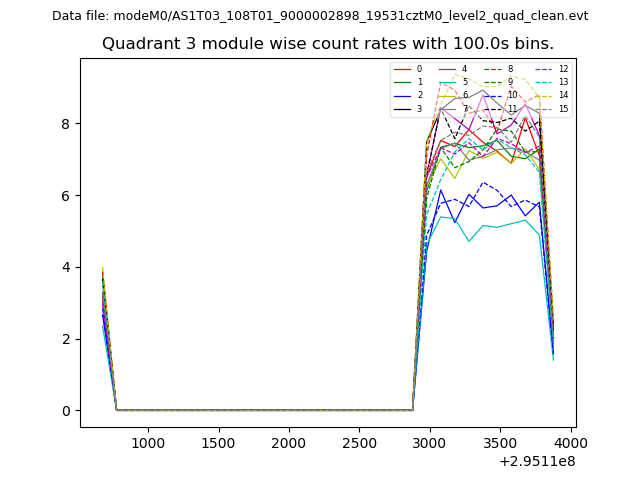
| Module-wise count rates for Quadrant A Data is divided into 100 sec bins |
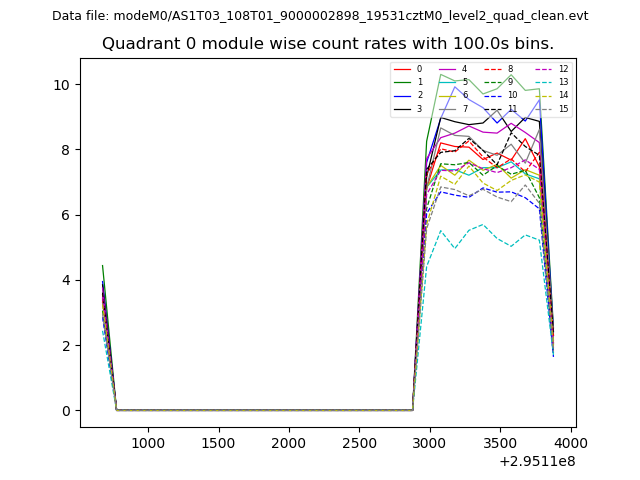 |
 |
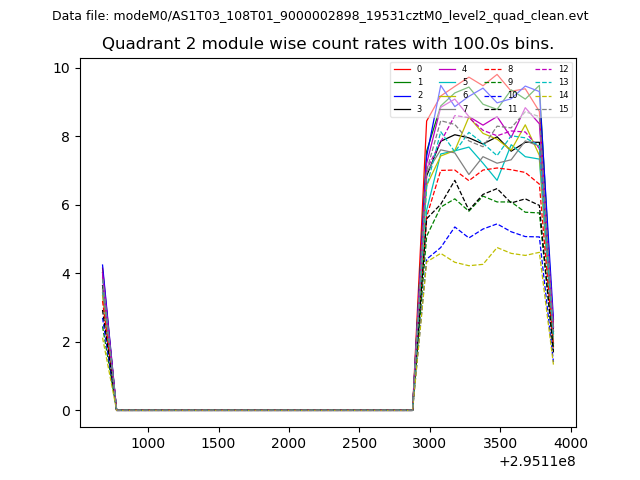
| Module-wise count rates for Quadrant B Data is divided into 100 sec bins |
 |
 |
| Module-wise count rates for Quadrant C Data is divided into 100 sec bins |
 |
 |
| Module-wise count rates for Quadrant D Data is divided into 100 sec bins |
 |
 |
| Parameter | Plot |
|---|---|
| CZT HV Monitor | 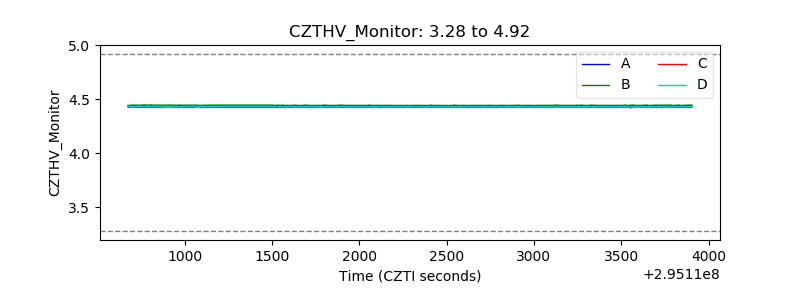 |
| D_VDD | 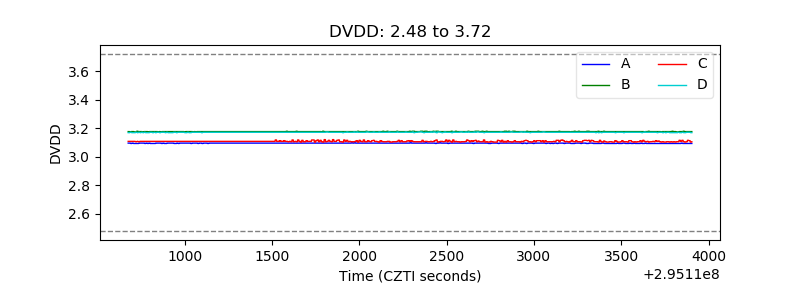 |
| Temperature 1 | 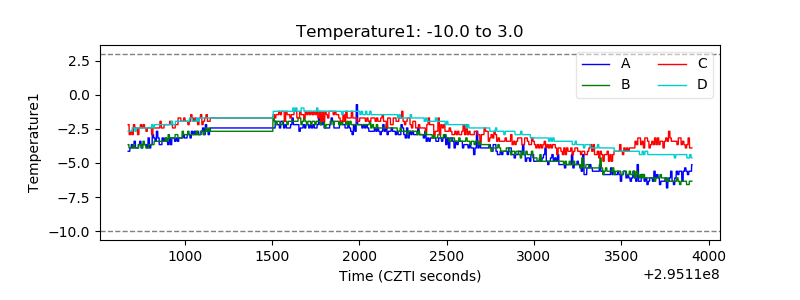 |
| Veto HV Monitor |  |
| Veto LLD | 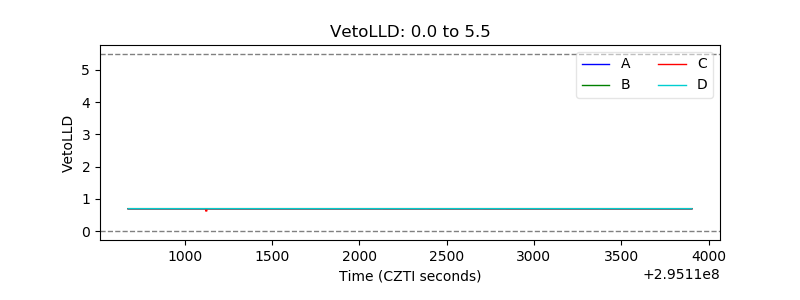 |
| Alpha Counter |  |
| _CPM_Rate | 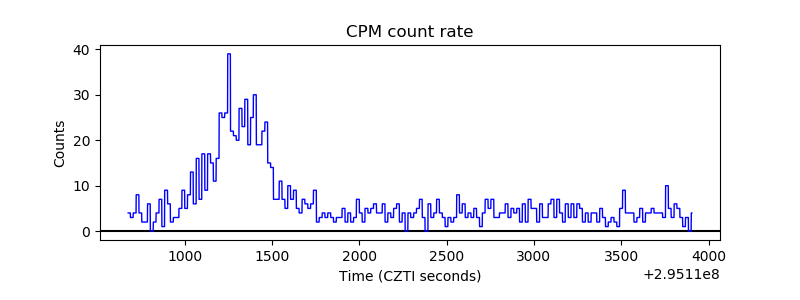 |
| CZT Counter | 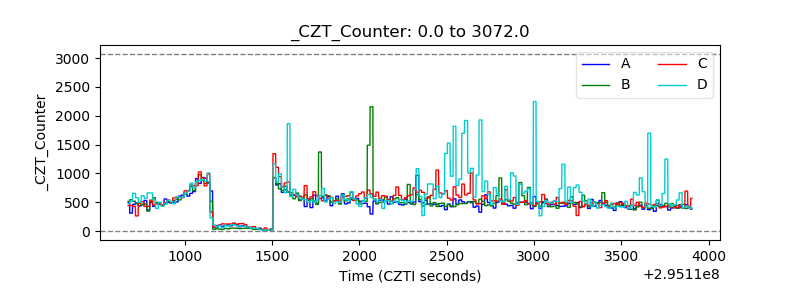 |
| +2.5 Volts monitor |  |
| +5 Volts monitor |  |
| _ROLL_ROT | 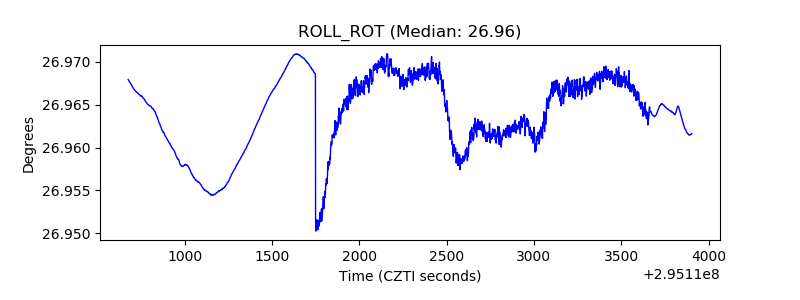 |
| _Roll_DEC | 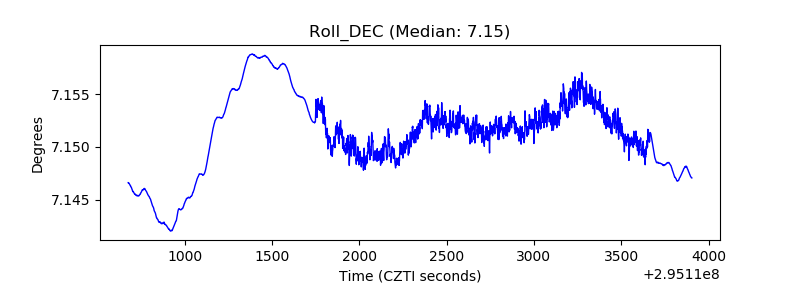 |
| _Roll_RA | 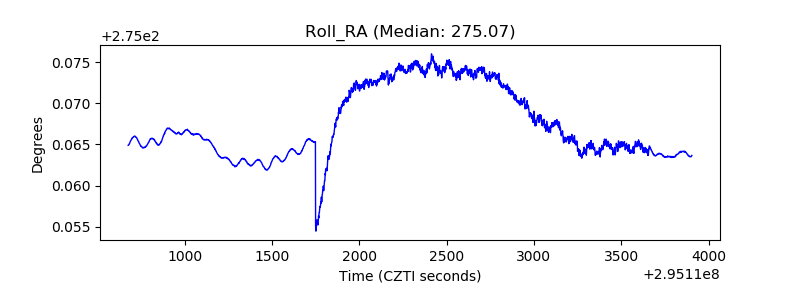 |
| Veto Counter | 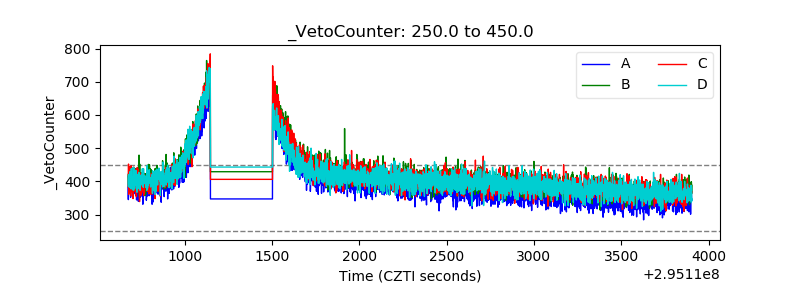 |