| Param | Original file | Final file |
|---|---|---|
| Filename | modeM0/AS1A05_115T02_9000002906cztM0_level2.fits | modeM0/AS1A05_115T02_9000002906cztM0_level2_quad_clean.evt |
| Size (bytes) | 649,543,680 | 603,259,200 |
| Size | 619.5 MB | 575.3 MB |
| Events in quadrant A | 4,040,568 | 3,638,233 |
| Events in quadrant B | 3,868,396 | 3,636,985 |
| Events in quadrant C | 3,858,944 | 3,370,898 |
| Events in quadrant D | 3,394,056 | 3,113,620 |
| Mode M0 | |||
|---|---|---|---|
| Quadrant | BADHDUFLAG | Total packets | Discarded packets |
| A | 0 | 137047 | 0 |
| B | 0 | 138929 | 0 |
| C | 0 | 142437 | 0 |
| D | 0 | 154704 | 0 |
| Mode M9 | |||
|---|---|---|---|
| Quadrant | BADHDUFLAG | Total packets | Discarded packets |
| A | 0 | 108 | 0 |
| B | 0 | 108 | 0 |
| C | 0 | 108 | 0 |
| D | 0 | 108 | 0 |
| Mode SS | |||
|---|---|---|---|
| Quadrant | BADHDUFLAG | Total packets | Discarded packets |
| A | 0 | 1340 | 0 |
| B | 0 | 1340 | 0 |
| C | 0 | 1340 | 0 |
| D | 0 | 1340 | 0 |
| Quadrant | Total seconds | Saturated seconds | Saturation percentage |
|---|---|---|---|
| A | 65763 | 803 | 1.221051% |
| B | 65763 | 1023 | 1.555586% |
| C | 65763 | 1230 | 1.870353% |
| D | 65763 | 1296 | 1.970713% |
Noise dominated data is calculated using 1-second bins in cleaned event files. If a bin has >2000 counts, and if more than 50% of those come from <1% of pixels, then it is considered to be noise-dominated and hence unusable.
| Quadrant | # 1 sec bins | Bins with >0 counts | Bins with >2000 counts | High rate bins dominated by noise | Noise dominated (total time) | Noise dominated (detector-on time) | Marked lightcurve |
|---|---|---|---|---|---|---|---|
| A | 76398 | 65758 | 0 | 0 | 0.00% | 0.00% |  |
| B | 76398 | 65753 | 0 | 0 | 0.00% | 0.00% |  |
| C | 76398 | 65758 | 0 | 0 | 0.00% | 0.00% |  |
| D | 76398 | 65749 | 0 | 0 | 0.00% | 0.00% |  |
Top three noisy pixels from each quadrant. If the there are fewer than three noisy pixels in the level2.evt file, extra rows are filled as -1
| Pixel properties | Quadrant properties | ||||||
|---|---|---|---|---|---|---|---|
| Quadrant | DetID | PixID | Counts | Sigma | Mean | Median | Sigma |
| A | 0 | 29 | 3793 | 10.78 | 1052 | 987 | 260.2 |
| A | 7 | 110 | 3237 | 8.65 | 1052 | 987 | 260.2 |
| A | 9 | 19 | 3015 | 7.79 | 1052 | 987 | 260.2 |
| B | 2 | 9 | 3100 | 10.78 | 1019 | 973 | 197.3 |
| B | 2 | 8 | 2564 | 8.06 | 1019 | 973 | 197.3 |
| B | 5 | 128 | 2557 | 8.03 | 1019 | 973 | 197.3 |
| C | 1 | 80 | 2842 | 7.24 | 1020 | 952 | 261.2 |
| C | 1 | 81 | 2773 | 6.97 | 1020 | 952 | 261.2 |
| C | 2 | 191 | 2665 | 6.56 | 1020 | 952 | 261.2 |
| D | 6 | 231 | 2470 | 6.25 | 969 | 883 | 253.9 |
| D | 7 | 3 | 2424 | 6.07 | 969 | 883 | 253.9 |
| D | 10 | 189 | 2353 | 5.79 | 969 | 883 | 253.9 |
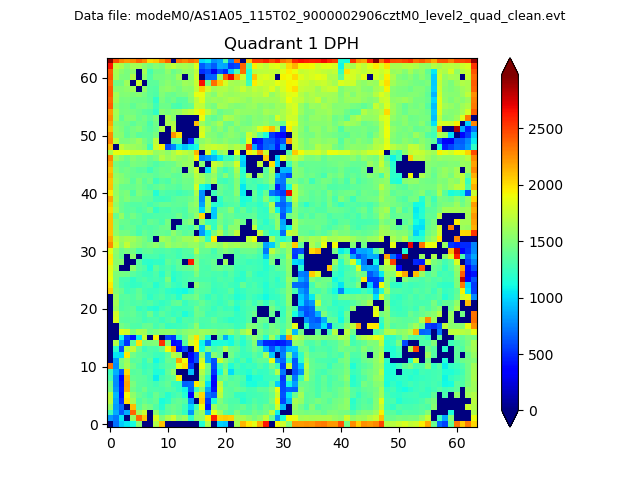
Histogram calculated using DETX and DETY for each event in the final _common_clean file
| Quadrant A |  |
 |
Quadrant B |
|---|---|---|---|
| Quadrant D | 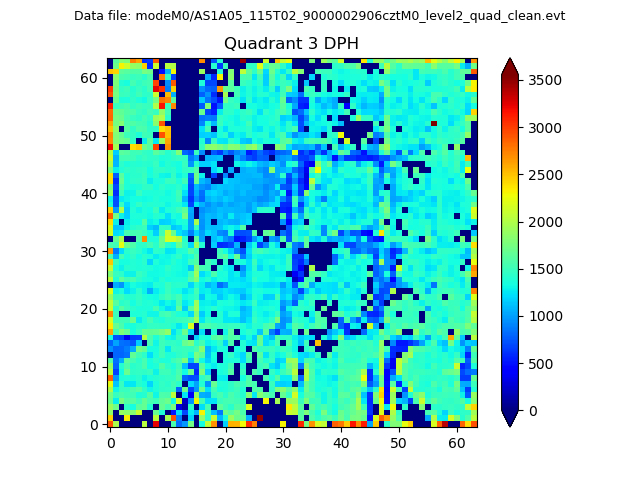 |
 |
Quadrant C |
| Plot type | Count rate plots | Images |
|---|---|---|
| Comparison with Poisson distribution Blue bars denote a histogram of data divided into 1 sec bins. Red curve is a Poisson curve with rate = median count rate of data. |
 |
 |
| Quadrant-wise count rates Data is divided into 100 sec bins |
 |
|
| Module-wise count rates for Quadrant A Data is divided into 100 sec bins |
 |
 |
| Module-wise count rates for Quadrant B Data is divided into 100 sec bins |
 |
 |
| Module-wise count rates for Quadrant C Data is divided into 100 sec bins |
 |
 |
| Module-wise count rates for Quadrant D Data is divided into 100 sec bins |
 |
 |
| Parameter | Plot |
|---|---|
| CZT HV Monitor |  |
| D_VDD | 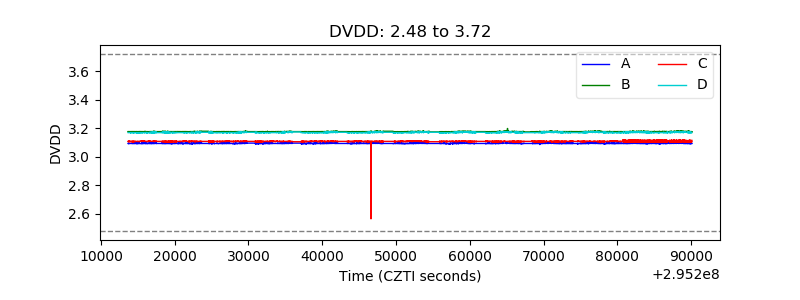 |
| Temperature 1 |  |
| Veto HV Monitor |  |
| Veto LLD |  |
| Alpha Counter |  |
| _CPM_Rate |  |
| CZT Counter |  |
| +2.5 Volts monitor |  |
| +5 Volts monitor |  |
| _ROLL_ROT |  |
| _Roll_DEC |  |
| _Roll_RA |  |
| Veto Counter |  |