| Param | Original file | Final file |
|---|---|---|
| Filename | modeM0/AS1A05_115T02_9000002906_19550cztM0_level2.evt | modeM0/AS1A05_115T02_9000002906_19550cztM0_level2_quad_clean.evt |
| Size (bytes) | 447,261,120 | 90,671,040 |
| Size | 426.5 MB | 86.5 MB |
| Events in quadrant A | 3,067,882 | 583,843 |
| Events in quadrant B | 3,126,469 | 594,817 |
| Events in quadrant C | 3,575,542 | 556,003 |
| Events in quadrant D | 3,327,659 | 551,850 |
| Mode M0 | |||
|---|---|---|---|
| Quadrant | BADHDUFLAG | Total packets | Discarded packets |
| A | 0 | 13417 | 2 |
| B | 0 | 13560 | 2 |
| C | 0 | 15007 | 2 |
| D | 0 | 14658 | 3 |
| Mode M9 | |||
|---|---|---|---|
| Quadrant | BADHDUFLAG | Total packets | Discarded packets |
| A | 0 | 12 | 0 |
| B | 0 | 13 | 0 |
| C | 0 | 13 | 0 |
| D | 0 | 13 | 0 |
| Mode SS | |||
|---|---|---|---|
| Quadrant | BADHDUFLAG | Total packets | Discarded packets |
| A | 0 | 134 | 0 |
| B | 0 | 134 | 0 |
| C | 0 | 134 | 0 |
| D | 0 | 134 | 0 |
| Quadrant | Total seconds | Saturated seconds | Saturation percentage |
|---|---|---|---|
| A | 6587 | 25 | 0.379535% |
| B | 6587 | 33 | 0.500987% |
| C | 6587 | 97 | 1.472598% |
| D | 6586 | 49 | 0.744002% |
Noise dominated data is calculated using 1-second bins in cleaned event files. If a bin has >2000 counts, and if more than 50% of those come from <1% of pixels, then it is considered to be noise-dominated and hence unusable.
| Quadrant | # 1 sec bins | Bins with >0 counts | Bins with >2000 counts | High rate bins dominated by noise | Noise dominated (total time) | Noise dominated (detector-on time) | Marked lightcurve |
|---|---|---|---|---|---|---|---|
| A | 7627 | 6588 | 0 | 0 | 0.00% | 0.00% | 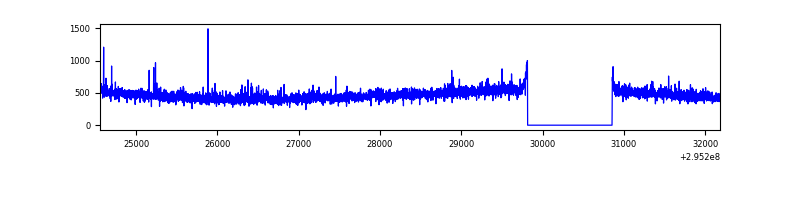 |
| B | 7627 | 6588 | 7 | 7 | 0.09% | 0.11% | 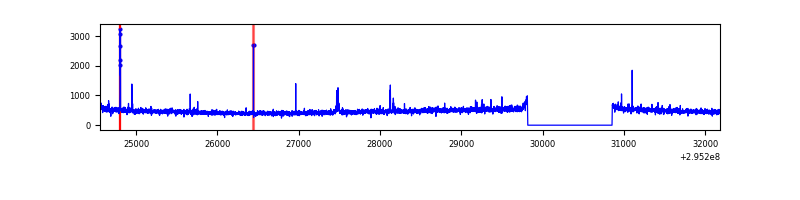 |
| C | 7627 | 6588 | 28 | 28 | 0.37% | 0.43% | 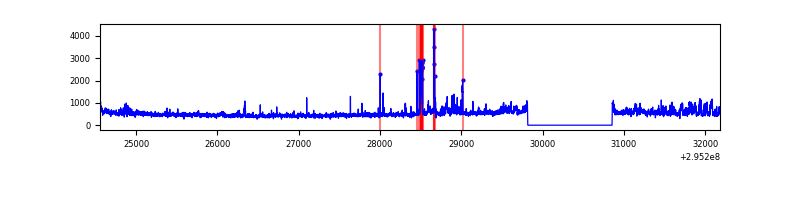 |
| D | 7626 | 6587 | 31 | 31 | 0.41% | 0.47% | 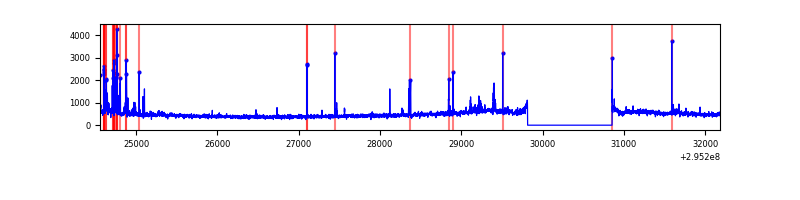 |
Top three noisy pixels from each quadrant. If the there are fewer than three noisy pixels in the level2.evt file, extra rows are filled as -1
| Pixel properties | Quadrant properties | ||||||
|---|---|---|---|---|---|---|---|
| Quadrant | DetID | PixID | Counts | Sigma | Mean | Median | Sigma |
| A | 9 | 143 | 51525 | 319.33 | 783 | 766 | 159.0 |
| A | 13 | 254 | 8399 | 48.02 | 783 | 766 | 159.0 |
| A | 0 | 226 | 6700 | 37.33 | 783 | 766 | 159.0 |
| B | 0 | 230 | 29127 | 189.25 | 780 | 760 | 149.9 |
| B | 3 | 64 | 26710 | 173.13 | 780 | 760 | 149.9 |
| B | 12 | 111 | 18012 | 115.1 | 780 | 760 | 149.9 |
| C | 7 | 247 | 284408 | 1620.88 | 748 | 756 | 175.0 |
| C | 3 | 233 | 138239 | 785.63 | 748 | 756 | 175.0 |
| C | 14 | 238 | 117177 | 665.27 | 748 | 756 | 175.0 |
| D | 7 | 238 | 206510 | 1116.5 | 756 | 734 | 184.3 |
| D | 12 | 218 | 135919 | 733.48 | 756 | 734 | 184.3 |
| D | 1 | 52 | 49157 | 262.73 | 756 | 734 | 184.3 |
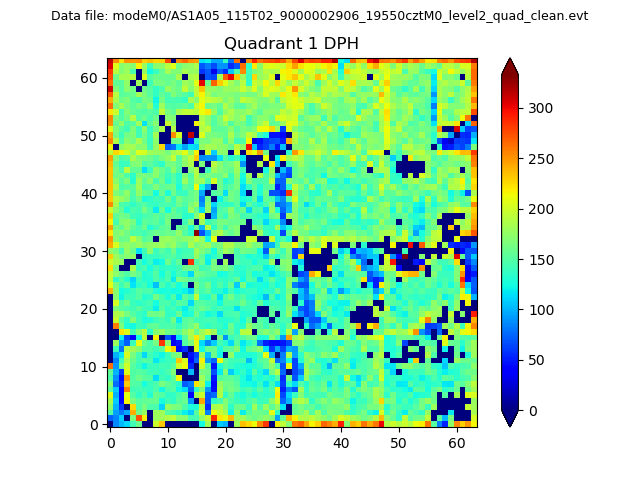
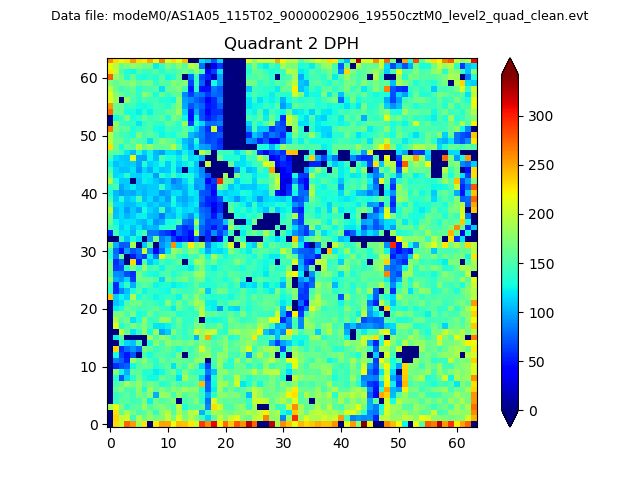
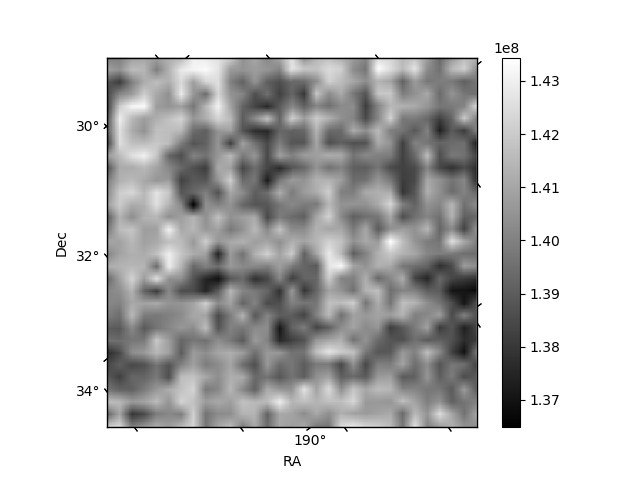
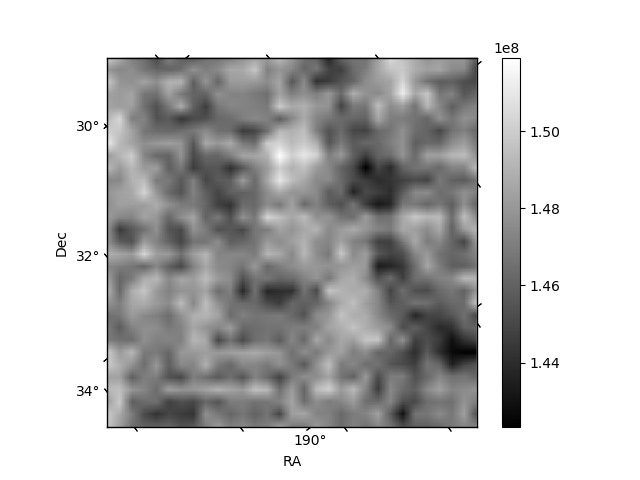
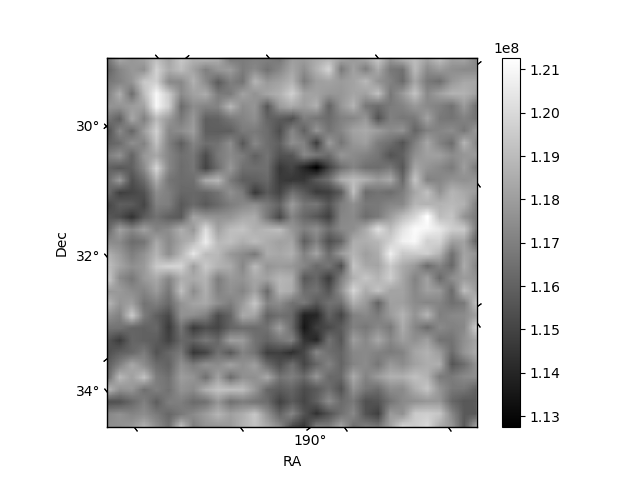
Histogram calculated using DETX and DETY for each event in the final _common_clean file
| Quadrant A |  |
 |
Quadrant B |
|---|---|---|---|
| Quadrant D |  |
 |
Quadrant C |
| Plot type | Count rate plots | Images |
|---|---|---|
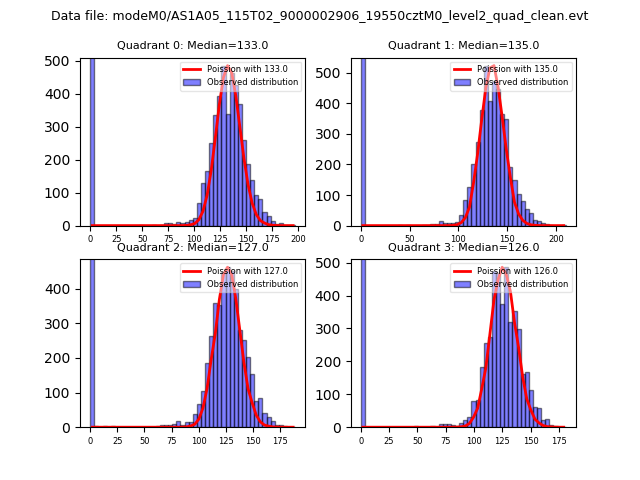
| Comparison with Poisson distribution Blue bars denote a histogram of data divided into 1 sec bins. Red curve is a Poisson curve with rate = median count rate of data. |
 |
 |
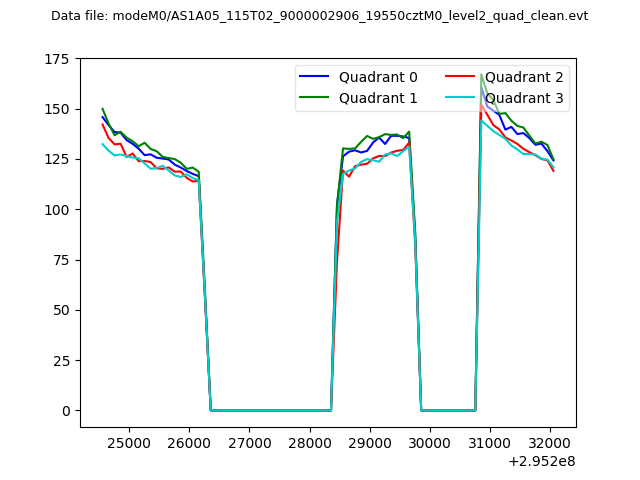
| Quadrant-wise count rates Data is divided into 100 sec bins |
 |
|
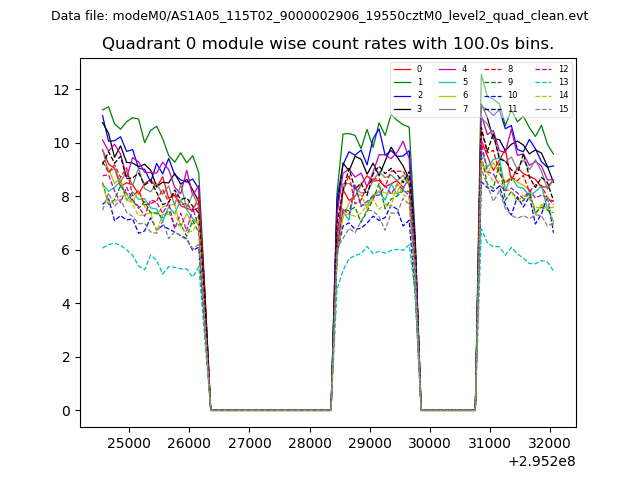
| Module-wise count rates for Quadrant A Data is divided into 100 sec bins |
 |
 |
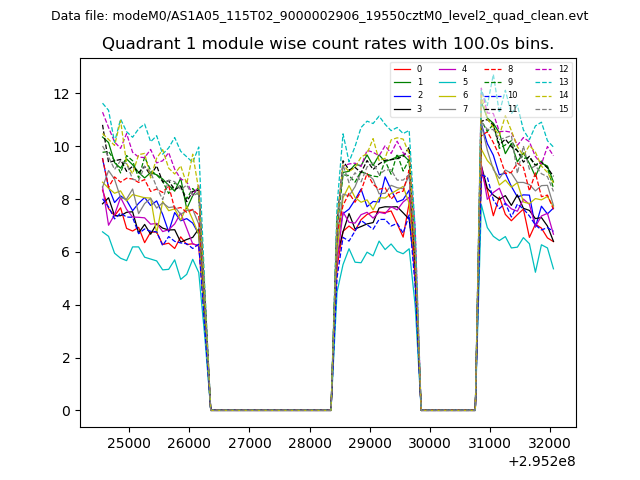
| Module-wise count rates for Quadrant B Data is divided into 100 sec bins |
 |
 |
| Module-wise count rates for Quadrant C Data is divided into 100 sec bins |
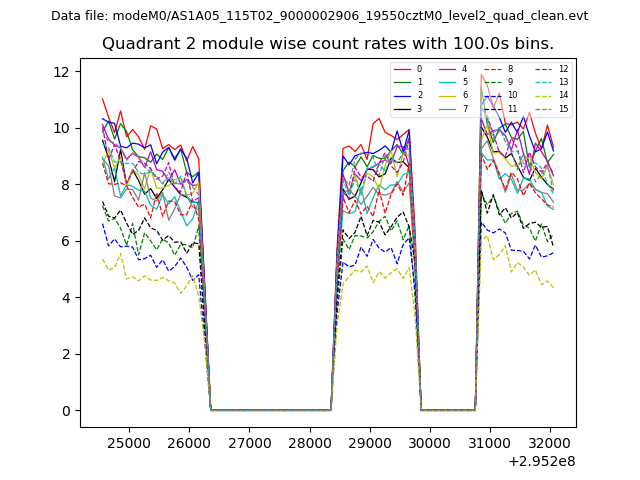 |
 |
| Module-wise count rates for Quadrant D Data is divided into 100 sec bins |
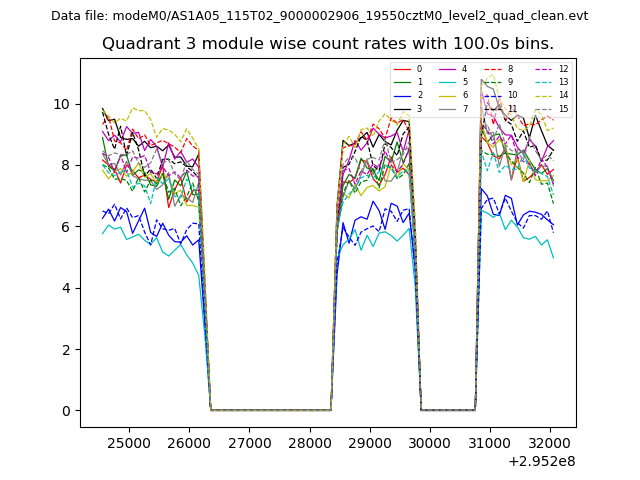 |
 |
| Parameter | Plot |
|---|---|
| CZT HV Monitor | 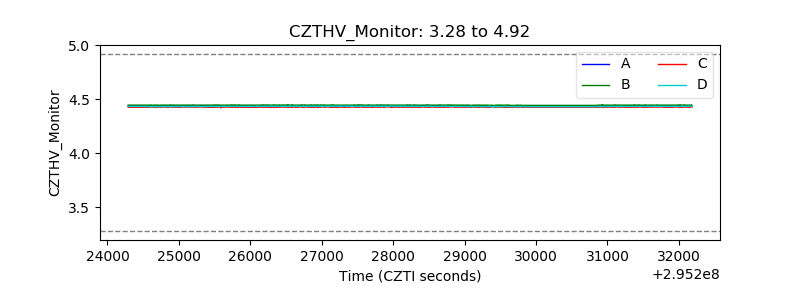 |
| D_VDD | 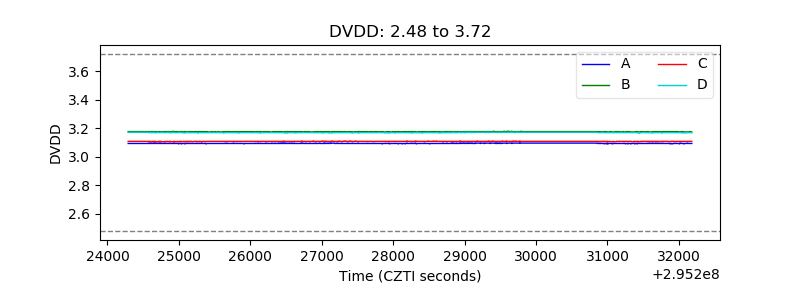 |
| Temperature 1 | 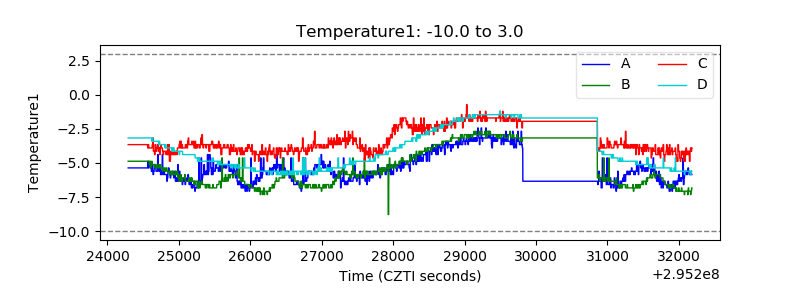 |
| Veto HV Monitor | 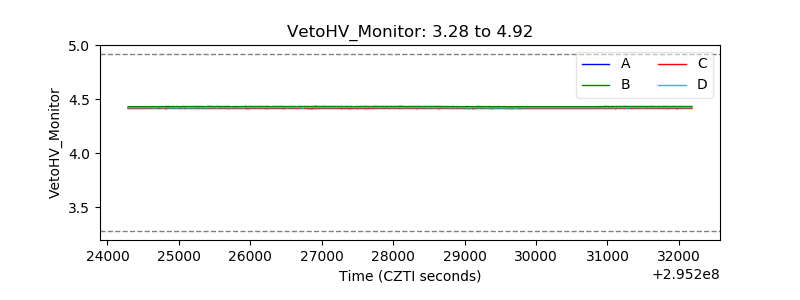 |
| Veto LLD | 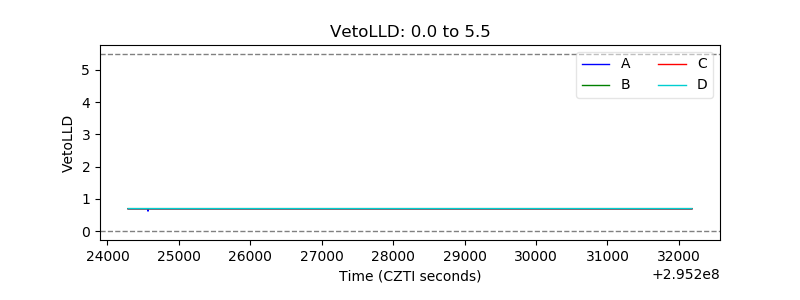 |
| Alpha Counter | 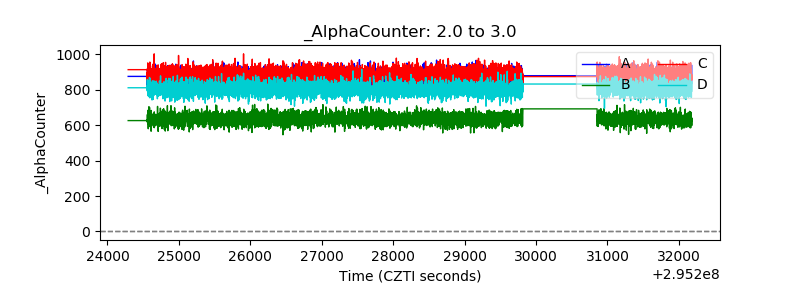 |
| _CPM_Rate | 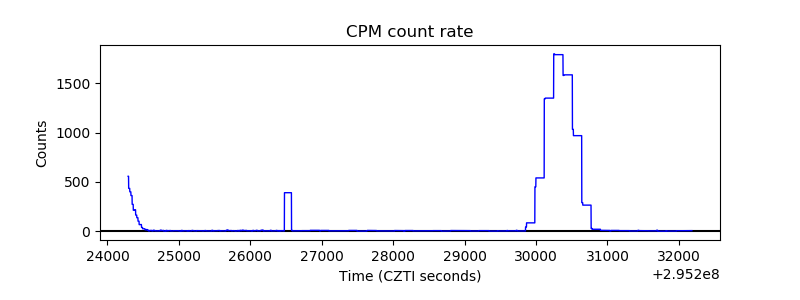 |
| CZT Counter | 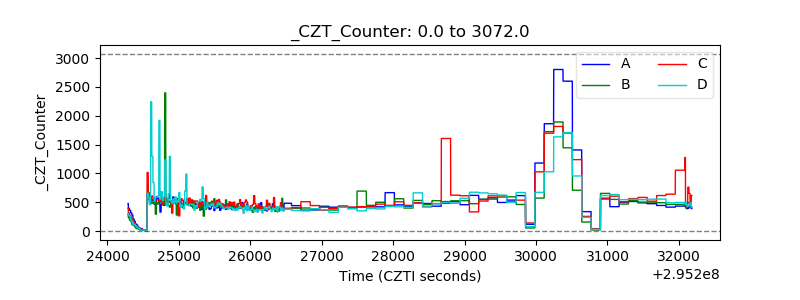 |
| +2.5 Volts monitor |  |
| +5 Volts monitor |  |
| _ROLL_ROT | 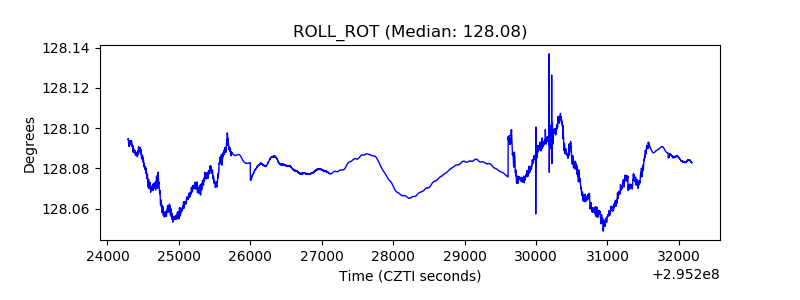 |
| _Roll_DEC | 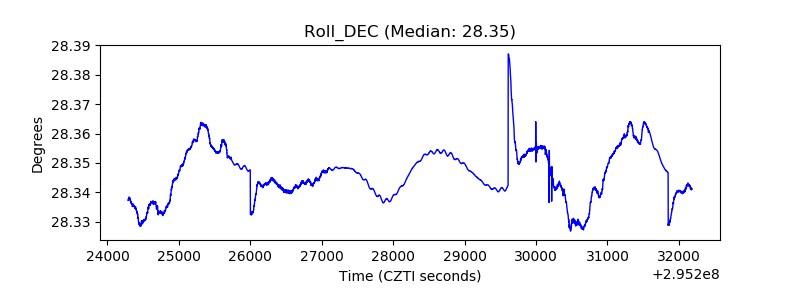 |
| _Roll_RA | 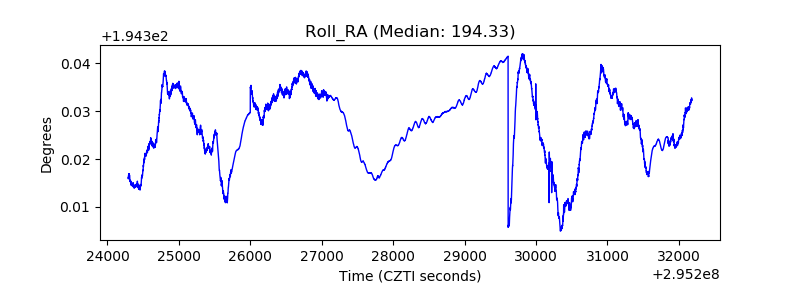 |
| Veto Counter | 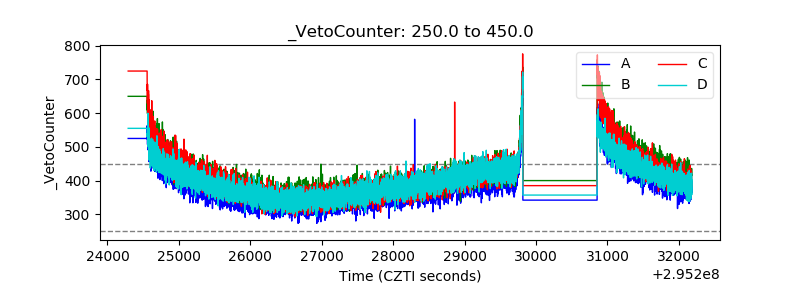 |