| Param | Original file | Final file |
|---|---|---|
| Filename | modeM0/AS1A05_115T02_9000002906_19554cztM0_level2.evt | modeM0/AS1A05_115T02_9000002906_19554cztM0_level2_quad_clean.evt |
| Size (bytes) | 492,742,080 | 69,883,200 |
| Size | 469.9 MB | 66.6 MB |
| Events in quadrant A | 3,276,874 | 434,147 |
| Events in quadrant B | 3,393,531 | 440,379 |
| Events in quadrant C | 3,321,775 | 410,627 |
| Events in quadrant D | 4,505,713 | 393,519 |
| Mode M0 | |||
|---|---|---|---|
| Quadrant | BADHDUFLAG | Total packets | Discarded packets |
| A | 0 | 13373 | 3 |
| B | 0 | 13762 | 2 |
| C | 0 | 13516 | 2 |
| D | 0 | 17518 | 2 |
| Mode M9 | |||
|---|---|---|---|
| Quadrant | BADHDUFLAG | Total packets | Discarded packets |
| A | 0 | 20 | 0 |
| B | 0 | 21 | 0 |
| C | 0 | 21 | 0 |
| D | 0 | 21 | 0 |
| Mode SS | |||
|---|---|---|---|
| Quadrant | BADHDUFLAG | Total packets | Discarded packets |
| A | 0 | 126 | 0 |
| B | 0 | 126 | 0 |
| C | 0 | 126 | 0 |
| D | 0 | 126 | 0 |
| Quadrant | Total seconds | Saturated seconds | Saturation percentage |
|---|---|---|---|
| A | 6269 | 20 | 0.319030% |
| B | 6269 | 54 | 0.861381% |
| C | 6269 | 46 | 0.733769% |
| D | 6269 | 150 | 2.392726% |
Noise dominated data is calculated using 1-second bins in cleaned event files. If a bin has >2000 counts, and if more than 50% of those come from <1% of pixels, then it is considered to be noise-dominated and hence unusable.
| Quadrant | # 1 sec bins | Bins with >0 counts | Bins with >2000 counts | High rate bins dominated by noise | Noise dominated (total time) | Noise dominated (detector-on time) | Marked lightcurve |
|---|---|---|---|---|---|---|---|
| A | 7599 | 6270 | 0 | 0 | 0.00% | 0.00% | 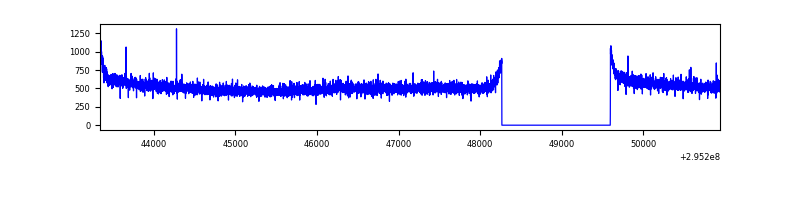 |
| B | 7599 | 6270 | 11 | 11 | 0.14% | 0.18% | 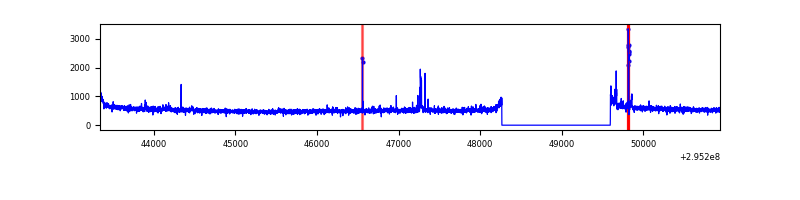 |
| C | 7599 | 6270 | 0 | 0 | 0.00% | 0.00% | 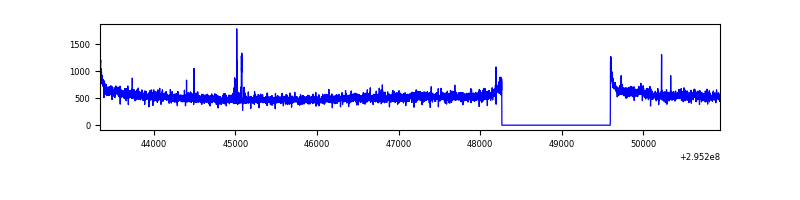 |
| D | 7599 | 6270 | 129 | 129 | 1.70% | 2.06% | 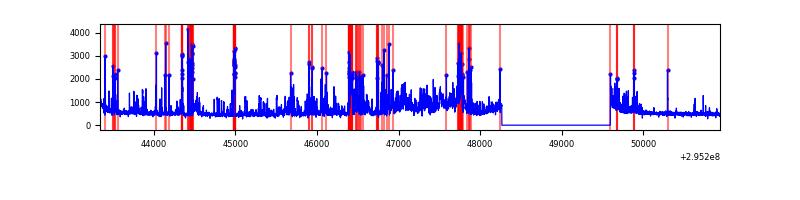 |
Top three noisy pixels from each quadrant. If the there are fewer than three noisy pixels in the level2.evt file, extra rows are filled as -1
| Pixel properties | Quadrant properties | ||||||
|---|---|---|---|---|---|---|---|
| Quadrant | DetID | PixID | Counts | Sigma | Mean | Median | Sigma |
| A | 13 | 254 | 8704 | 46.93 | 848 | 835 | 167.7 |
| A | 0 | 226 | 7454 | 39.48 | 848 | 835 | 167.7 |
| A | 15 | 191 | 6664 | 34.77 | 848 | 835 | 167.7 |
| B | 3 | 64 | 68179 | 430.15 | 841 | 822 | 156.6 |
| B | 12 | 111 | 18368 | 112.05 | 841 | 822 | 156.6 |
| B | 0 | 198 | 17045 | 103.6 | 841 | 822 | 156.6 |
| C | 14 | 238 | 127615 | 690.22 | 796 | 805 | 183.7 |
| C | 3 | 233 | 47282 | 252.97 | 796 | 805 | 183.7 |
| C | 9 | 221 | 25312 | 133.39 | 796 | 805 | 183.7 |
| D | 1 | 52 | 1054759 | 5413.16 | 801 | 780 | 194.7 |
| D | 7 | 238 | 150480 | 768.85 | 801 | 780 | 194.7 |
| D | 12 | 225 | 124115 | 633.44 | 801 | 780 | 194.7 |
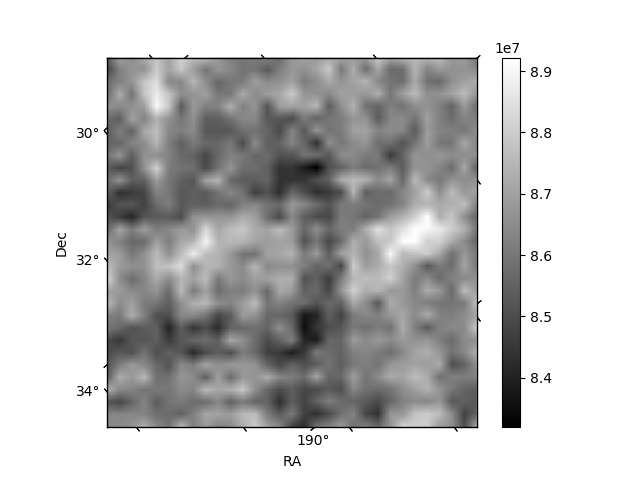
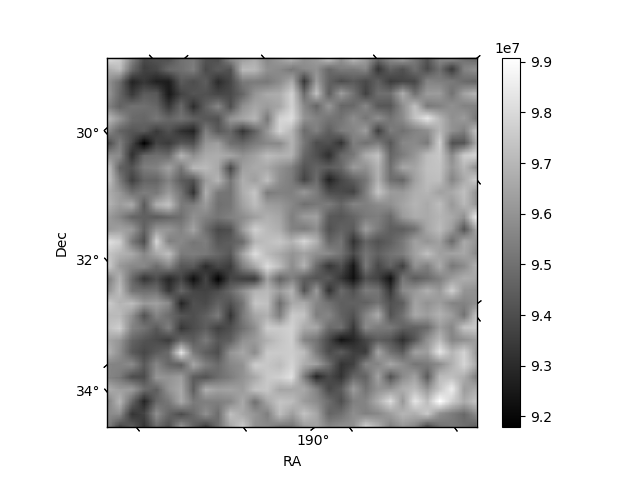
Histogram calculated using DETX and DETY for each event in the final _common_clean file
| Quadrant A |  |
 |
Quadrant B |
|---|---|---|---|
| Quadrant D |  |
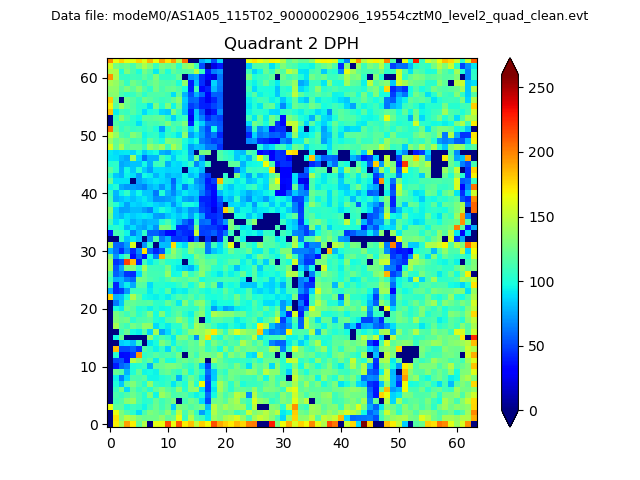 |
Quadrant C |
| Plot type | Count rate plots | Images |
|---|---|---|
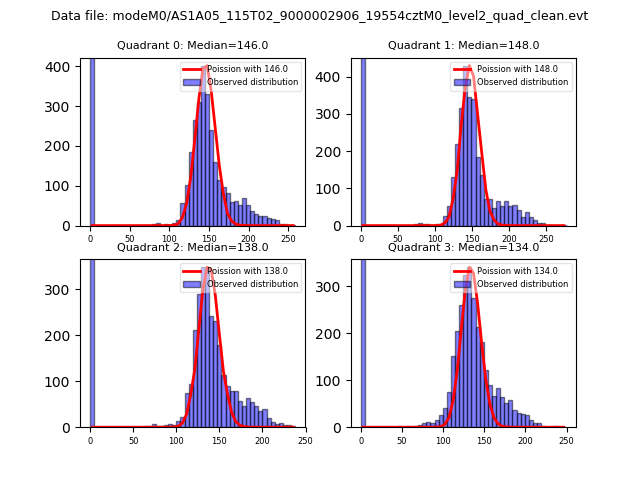
| Comparison with Poisson distribution Blue bars denote a histogram of data divided into 1 sec bins. Red curve is a Poisson curve with rate = median count rate of data. |
 |
 |
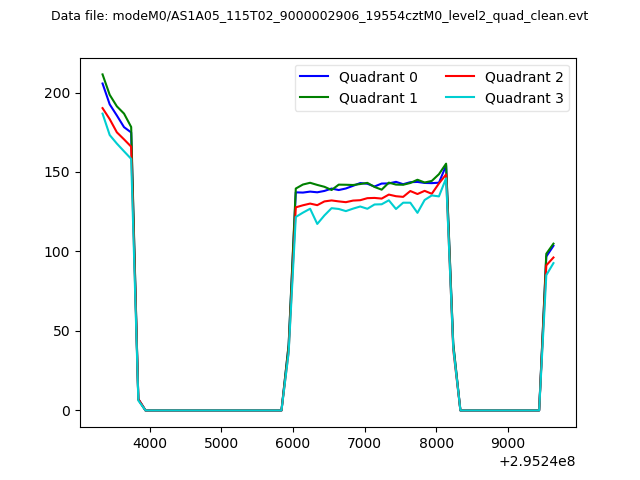
| Quadrant-wise count rates Data is divided into 100 sec bins |
 |
|
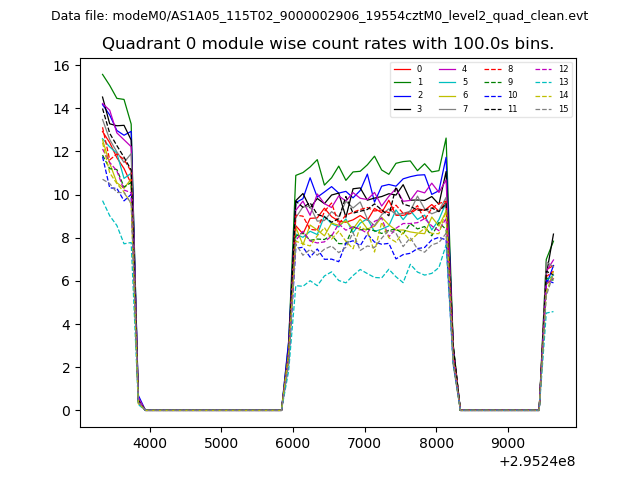
| Module-wise count rates for Quadrant A Data is divided into 100 sec bins |
 |
 |
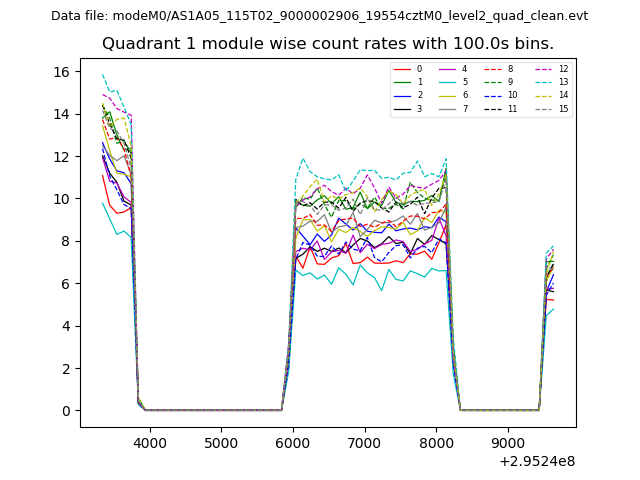
| Module-wise count rates for Quadrant B Data is divided into 100 sec bins |
 |
 |
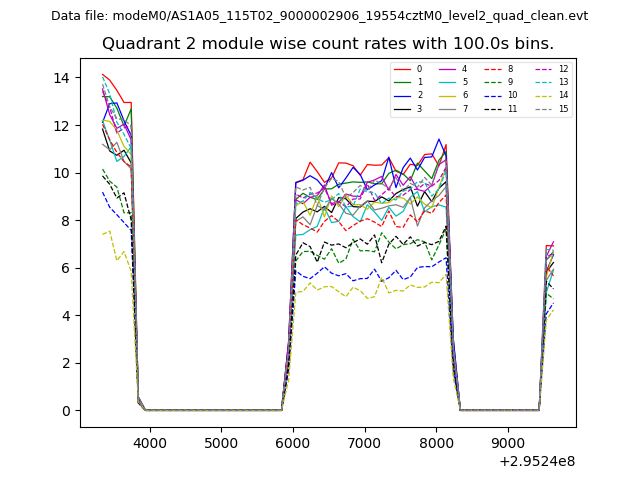
| Module-wise count rates for Quadrant C Data is divided into 100 sec bins |
 |
 |
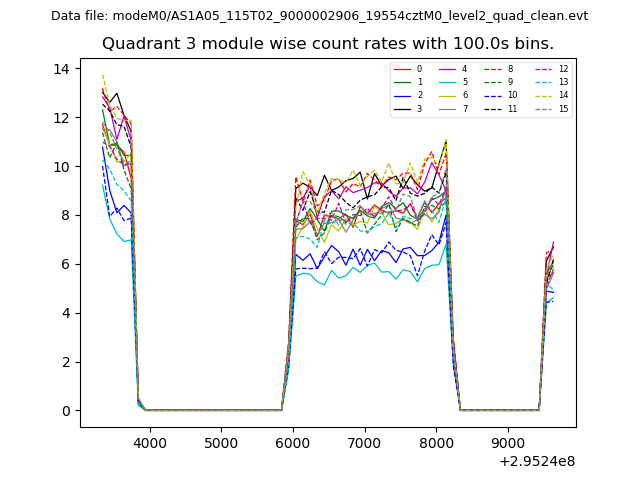
| Module-wise count rates for Quadrant D Data is divided into 100 sec bins |
 |
 |
| Parameter | Plot |
|---|---|
| CZT HV Monitor | 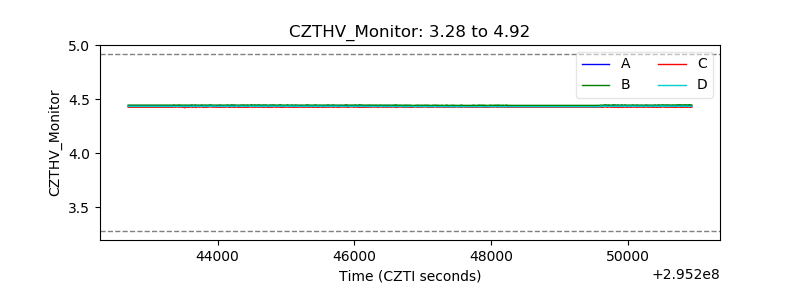 |
| D_VDD | 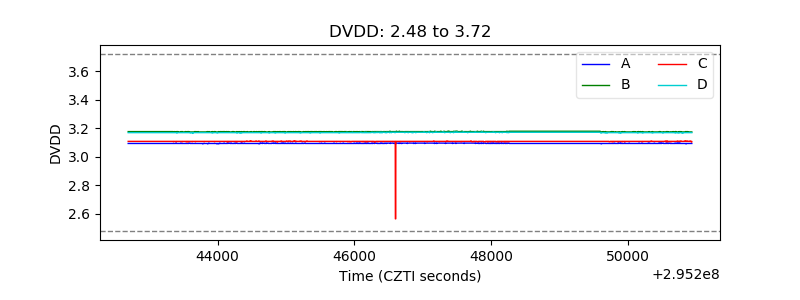 |
| Temperature 1 | 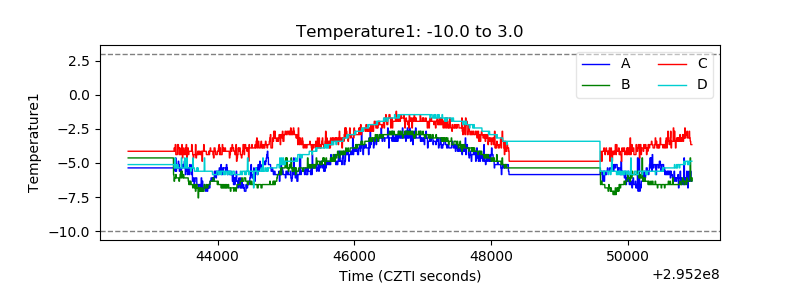 |
| Veto HV Monitor | 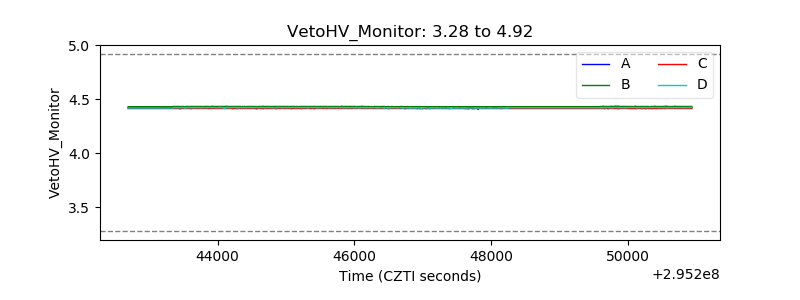 |
| Veto LLD |  |
| Alpha Counter | 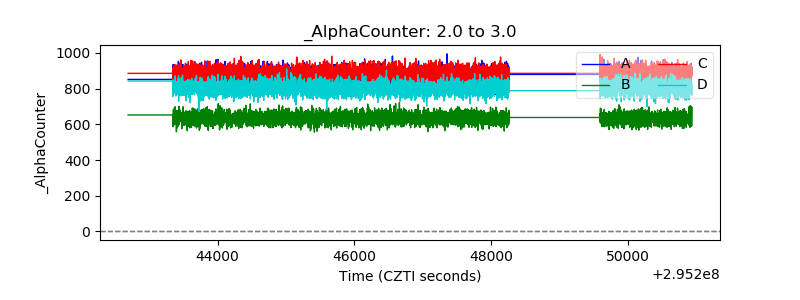 |
| _CPM_Rate | 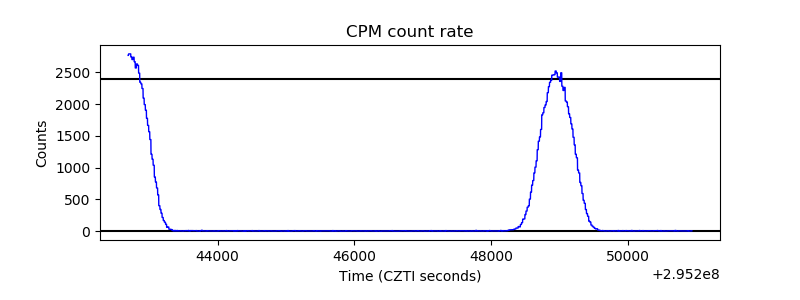 |
| CZT Counter | 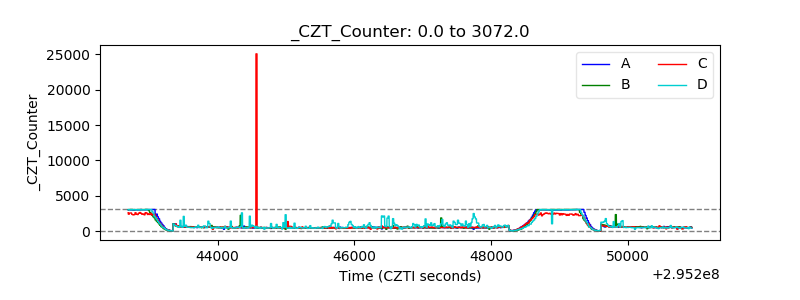 |
| +2.5 Volts monitor |  |
| +5 Volts monitor | 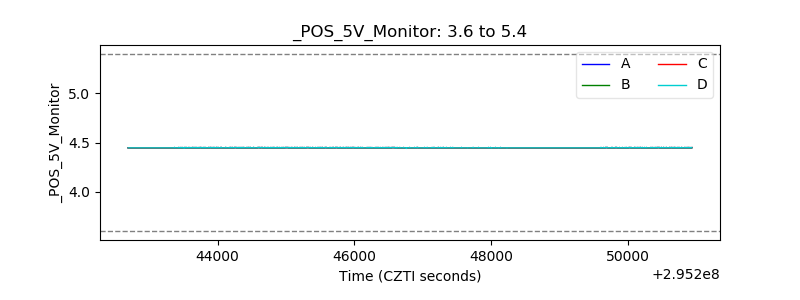 |
| _ROLL_ROT | 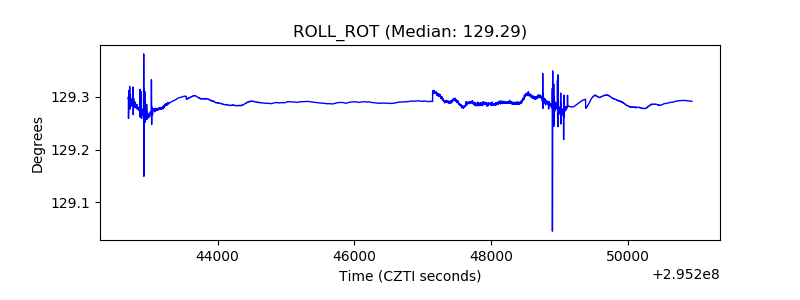 |
| _Roll_DEC | 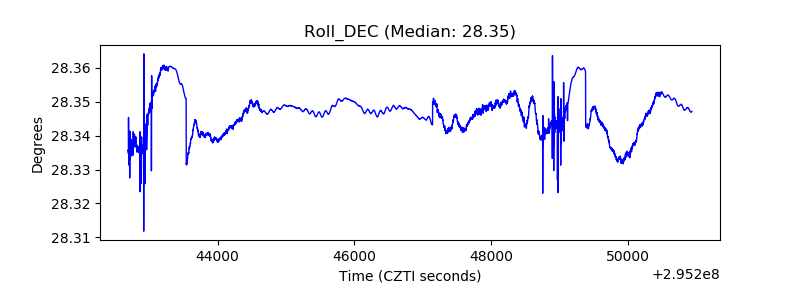 |
| _Roll_RA | 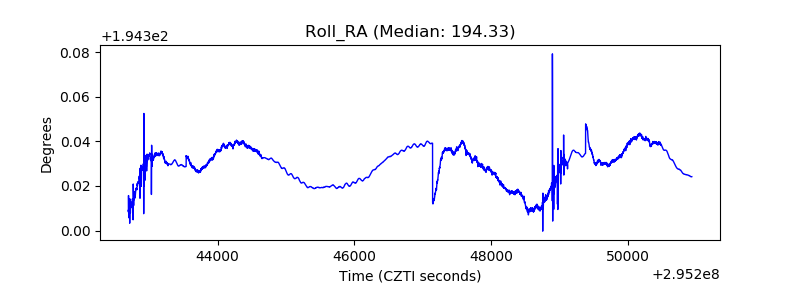 |
| Veto Counter | 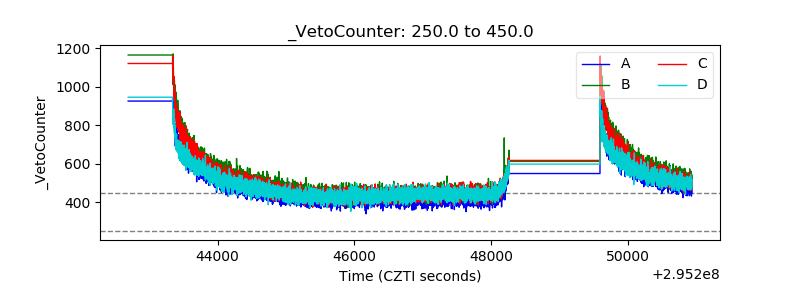 |