| Param | Original file | Final file |
|---|---|---|
| Filename | modeM0/AS1A05_115T02_9000002906_19555cztM0_level2.evt | modeM0/AS1A05_115T02_9000002906_19555cztM0_level2_quad_clean.evt |
| Size (bytes) | 486,826,560 | 66,836,160 |
| Size | 464.3 MB | 63.7 MB |
| Events in quadrant A | 3,451,385 | 405,668 |
| Events in quadrant B | 3,595,613 | 408,633 |
| Events in quadrant C | 3,504,910 | 380,898 |
| Events in quadrant D | 3,750,127 | 374,498 |
| Mode M0 | |||
|---|---|---|---|
| Quadrant | BADHDUFLAG | Total packets | Discarded packets |
| A | 0 | 13936 | 2 |
| B | 0 | 14416 | 2 |
| C | 0 | 14082 | 2 |
| D | 0 | 15148 | 2 |
| Mode M9 | |||
|---|---|---|---|
| Quadrant | BADHDUFLAG | Total packets | Discarded packets |
| A | 0 | 19 | 0 |
| B | 0 | 20 | 0 |
| C | 0 | 20 | 0 |
| D | 0 | 20 | 0 |
| Mode SS | |||
|---|---|---|---|
| Quadrant | BADHDUFLAG | Total packets | Discarded packets |
| A | 0 | 132 | 0 |
| B | 0 | 132 | 0 |
| C | 0 | 132 | 0 |
| D | 0 | 132 | 0 |
| Quadrant | Total seconds | Saturated seconds | Saturation percentage |
|---|---|---|---|
| A | 6506 | 53 | 0.814633% |
| B | 6506 | 96 | 1.475561% |
| C | 6506 | 77 | 1.183523% |
| D | 6506 | 75 | 1.152782% |
Noise dominated data is calculated using 1-second bins in cleaned event files. If a bin has >2000 counts, and if more than 50% of those come from <1% of pixels, then it is considered to be noise-dominated and hence unusable.
| Quadrant | # 1 sec bins | Bins with >0 counts | Bins with >2000 counts | High rate bins dominated by noise | Noise dominated (total time) | Noise dominated (detector-on time) | Marked lightcurve |
|---|---|---|---|---|---|---|---|
| A | 7831 | 6506 | 0 | 0 | 0.00% | 0.00% | 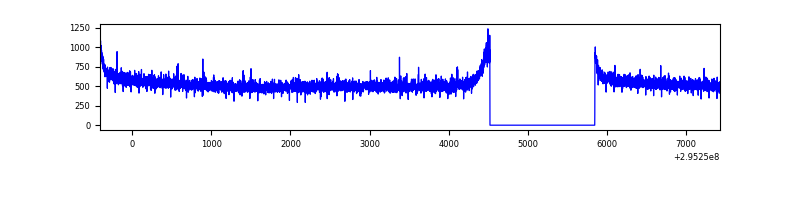 |
| B | 7831 | 6506 | 20 | 20 | 0.26% | 0.31% | 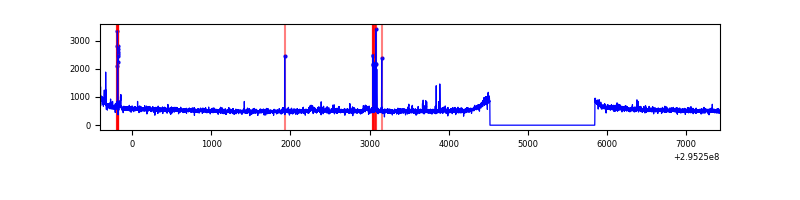 |
| C | 7831 | 6506 | 0 | 0 | 0.00% | 0.00% | 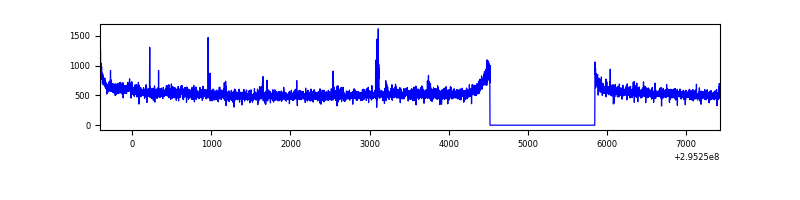 |
| D | 7831 | 6507 | 40 | 40 | 0.51% | 0.61% | 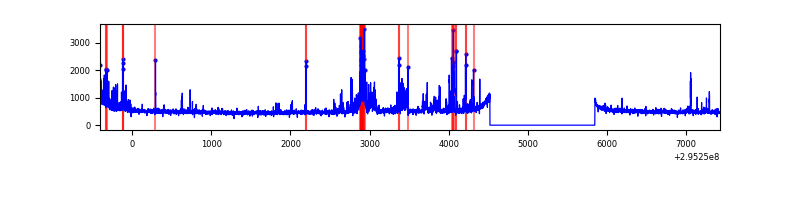 |
Top three noisy pixels from each quadrant. If the there are fewer than three noisy pixels in the level2.evt file, extra rows are filled as -1
| Pixel properties | Quadrant properties | ||||||
|---|---|---|---|---|---|---|---|
| Quadrant | DetID | PixID | Counts | Sigma | Mean | Median | Sigma |
| A | 13 | 254 | 9362 | 47.72 | 895 | 883 | 177.7 |
| A | 0 | 226 | 7821 | 39.05 | 895 | 883 | 177.7 |
| A | 3 | 137 | 6621 | 32.3 | 895 | 883 | 177.7 |
| B | 7 | 220 | 50183 | 298.82 | 886 | 867 | 165.0 |
| B | 3 | 64 | 45992 | 273.42 | 886 | 867 | 165.0 |
| B | 0 | 198 | 25115 | 146.92 | 886 | 867 | 165.0 |
| C | 14 | 238 | 135085 | 694.97 | 835 | 842 | 193.2 |
| C | 3 | 233 | 52681 | 268.37 | 835 | 842 | 193.2 |
| C | 9 | 221 | 28278 | 142.03 | 835 | 842 | 193.2 |
| D | 12 | 233 | 220584 | 1083.31 | 847 | 825 | 202.9 |
| D | 1 | 52 | 219354 | 1077.25 | 847 | 825 | 202.9 |
| D | 12 | 218 | 48708 | 236.04 | 847 | 825 | 202.9 |
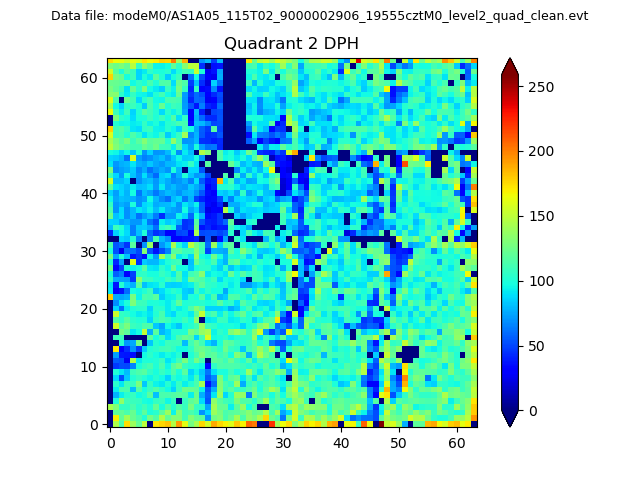
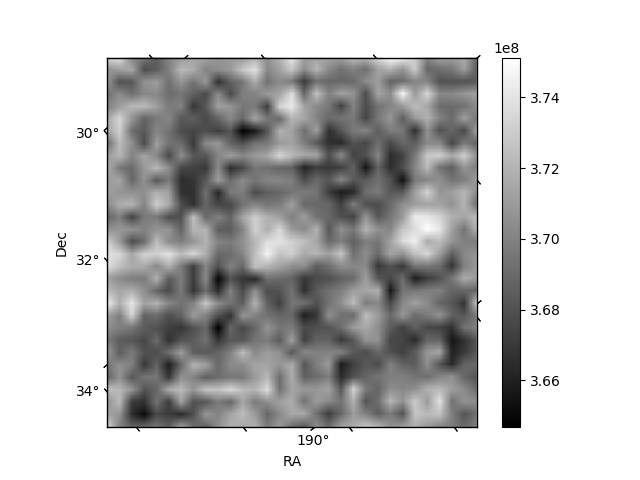
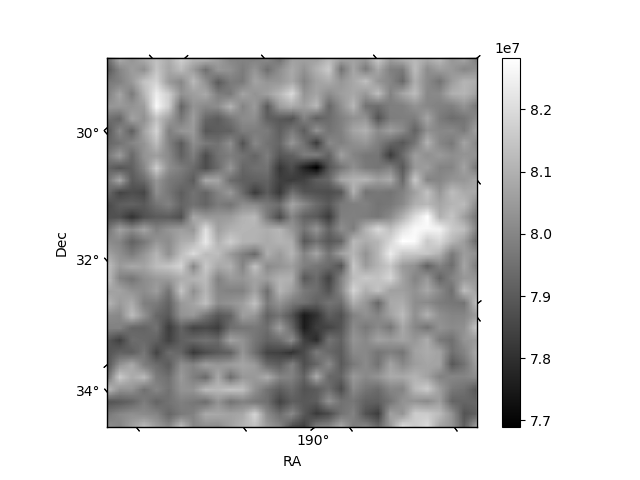
Histogram calculated using DETX and DETY for each event in the final _common_clean file
| Quadrant A | 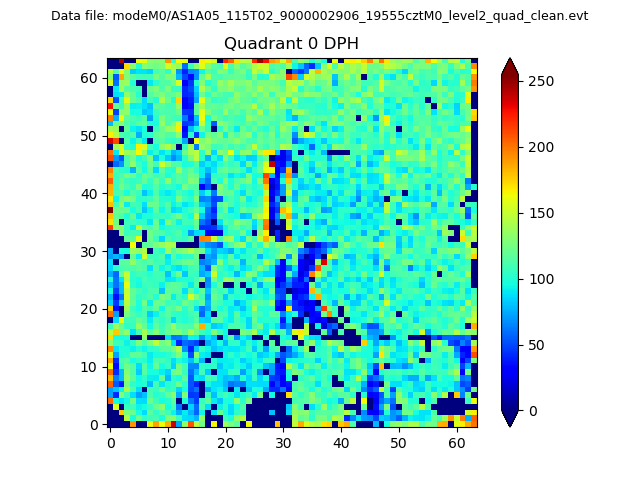 |
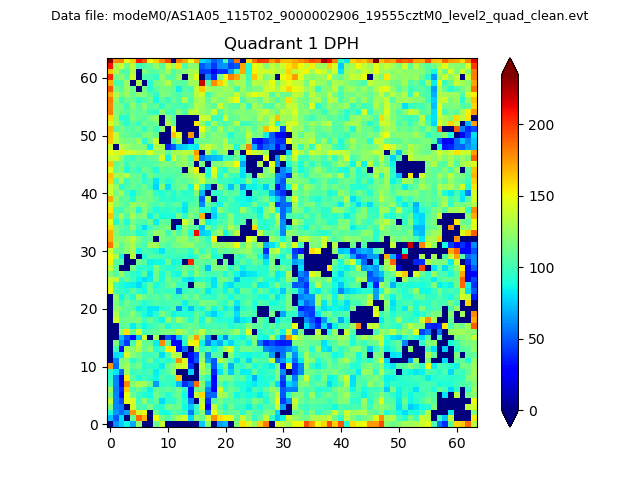 |
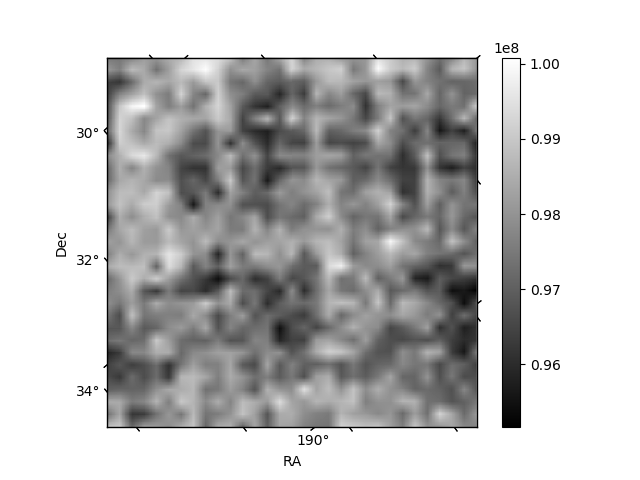
Quadrant B |
|---|---|---|---|
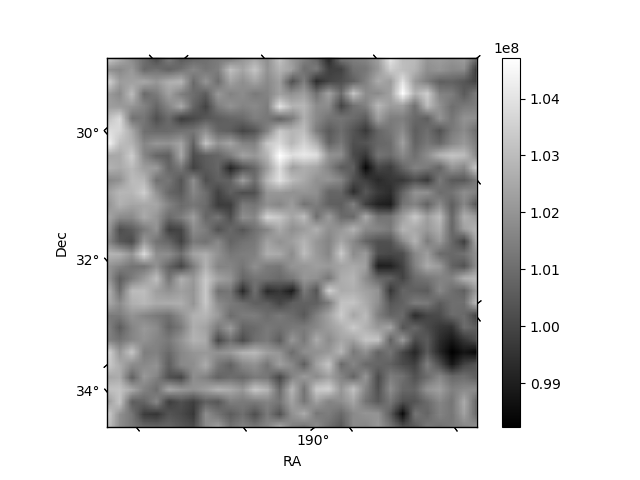
| Quadrant D | 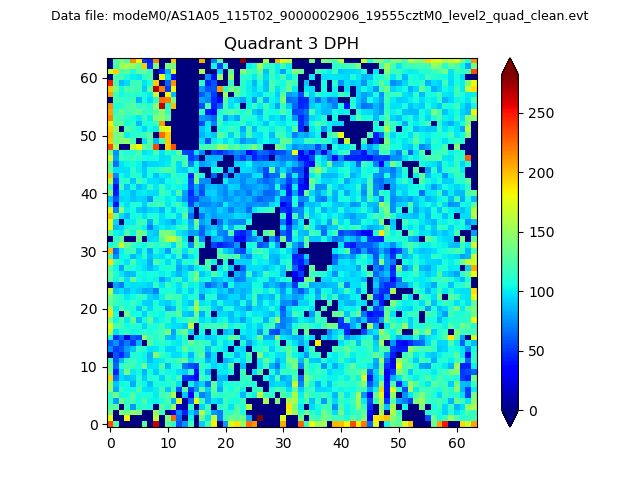 |
 |
Quadrant C |
| Plot type | Count rate plots | Images |
|---|---|---|
| Comparison with Poisson distribution Blue bars denote a histogram of data divided into 1 sec bins. Red curve is a Poisson curve with rate = median count rate of data. |
 |
 |
| Quadrant-wise count rates Data is divided into 100 sec bins |
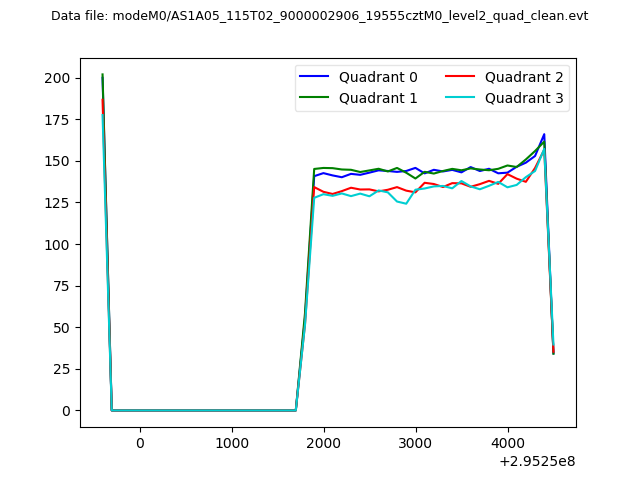 |
|
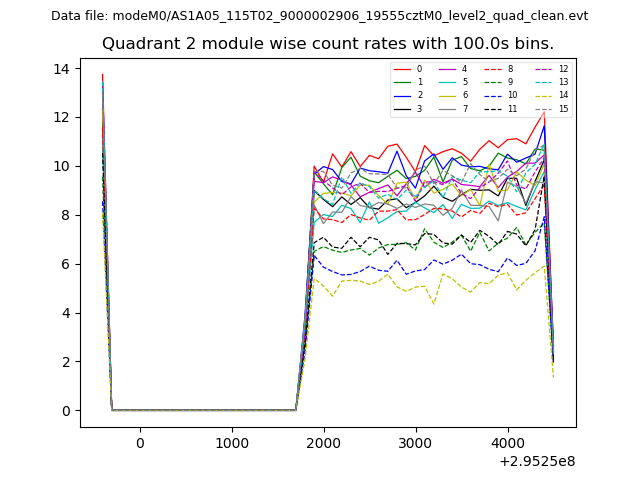
| Module-wise count rates for Quadrant A Data is divided into 100 sec bins |
 |
 |
| Module-wise count rates for Quadrant B Data is divided into 100 sec bins |
 |
 |
| Module-wise count rates for Quadrant C Data is divided into 100 sec bins |
 |
 |
| Module-wise count rates for Quadrant D Data is divided into 100 sec bins |
 |
 |
| Parameter | Plot |
|---|---|
| CZT HV Monitor |  |
| D_VDD | 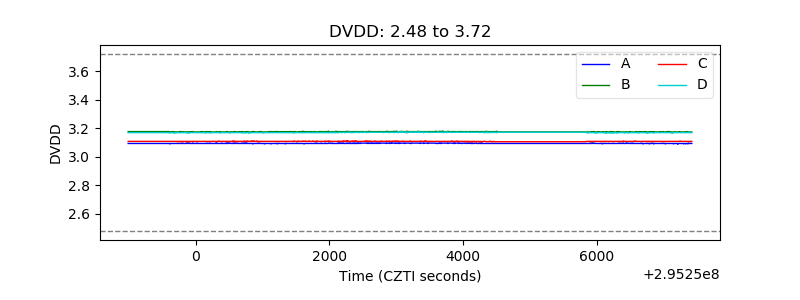 |
| Temperature 1 | 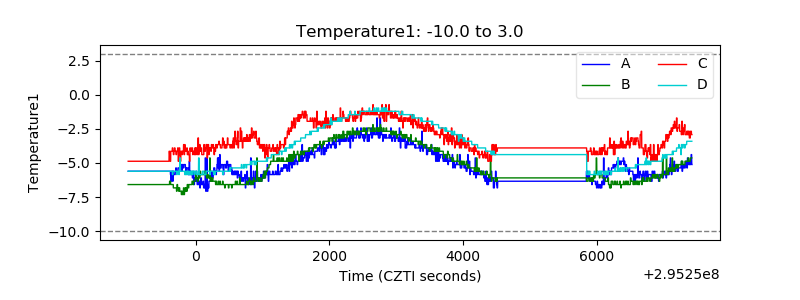 |
| Veto HV Monitor | 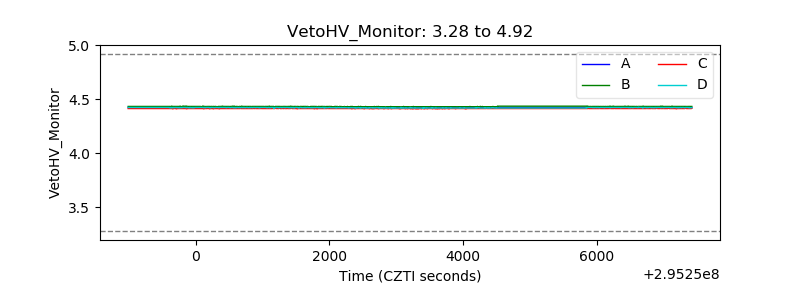 |
| Veto LLD | 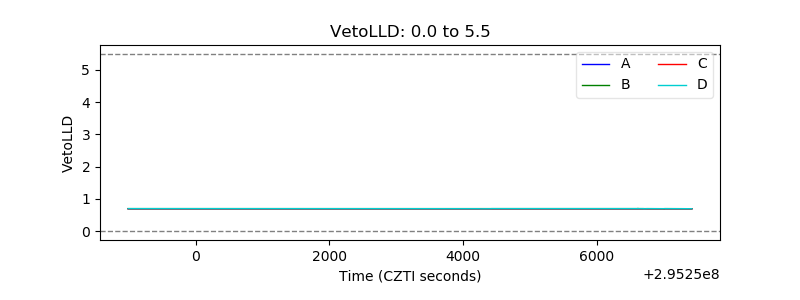 |
| Alpha Counter | 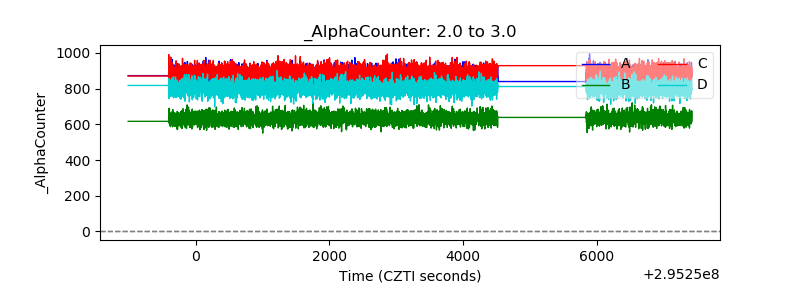 |
| _CPM_Rate | 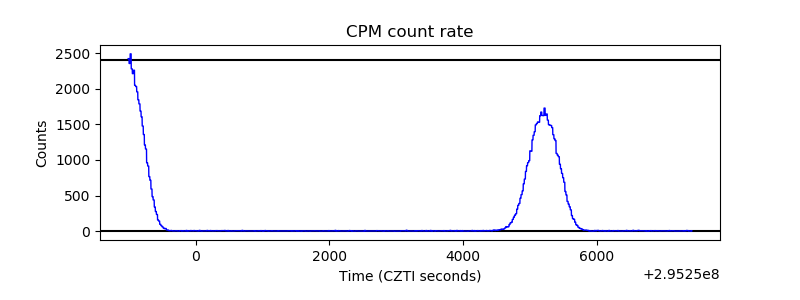 |
| CZT Counter | 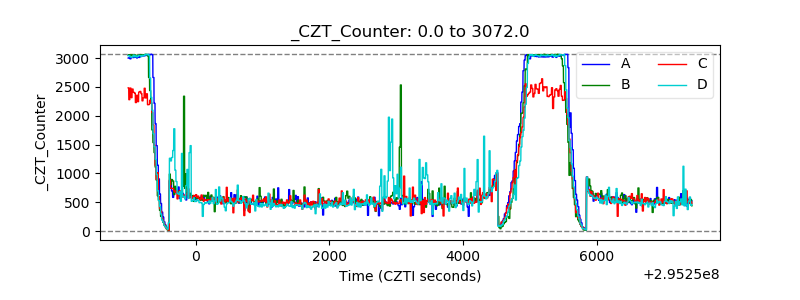 |
| +2.5 Volts monitor |  |
| +5 Volts monitor |  |
| _ROLL_ROT | 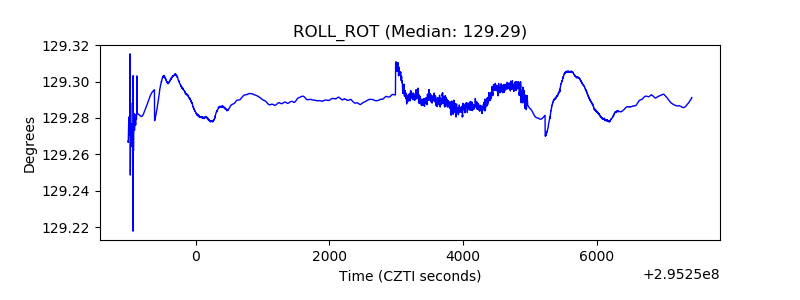 |
| _Roll_DEC | 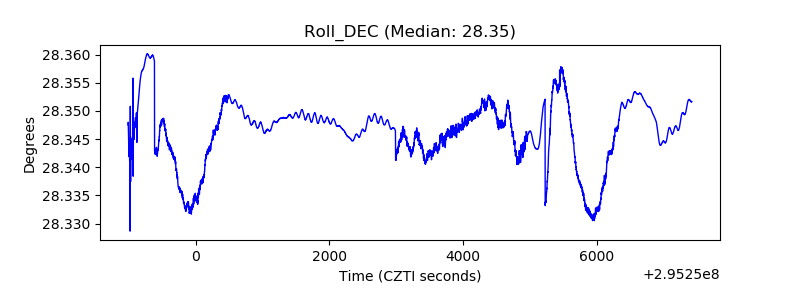 |
| _Roll_RA | 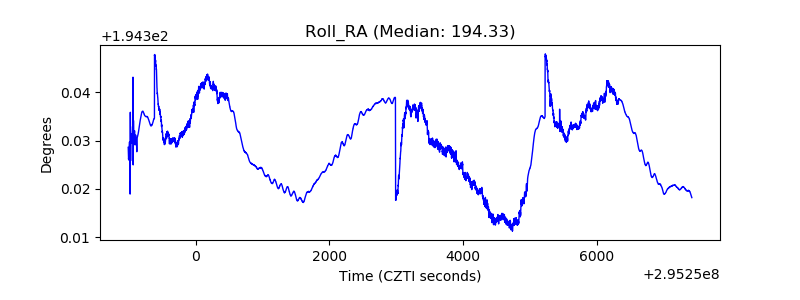 |
| Veto Counter |  |