| Param | Original file | Final file |
|---|---|---|
| Filename | modeM0/AS1A05_115T02_9000002906_19557cztM0_level2.evt | modeM0/AS1A05_115T02_9000002906_19557cztM0_level2_quad_clean.evt |
| Size (bytes) | 523,563,840 | 98,092,800 |
| Size | 499.3 MB | 93.5 MB |
| Events in quadrant A | 3,720,971 | 633,350 |
| Events in quadrant B | 3,891,684 | 635,555 |
| Events in quadrant C | 3,865,062 | 597,286 |
| Events in quadrant D | 3,881,747 | 595,434 |
| Mode M0 | |||
|---|---|---|---|
| Quadrant | BADHDUFLAG | Total packets | Discarded packets |
| A | 0 | 15420 | 3 |
| B | 0 | 15867 | 2 |
| C | 0 | 15728 | 2 |
| D | 0 | 16123 | 2 |
| Mode M9 | |||
|---|---|---|---|
| Quadrant | BADHDUFLAG | Total packets | Discarded packets |
| A | 0 | 22 | 0 |
| B | 0 | 22 | 0 |
| C | 0 | 22 | 0 |
| D | 0 | 22 | 0 |
| Mode SS | |||
|---|---|---|---|
| Quadrant | BADHDUFLAG | Total packets | Discarded packets |
| A | 0 | 150 | 0 |
| B | 0 | 150 | 0 |
| C | 0 | 150 | 0 |
| D | 0 | 150 | 0 |
| Quadrant | Total seconds | Saturated seconds | Saturation percentage |
|---|---|---|---|
| A | 7313 | 181 | 2.475044% |
| B | 7314 | 221 | 3.021602% |
| C | 7314 | 222 | 3.035275% |
| D | 7314 | 138 | 1.886792% |
Noise dominated data is calculated using 1-second bins in cleaned event files. If a bin has >2000 counts, and if more than 50% of those come from <1% of pixels, then it is considered to be noise-dominated and hence unusable.
| Quadrant | # 1 sec bins | Bins with >0 counts | Bins with >2000 counts | High rate bins dominated by noise | Noise dominated (total time) | Noise dominated (detector-on time) | Marked lightcurve |
|---|---|---|---|---|---|---|---|
| A | 9458 | 7313 | 0 | 0 | 0.00% | 0.00% | 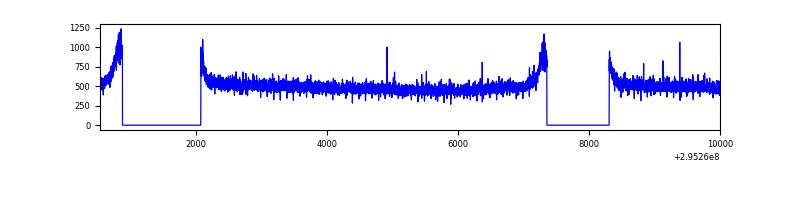 |
| B | 9459 | 7314 | 14 | 14 | 0.15% | 0.19% | 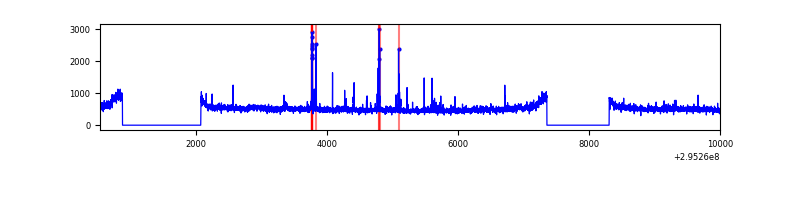 |
| C | 9459 | 7314 | 0 | 0 | 0.00% | 0.00% | 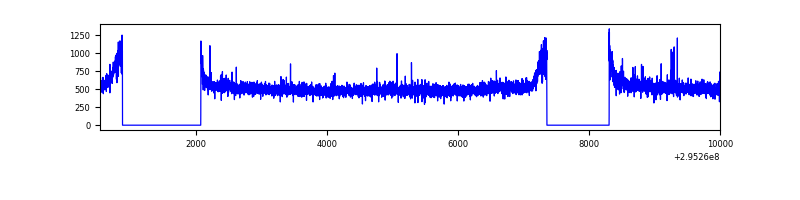 |
| D | 9459 | 7314 | 6 | 6 | 0.06% | 0.08% | 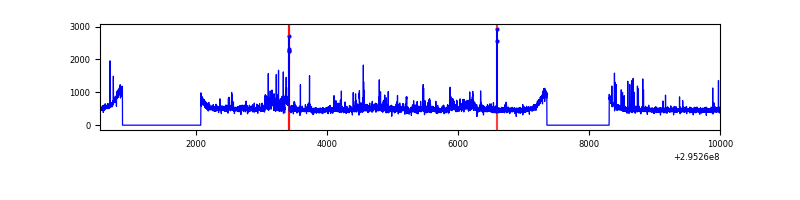 |
Top three noisy pixels from each quadrant. If the there are fewer than three noisy pixels in the level2.evt file, extra rows are filled as -1
| Pixel properties | Quadrant properties | ||||||
|---|---|---|---|---|---|---|---|
| Quadrant | DetID | PixID | Counts | Sigma | Mean | Median | Sigma |
| A | 13 | 254 | 10984 | 51.36 | 964 | 943 | 195.5 |
| A | 0 | 226 | 8367 | 37.97 | 964 | 943 | 195.5 |
| A | 3 | 137 | 7652 | 34.31 | 964 | 943 | 195.5 |
| B | 3 | 64 | 53984 | 290.35 | 951 | 927 | 182.7 |
| B | 0 | 198 | 39503 | 211.1 | 951 | 927 | 182.7 |
| B | 7 | 220 | 31102 | 165.13 | 951 | 927 | 182.7 |
| C | 3 | 233 | 161097 | 762.69 | 905 | 914 | 210.0 |
| C | 14 | 238 | 141527 | 669.51 | 905 | 914 | 210.0 |
| C | 7 | 247 | 21279 | 96.96 | 905 | 914 | 210.0 |
| D | 1 | 52 | 160174 | 703.74 | 929 | 904 | 226.3 |
| D | 2 | 16 | 116568 | 511.06 | 929 | 904 | 226.3 |
| D | 12 | 225 | 54248 | 235.7 | 929 | 904 | 226.3 |
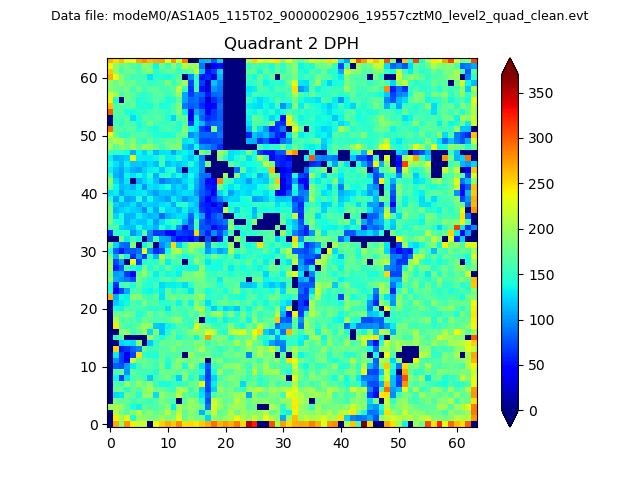
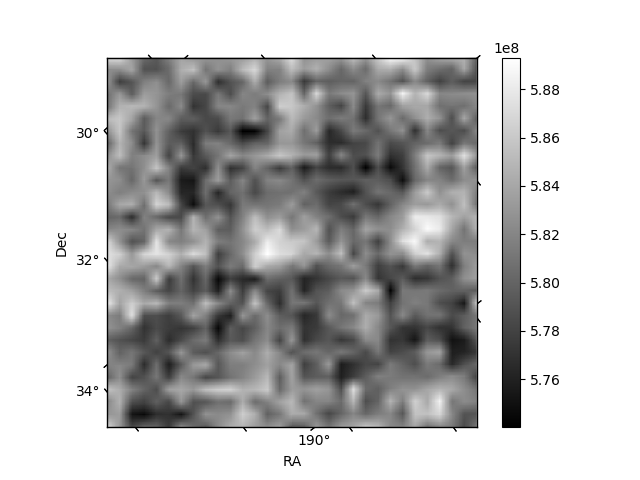
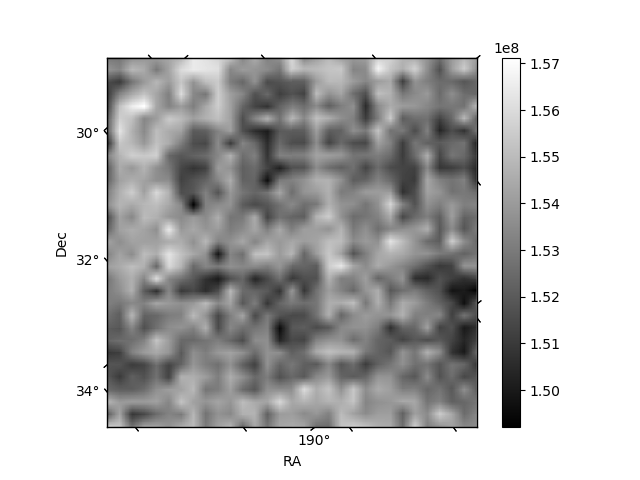
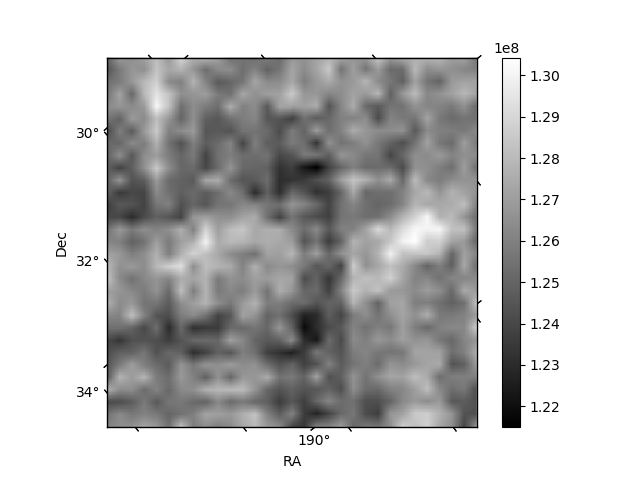
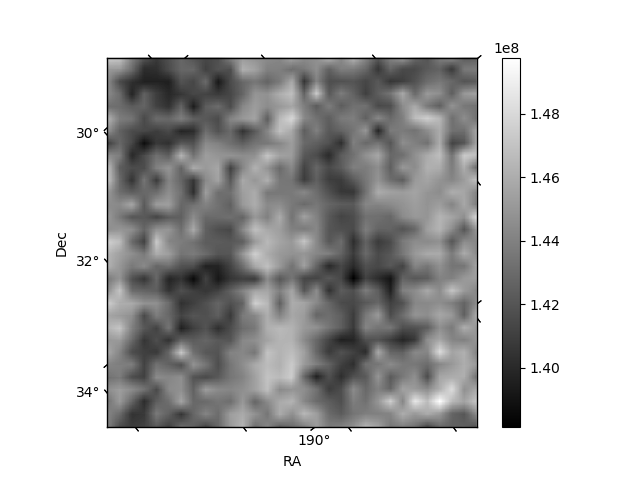
Histogram calculated using DETX and DETY for each event in the final _common_clean file
| Quadrant A | 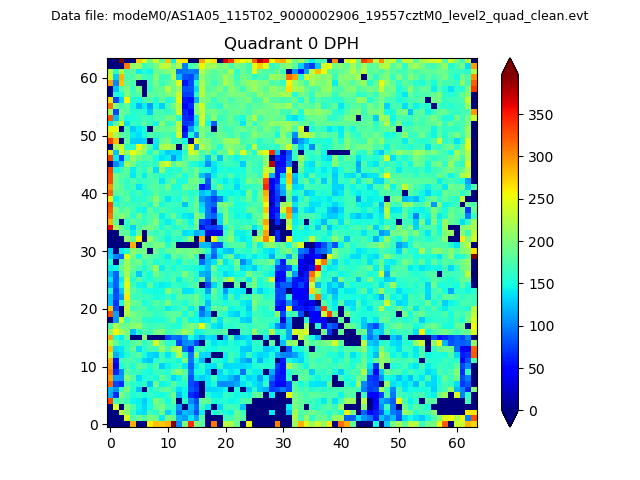 |
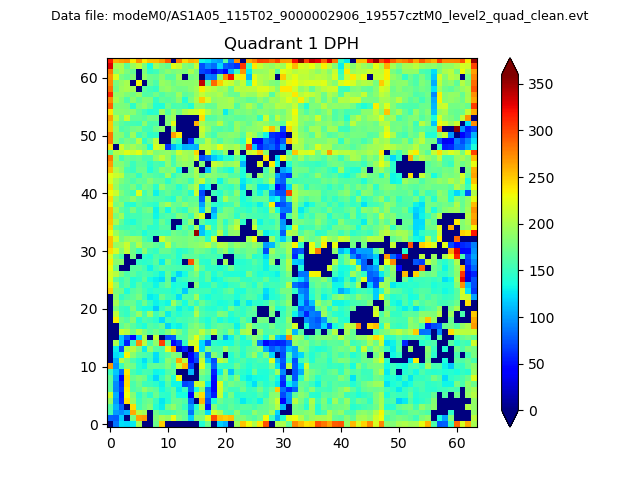 |
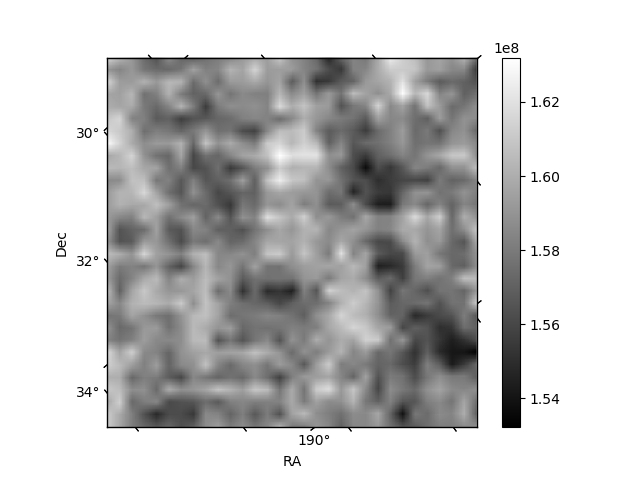
Quadrant B |
|---|---|---|---|
| Quadrant D | 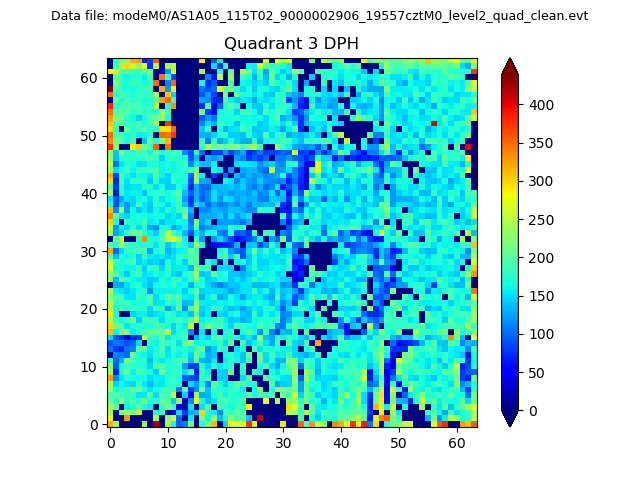 |
 |
Quadrant C |
| Plot type | Count rate plots | Images |
|---|---|---|
| Comparison with Poisson distribution Blue bars denote a histogram of data divided into 1 sec bins. Red curve is a Poisson curve with rate = median count rate of data. |
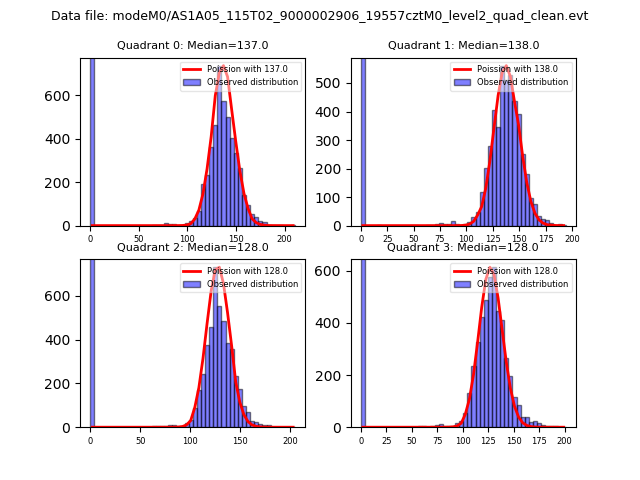 |
 |
| Quadrant-wise count rates Data is divided into 100 sec bins |
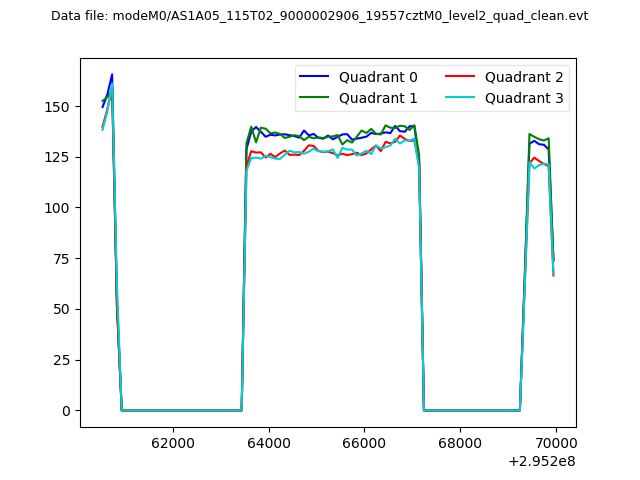 |
|
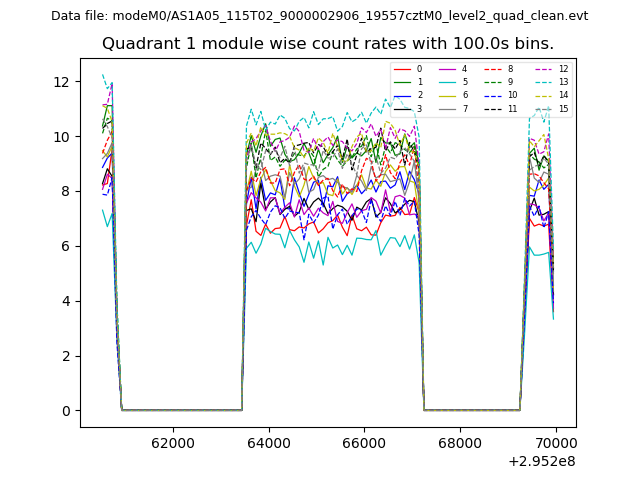
| Module-wise count rates for Quadrant A Data is divided into 100 sec bins |
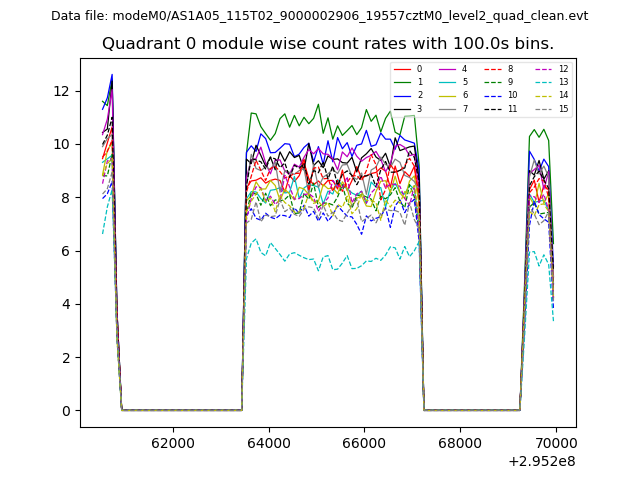 |
 |
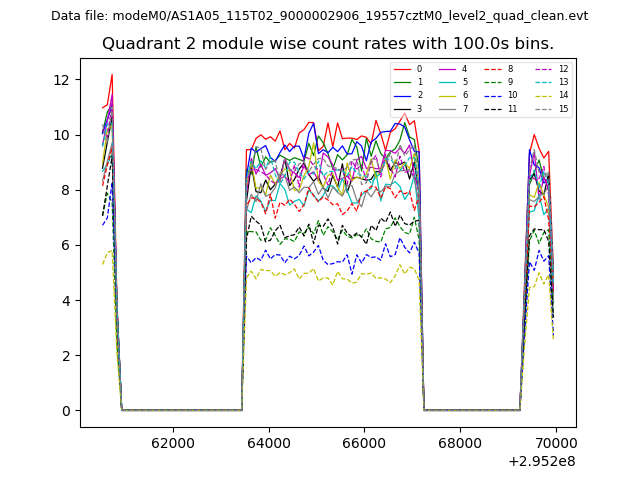
| Module-wise count rates for Quadrant B Data is divided into 100 sec bins |
 |
 |
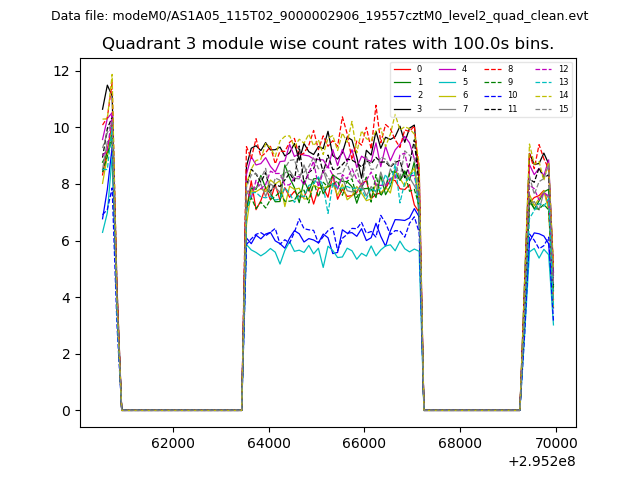
| Module-wise count rates for Quadrant C Data is divided into 100 sec bins |
 |
 |
| Module-wise count rates for Quadrant D Data is divided into 100 sec bins |
 |
 |
| Parameter | Plot |
|---|---|
| CZT HV Monitor | 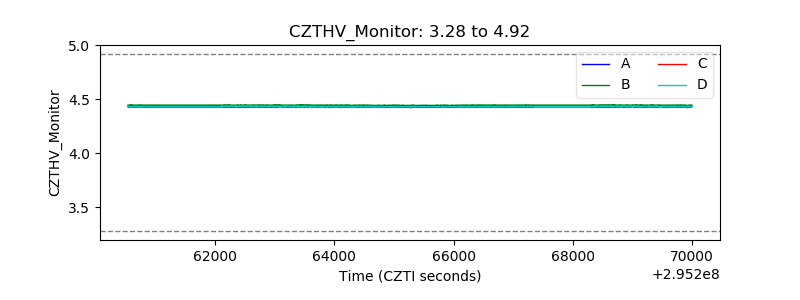 |
| D_VDD | 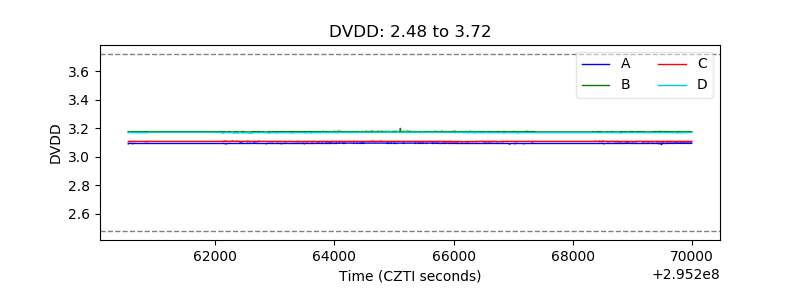 |
| Temperature 1 | 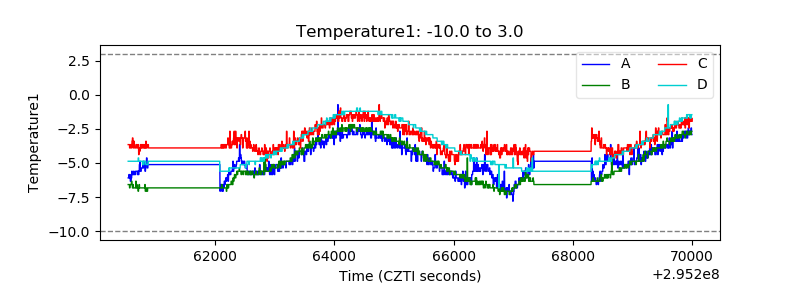 |
| Veto HV Monitor | 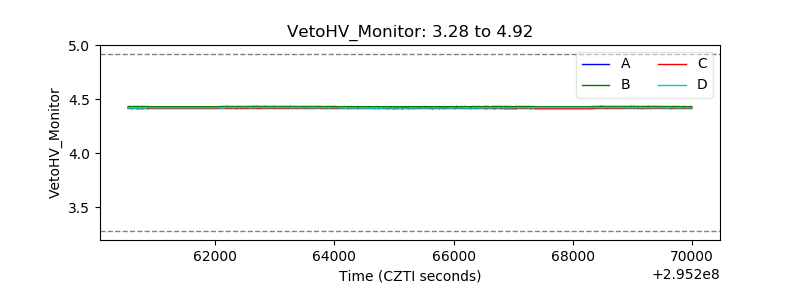 |
| Veto LLD | 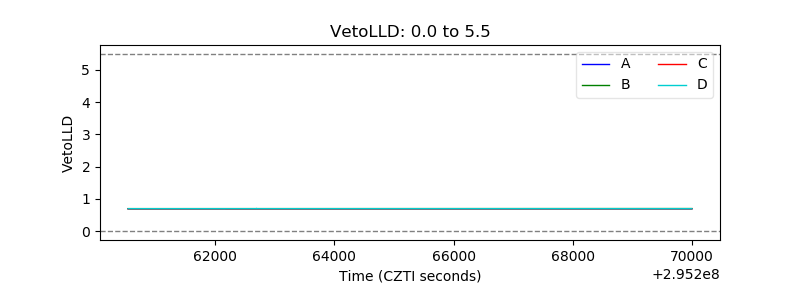 |
| Alpha Counter | 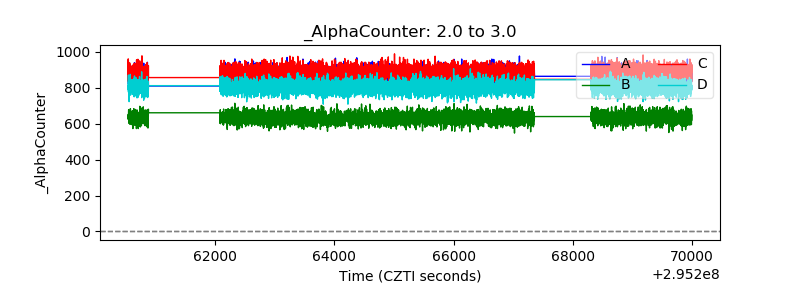 |
| _CPM_Rate | 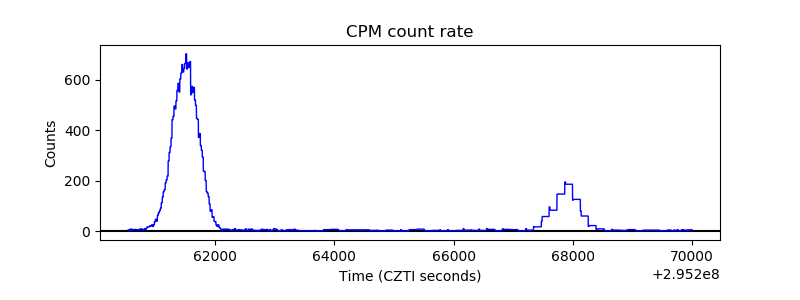 |
| CZT Counter | 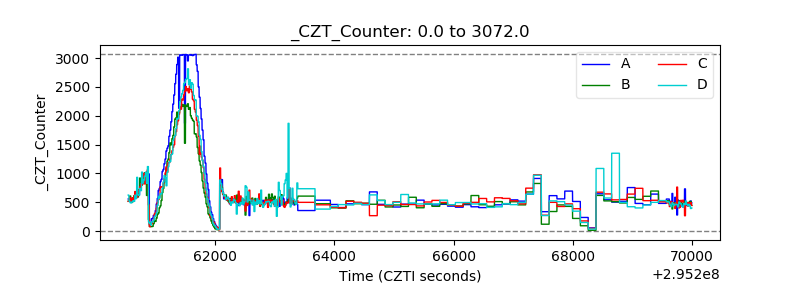 |
| +2.5 Volts monitor |  |
| +5 Volts monitor |  |
| _ROLL_ROT | 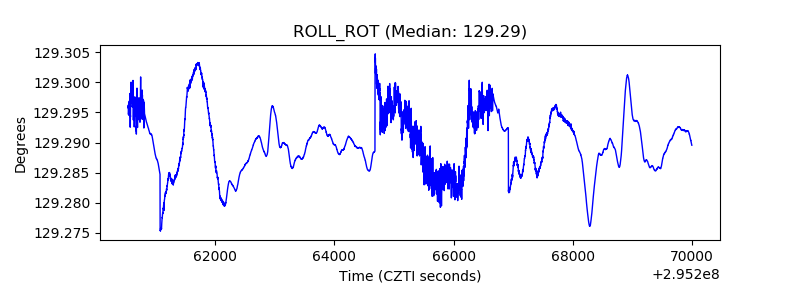 |
| _Roll_DEC | 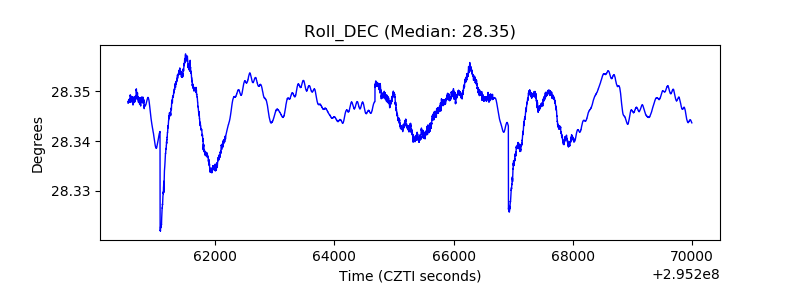 |
| _Roll_RA | 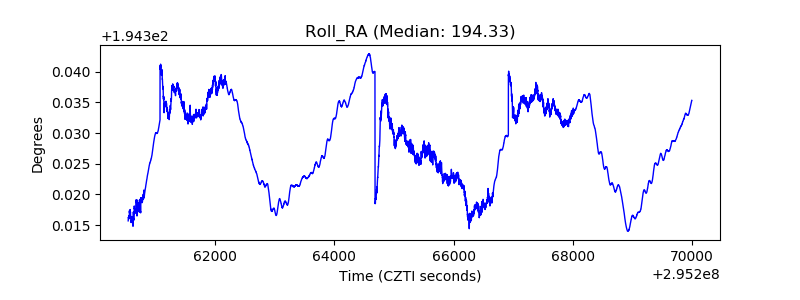 |
| Veto Counter | 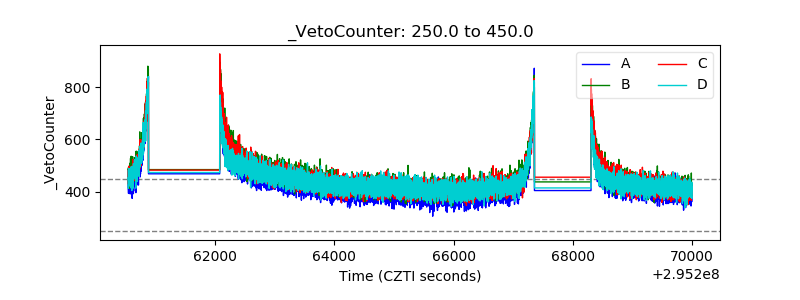 |