| Param | Original file | Final file |
|---|---|---|
| Filename | modeM0/AS1A05_115T02_9000002906_19558cztM0_level2.evt | modeM0/AS1A05_115T02_9000002906_19558cztM0_level2_quad_clean.evt |
| Size (bytes) | 522,066,240 | 93,551,040 |
| Size | 497.9 MB | 89.2 MB |
| Events in quadrant A | 3,542,333 | 596,048 |
| Events in quadrant B | 3,669,279 | 600,760 |
| Events in quadrant C | 3,851,726 | 567,289 |
| Events in quadrant D | 4,247,006 | 556,095 |
| Mode M0 | |||
|---|---|---|---|
| Quadrant | BADHDUFLAG | Total packets | Discarded packets |
| A | 0 | 15196 | 2 |
| B | 0 | 15406 | 2 |
| C | 0 | 15730 | 2 |
| D | 0 | 17587 | 2 |
| Mode M9 | |||
|---|---|---|---|
| Quadrant | BADHDUFLAG | Total packets | Discarded packets |
| A | 0 | 12 | 0 |
| B | 0 | 13 | 0 |
| C | 0 | 13 | 0 |
| D | 0 | 13 | 0 |
| Mode SS | |||
|---|---|---|---|
| Quadrant | BADHDUFLAG | Total packets | Discarded packets |
| A | 0 | 150 | 0 |
| B | 0 | 150 | 0 |
| C | 0 | 150 | 0 |
| D | 0 | 150 | 0 |
| Quadrant | Total seconds | Saturated seconds | Saturation percentage |
|---|---|---|---|
| A | 7367 | 144 | 1.954663% |
| B | 7366 | 178 | 2.416508% |
| C | 7366 | 183 | 2.484388% |
| D | 7366 | 236 | 3.203910% |
Noise dominated data is calculated using 1-second bins in cleaned event files. If a bin has >2000 counts, and if more than 50% of those come from <1% of pixels, then it is considered to be noise-dominated and hence unusable.
| Quadrant | # 1 sec bins | Bins with >0 counts | Bins with >2000 counts | High rate bins dominated by noise | Noise dominated (total time) | Noise dominated (detector-on time) | Marked lightcurve |
|---|---|---|---|---|---|---|---|
| A | 7887 | 7367 | 0 | 0 | 0.00% | 0.00% | 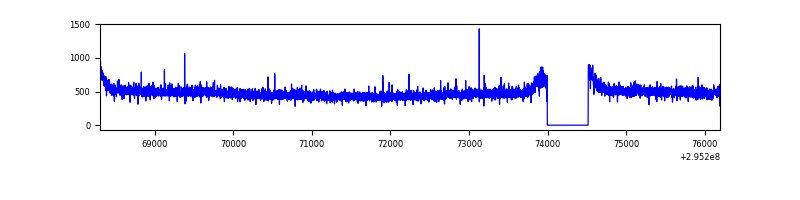 |
| B | 7886 | 7366 | 1 | 1 | 0.01% | 0.01% | 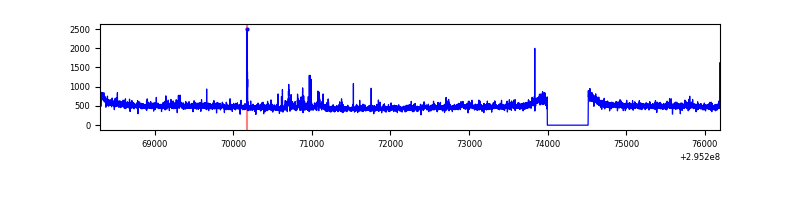 |
| C | 7886 | 7366 | 0 | 0 | 0.00% | 0.00% | 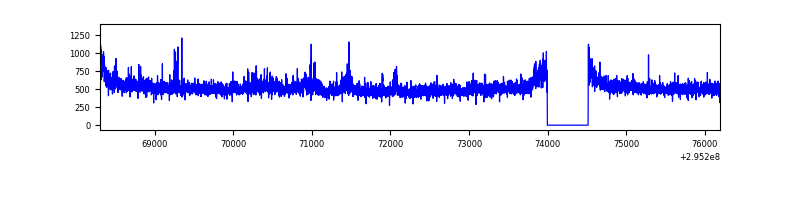 |
| D | 7886 | 7366 | 97 | 97 | 1.23% | 1.32% | 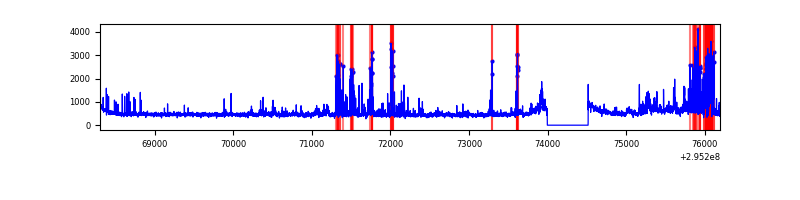 |
Top three noisy pixels from each quadrant. If the there are fewer than three noisy pixels in the level2.evt file, extra rows are filled as -1
| Pixel properties | Quadrant properties | ||||||
|---|---|---|---|---|---|---|---|
| Quadrant | DetID | PixID | Counts | Sigma | Mean | Median | Sigma |
| A | 15 | 191 | 11473 | 57.26 | 915 | 895 | 184.7 |
| A | 13 | 254 | 10848 | 53.88 | 915 | 895 | 184.7 |
| A | 0 | 226 | 7888 | 37.85 | 915 | 895 | 184.7 |
| B | 0 | 198 | 43573 | 246.81 | 904 | 880 | 173.0 |
| B | 7 | 220 | 42644 | 241.44 | 904 | 880 | 173.0 |
| B | 12 | 111 | 21369 | 118.45 | 904 | 880 | 173.0 |
| C | 3 | 233 | 277758 | 1372.37 | 868 | 875 | 201.8 |
| C | 14 | 238 | 135752 | 668.52 | 868 | 875 | 201.8 |
| C | 7 | 247 | 28940 | 139.1 | 868 | 875 | 201.8 |
| D | 12 | 233 | 520762 | 2439.17 | 878 | 853 | 213.2 |
| D | 7 | 238 | 208341 | 973.43 | 878 | 853 | 213.2 |
| D | 12 | 225 | 78990 | 366.58 | 878 | 853 | 213.2 |
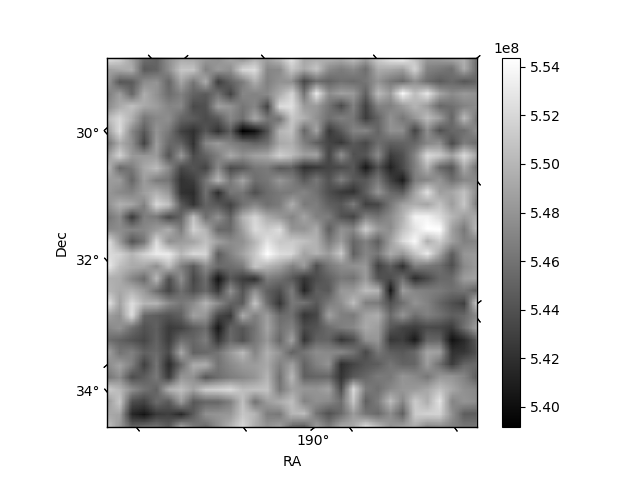
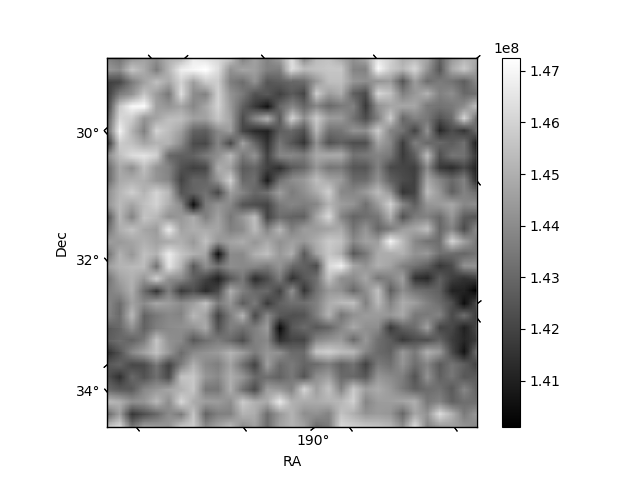
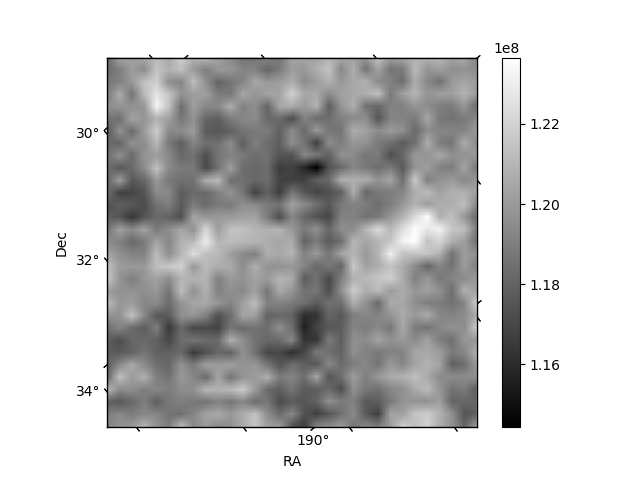
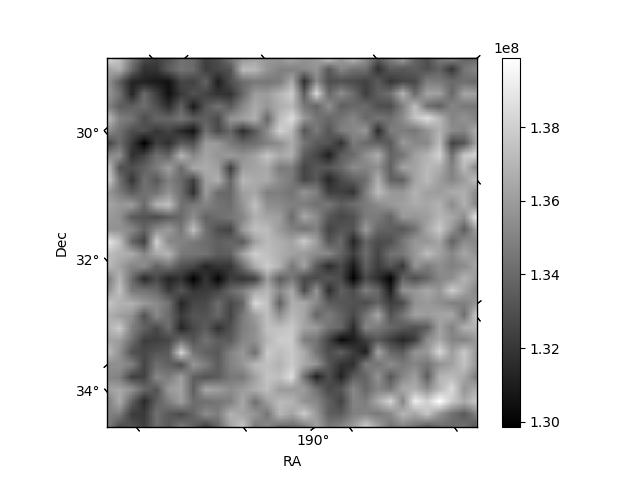
Histogram calculated using DETX and DETY for each event in the final _common_clean file
| Quadrant A | 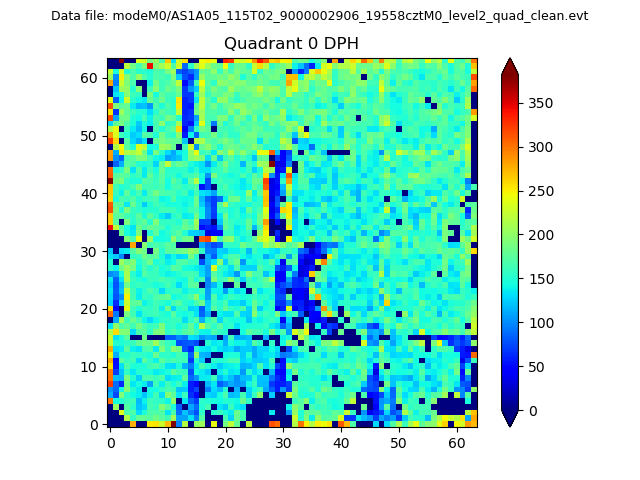 |
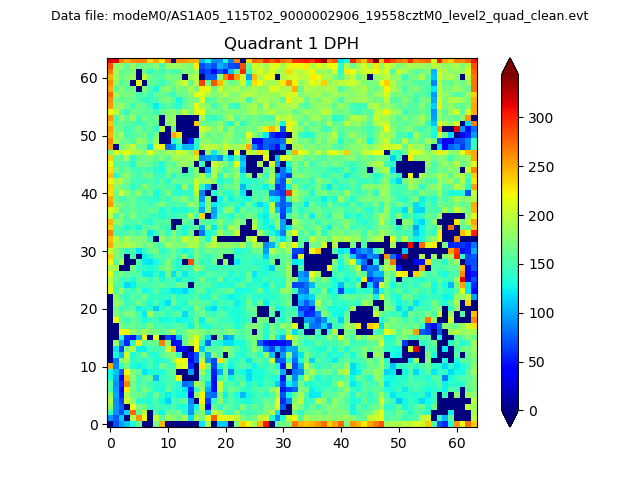 |
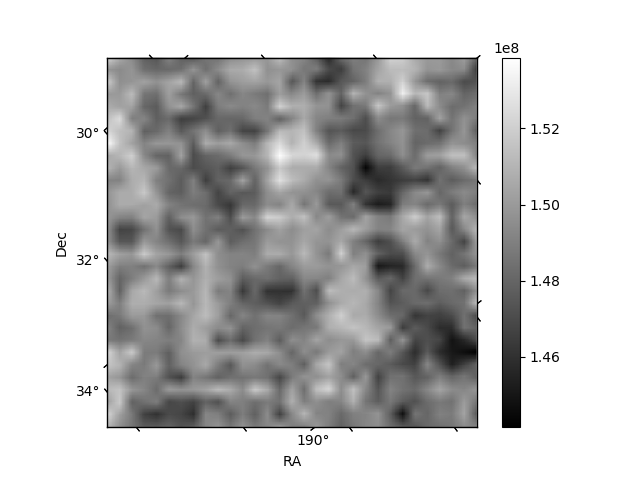
Quadrant B |
|---|---|---|---|
| Quadrant D | 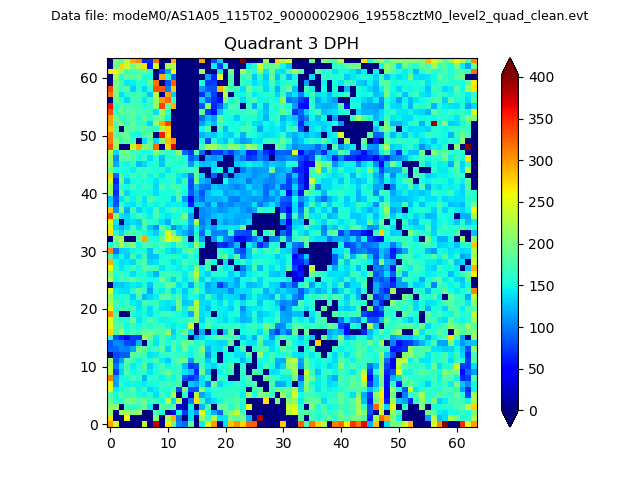 |
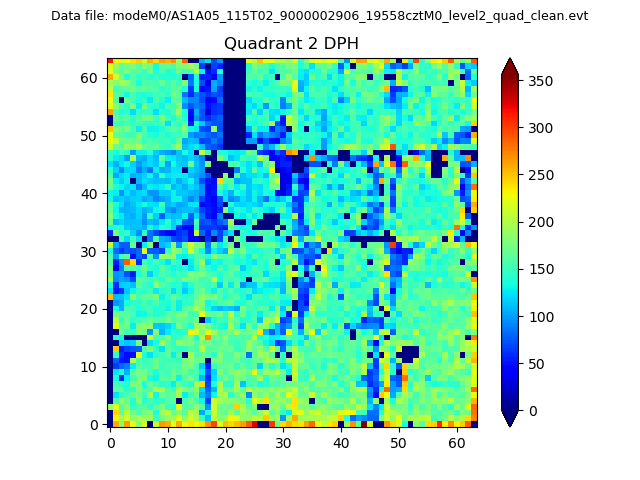 |
Quadrant C |
| Plot type | Count rate plots | Images |
|---|---|---|
| Comparison with Poisson distribution Blue bars denote a histogram of data divided into 1 sec bins. Red curve is a Poisson curve with rate = median count rate of data. |
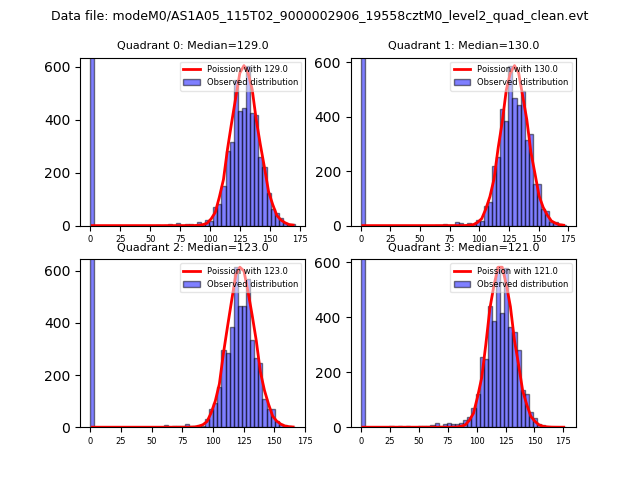 |
 |
| Quadrant-wise count rates Data is divided into 100 sec bins |
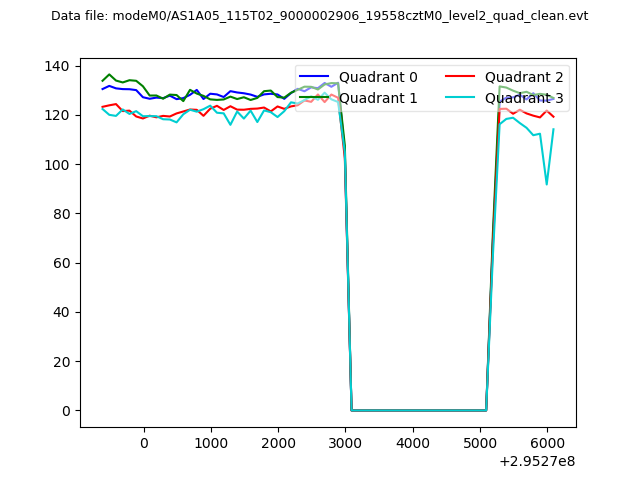 |
|
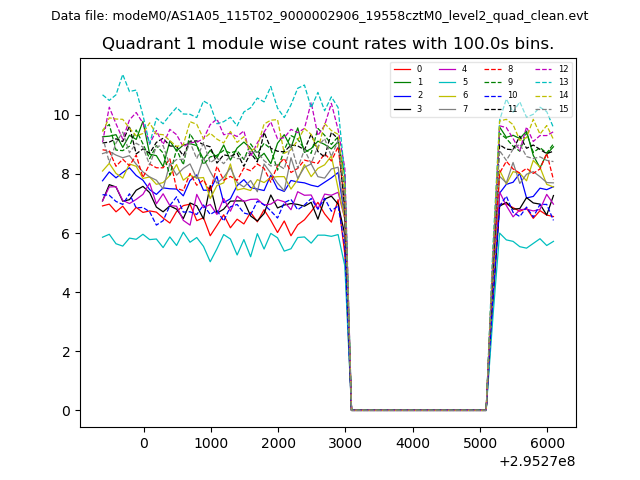
| Module-wise count rates for Quadrant A Data is divided into 100 sec bins |
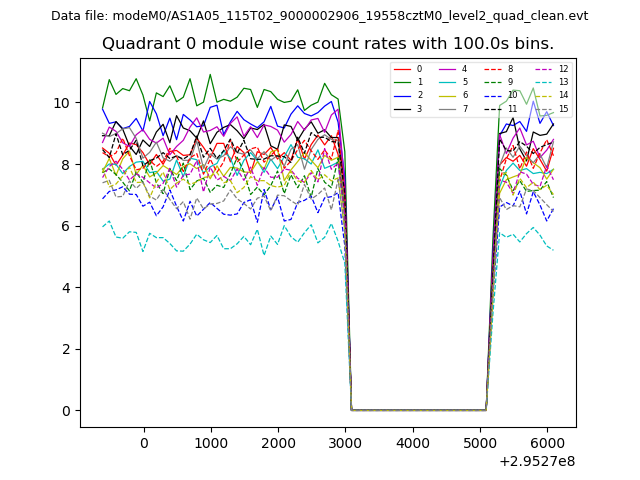 |
 |
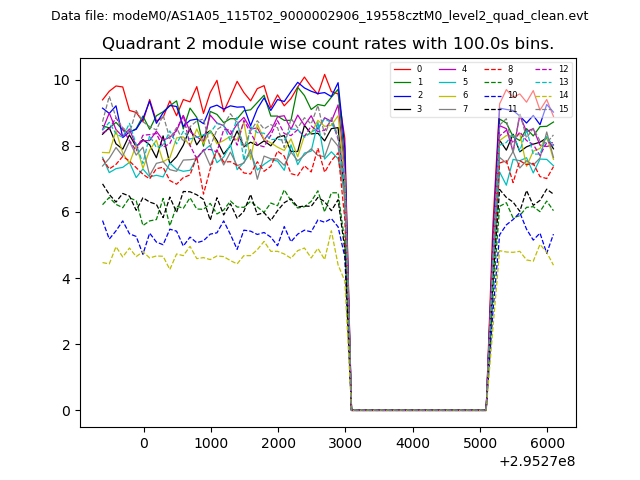
| Module-wise count rates for Quadrant B Data is divided into 100 sec bins |
 |
 |
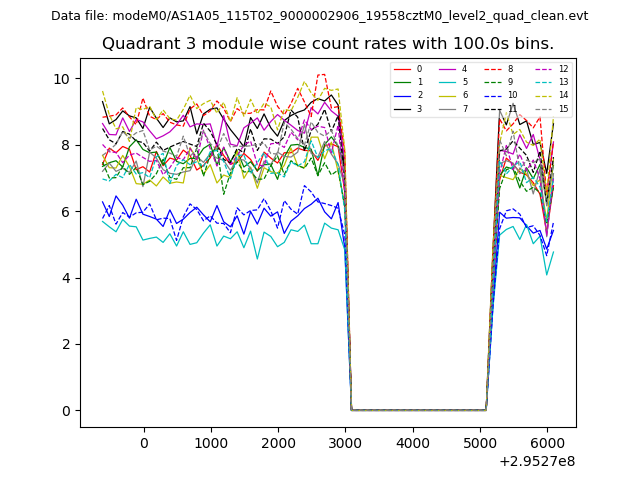
| Module-wise count rates for Quadrant C Data is divided into 100 sec bins |
 |
 |
| Module-wise count rates for Quadrant D Data is divided into 100 sec bins |
 |
 |
| Parameter | Plot |
|---|---|
| CZT HV Monitor | 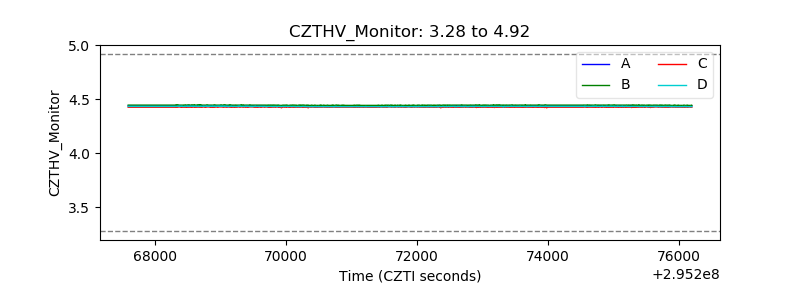 |
| D_VDD |  |
| Temperature 1 | 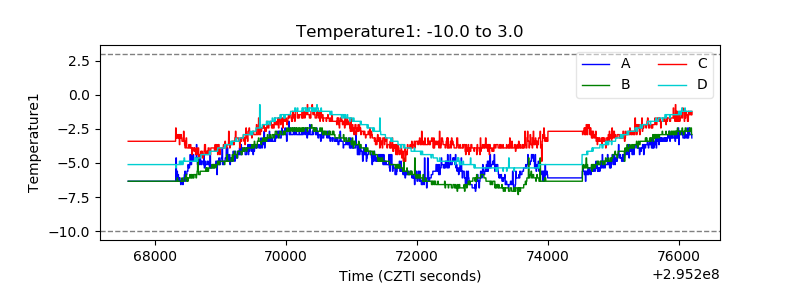 |
| Veto HV Monitor | 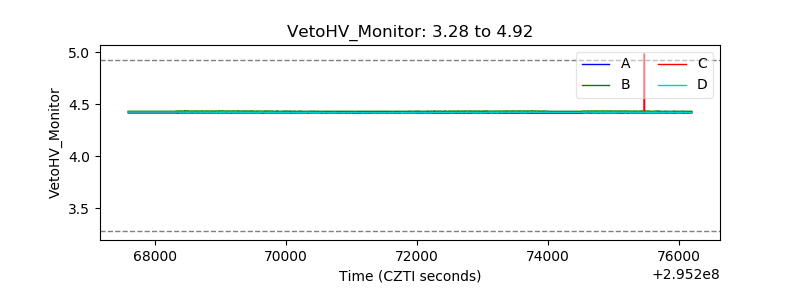 |
| Veto LLD |  |
| Alpha Counter | 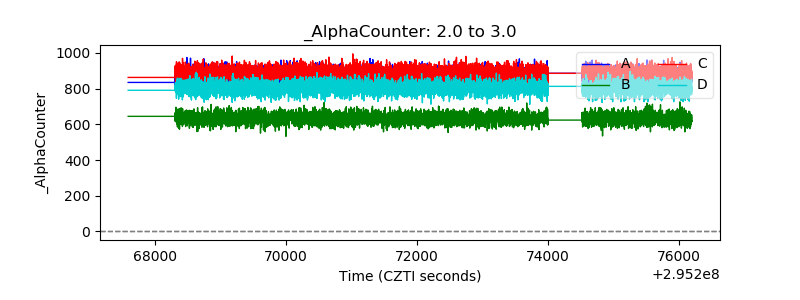 |
| _CPM_Rate | 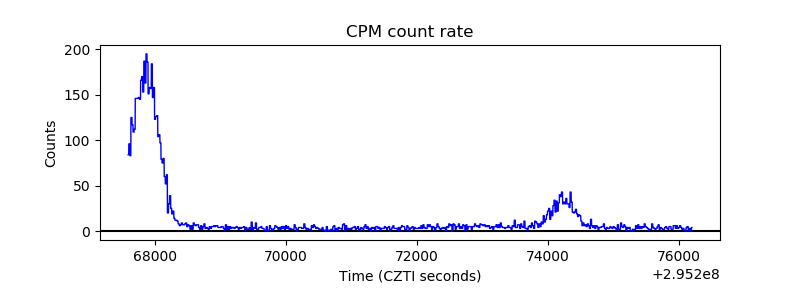 |
| CZT Counter | 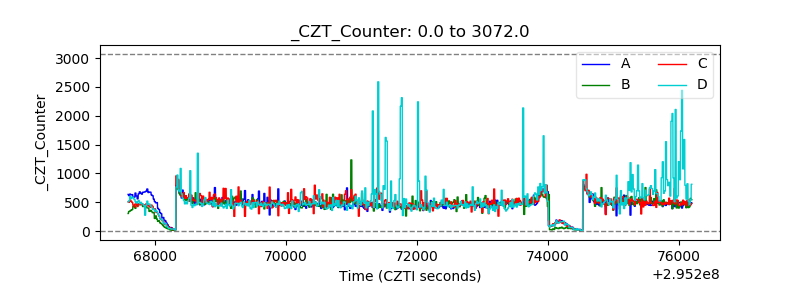 |
| +2.5 Volts monitor | 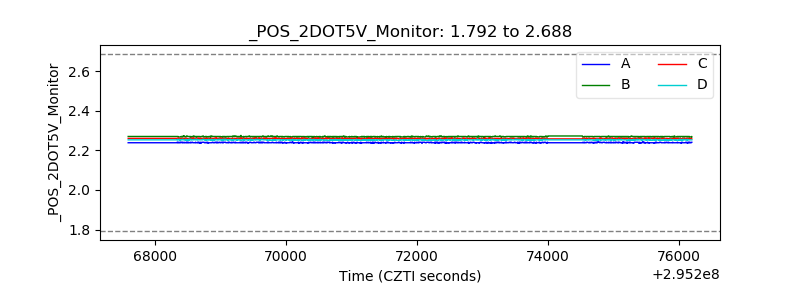 |
| +5 Volts monitor |  |
| _ROLL_ROT | 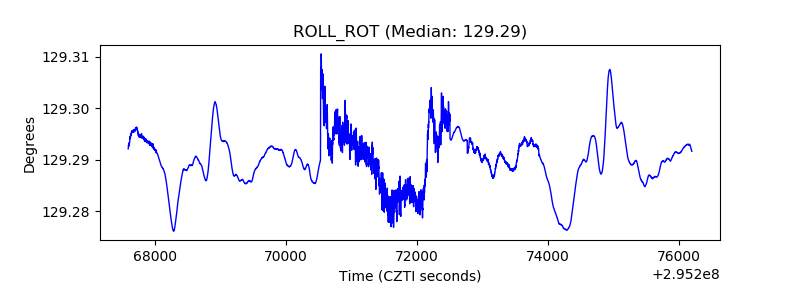 |
| _Roll_DEC | 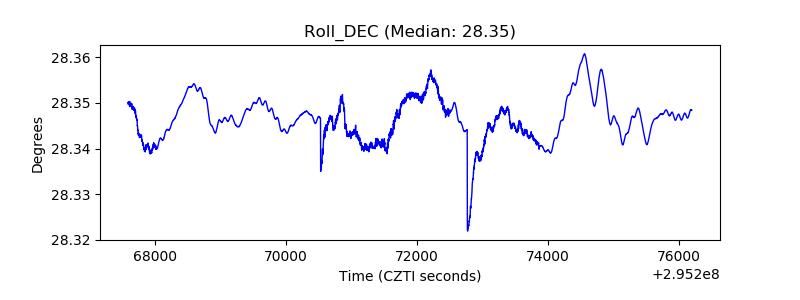 |
| _Roll_RA | 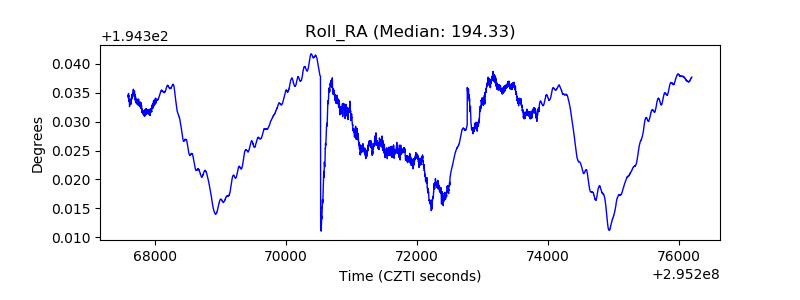 |
| Veto Counter | 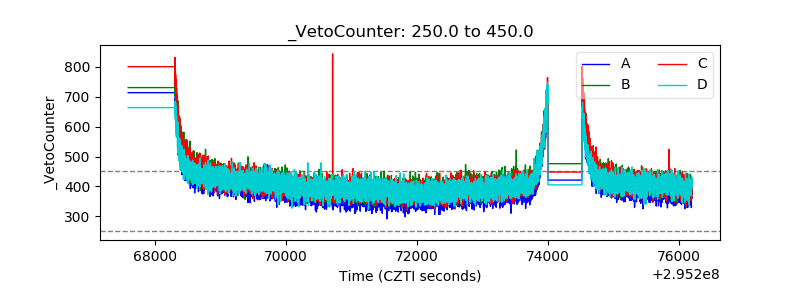 |