| Param | Original file | Final file |
|---|---|---|
| Filename | modeM0/AS1A05_115T02_9000002906_19559cztM0_level2.evt | modeM0/AS1A05_115T02_9000002906_19559cztM0_level2_quad_clean.evt |
| Size (bytes) | 512,418,240 | 94,901,760 |
| Size | 488.7 MB | 90.5 MB |
| Events in quadrant A | 3,639,079 | 611,354 |
| Events in quadrant B | 3,521,031 | 618,260 |
| Events in quadrant C | 3,601,914 | 584,271 |
| Events in quadrant D | 4,278,339 | 569,562 |
| Mode M0 | |||
|---|---|---|---|
| Quadrant | BADHDUFLAG | Total packets | Discarded packets |
| A | 0 | 14924 | 1 |
| B | 0 | 14908 | 1 |
| C | 0 | 15036 | 1 |
| D | 0 | 17400 | 1 |
| Mode M9 | |||
|---|---|---|---|
| Quadrant | BADHDUFLAG | Total packets | Discarded packets |
| A | 0 | 2 | 0 |
| B | 0 | 2 | 0 |
| C | 0 | 2 | 0 |
| D | 0 | 2 | 0 |
| Mode SS | |||
|---|---|---|---|
| Quadrant | BADHDUFLAG | Total packets | Discarded packets |
| A | 0 | 144 | 0 |
| B | 0 | 144 | 0 |
| C | 0 | 144 | 0 |
| D | 0 | 144 | 0 |
| Quadrant | Total seconds | Saturated seconds | Saturation percentage |
|---|---|---|---|
| A | 7045 | 188 | 2.668559% |
| B | 7044 | 198 | 2.810903% |
| C | 7045 | 244 | 3.463449% |
| D | 7045 | 311 | 4.414478% |
Noise dominated data is calculated using 1-second bins in cleaned event files. If a bin has >2000 counts, and if more than 50% of those come from <1% of pixels, then it is considered to be noise-dominated and hence unusable.
| Quadrant | # 1 sec bins | Bins with >0 counts | Bins with >2000 counts | High rate bins dominated by noise | Noise dominated (total time) | Noise dominated (detector-on time) | Marked lightcurve |
|---|---|---|---|---|---|---|---|
| A | 7175 | 7047 | 0 | 0 | 0.00% | 0.00% | 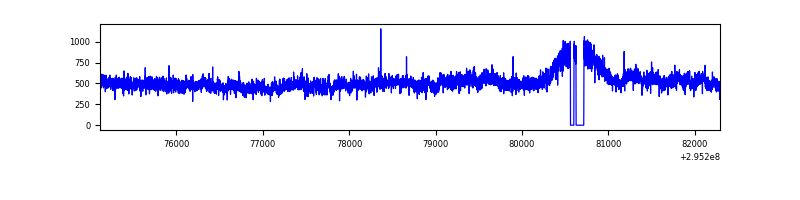 |
| B | 7174 | 7045 | 1 | 1 | 0.01% | 0.01% | 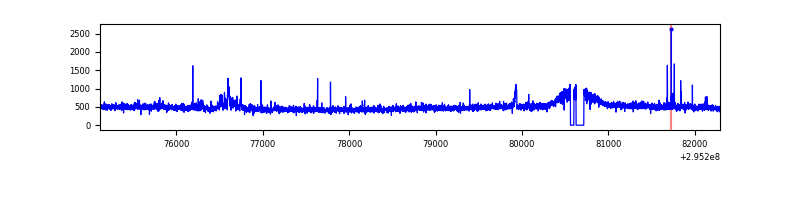 |
| C | 7175 | 7046 | 0 | 0 | 0.00% | 0.00% | 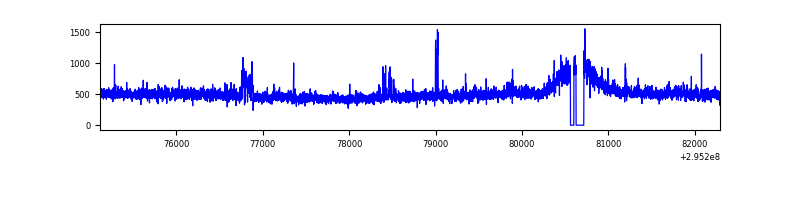 |
| D | 7175 | 7046 | 143 | 143 | 1.99% | 2.03% | 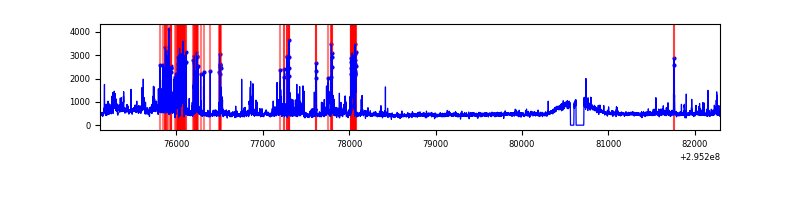 |
Top three noisy pixels from each quadrant. If the there are fewer than three noisy pixels in the level2.evt file, extra rows are filled as -1
| Pixel properties | Quadrant properties | ||||||
|---|---|---|---|---|---|---|---|
| Quadrant | DetID | PixID | Counts | Sigma | Mean | Median | Sigma |
| A | 15 | 191 | 272186 | 1541.73 | 870 | 851 | 176.0 |
| A | 13 | 254 | 11396 | 59.92 | 870 | 851 | 176.0 |
| A | 0 | 226 | 7842 | 39.72 | 870 | 851 | 176.0 |
| B | 7 | 220 | 55873 | 331.78 | 859 | 837 | 165.9 |
| B | 3 | 64 | 32130 | 188.65 | 859 | 837 | 165.9 |
| B | 0 | 198 | 22393 | 129.95 | 859 | 837 | 165.9 |
| C | 14 | 238 | 128564 | 655.85 | 829 | 834 | 194.8 |
| C | 3 | 233 | 127678 | 651.3 | 829 | 834 | 194.8 |
| C | 7 | 247 | 79992 | 406.45 | 829 | 834 | 194.8 |
| D | 12 | 233 | 503213 | 2438.29 | 840 | 815 | 206.0 |
| D | 12 | 218 | 246620 | 1192.97 | 840 | 815 | 206.0 |
| D | 7 | 238 | 194247 | 938.79 | 840 | 815 | 206.0 |
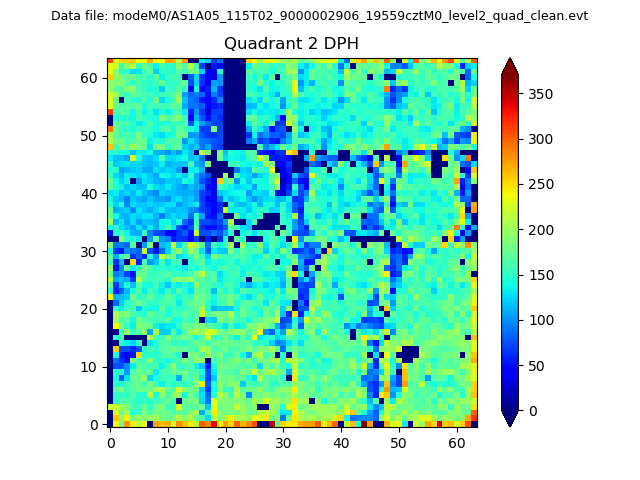
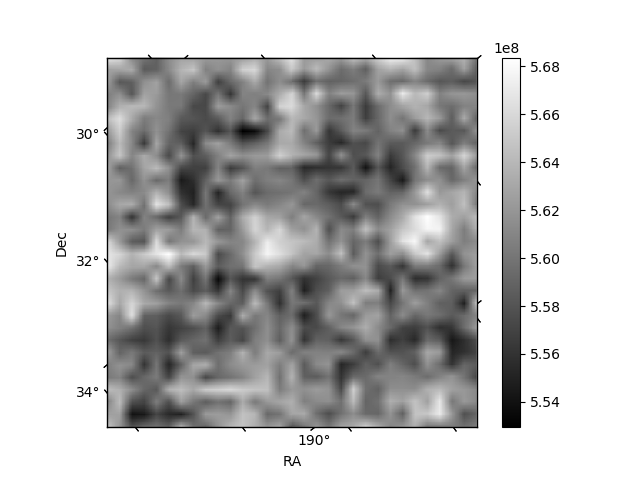
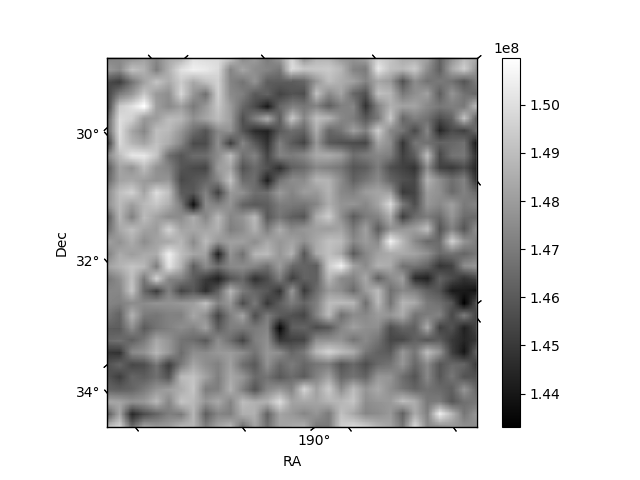
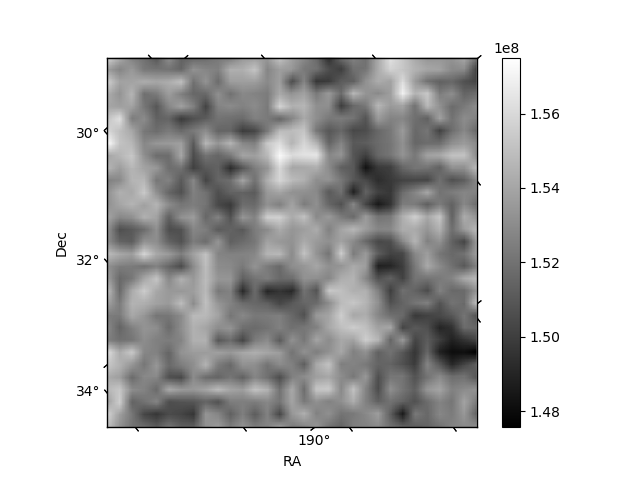
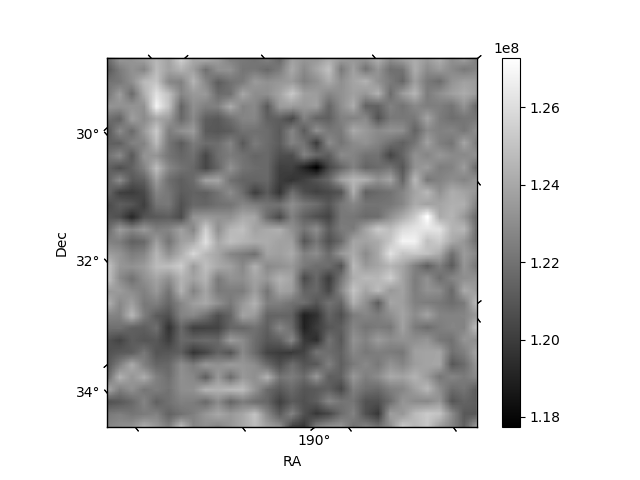
Histogram calculated using DETX and DETY for each event in the final _common_clean file
| Quadrant A | 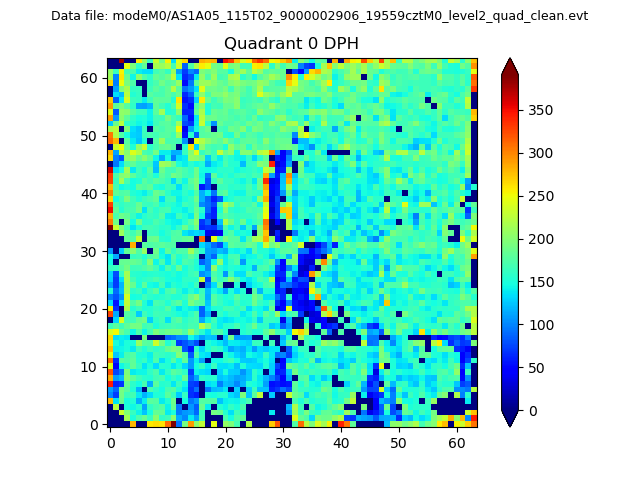 |
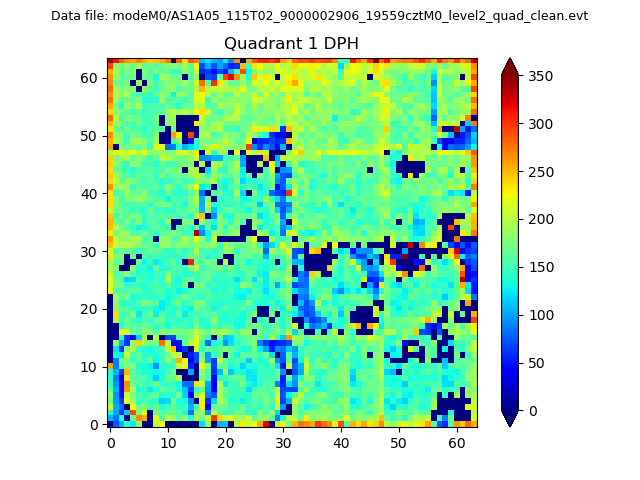 |
Quadrant B |
|---|---|---|---|
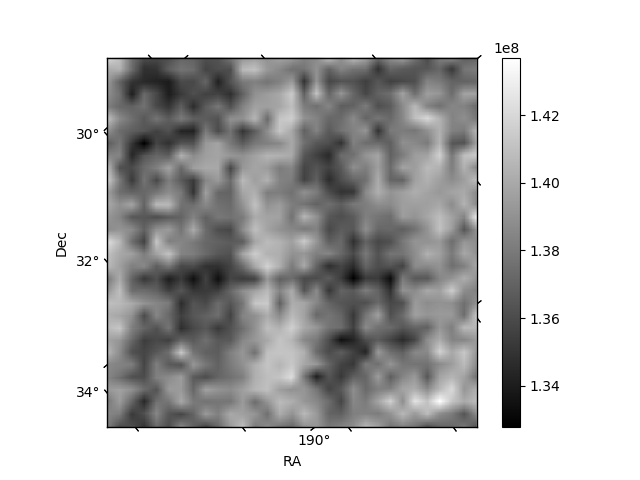
| Quadrant D | 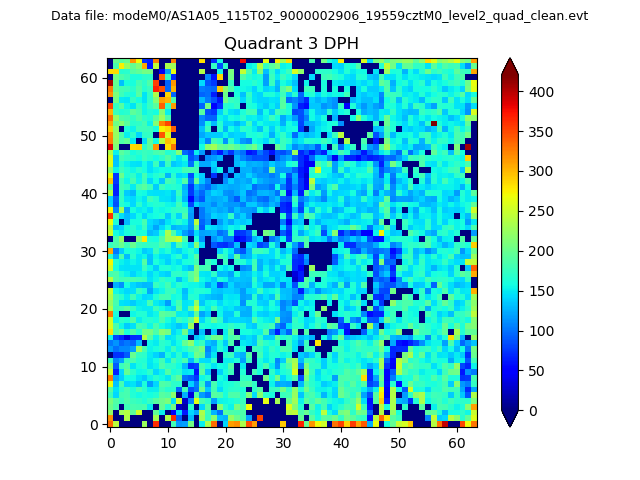 |
 |
Quadrant C |
| Plot type | Count rate plots | Images |
|---|---|---|
| Comparison with Poisson distribution Blue bars denote a histogram of data divided into 1 sec bins. Red curve is a Poisson curve with rate = median count rate of data. |
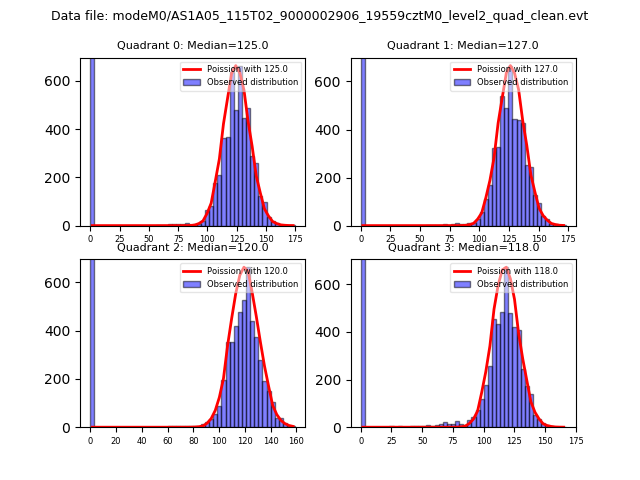 |
 |
| Quadrant-wise count rates Data is divided into 100 sec bins |
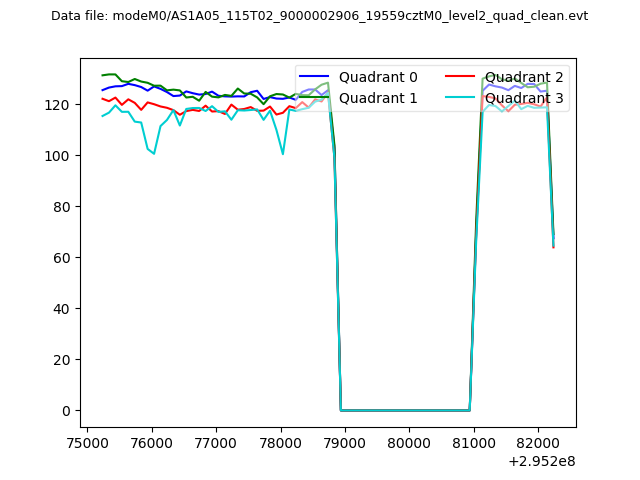 |
|
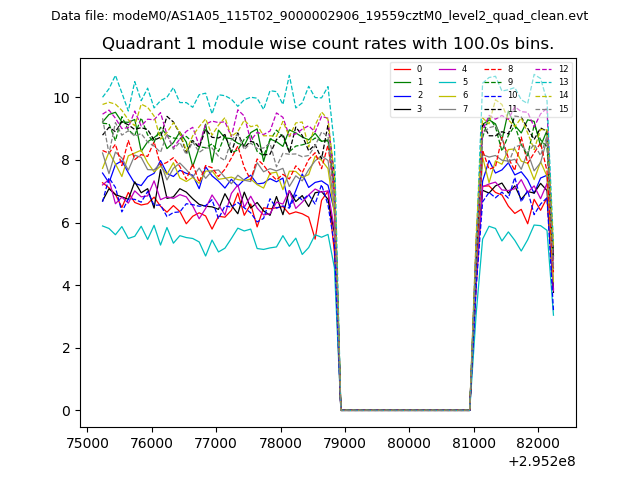
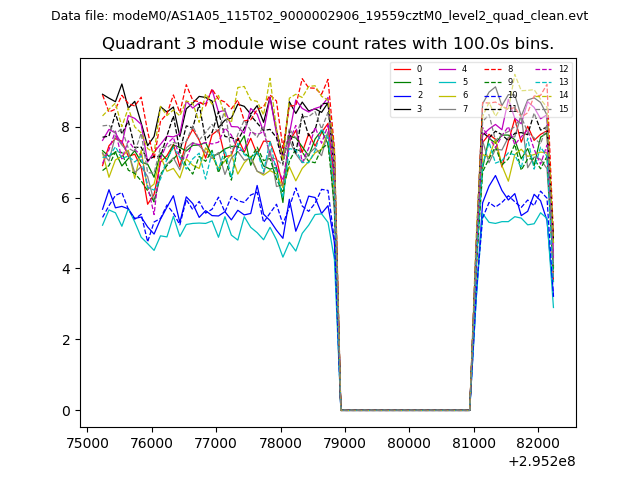
| Module-wise count rates for Quadrant A Data is divided into 100 sec bins |
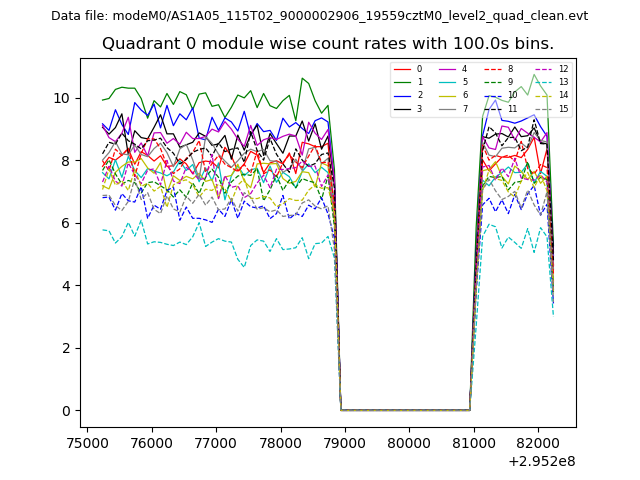 |
 |
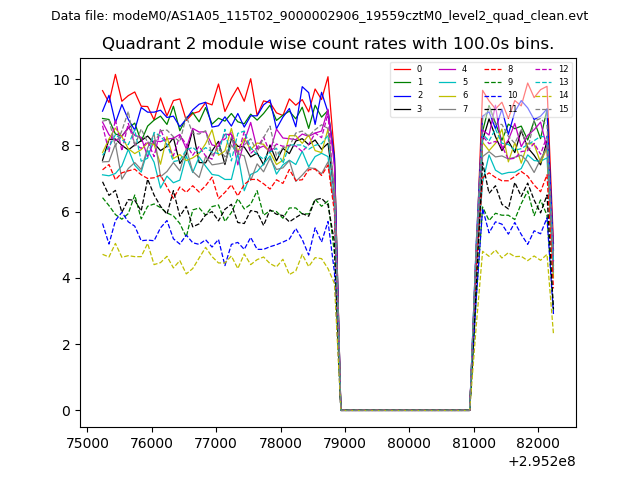
| Module-wise count rates for Quadrant B Data is divided into 100 sec bins |
 |
 |
| Module-wise count rates for Quadrant C Data is divided into 100 sec bins |
 |
 |
| Module-wise count rates for Quadrant D Data is divided into 100 sec bins |
 |
 |
| Parameter | Plot |
|---|---|
| CZT HV Monitor | 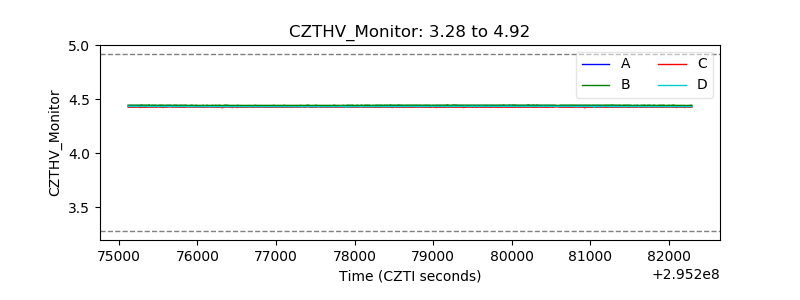 |
| D_VDD | 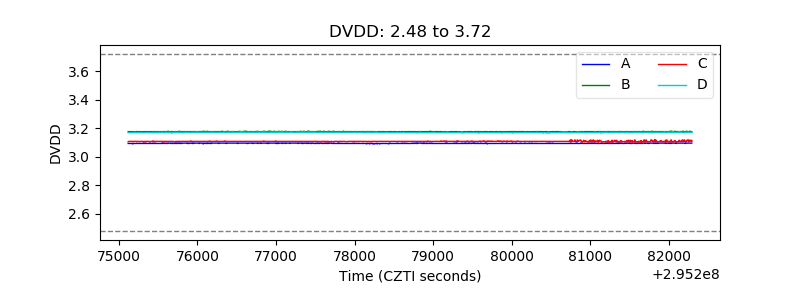 |
| Temperature 1 |  |
| Veto HV Monitor | 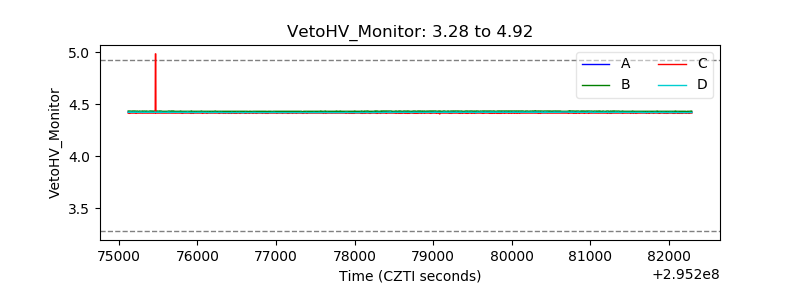 |
| Veto LLD | 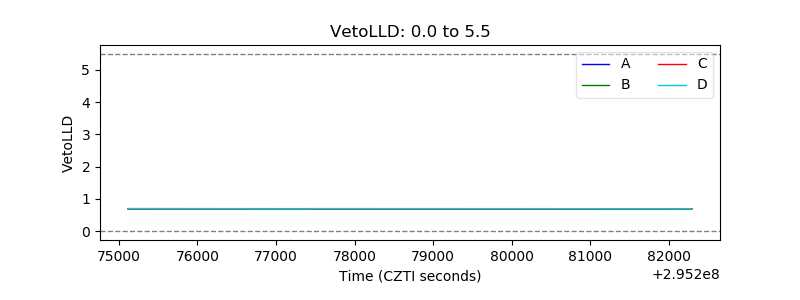 |
| Alpha Counter | 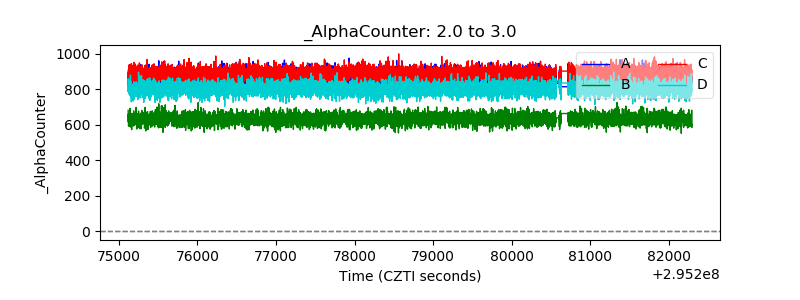 |
| _CPM_Rate | 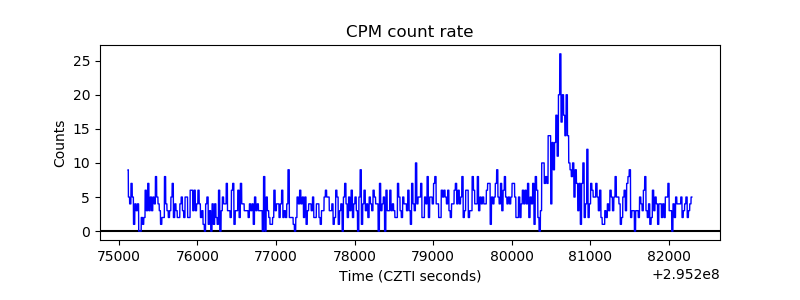 |
| CZT Counter | 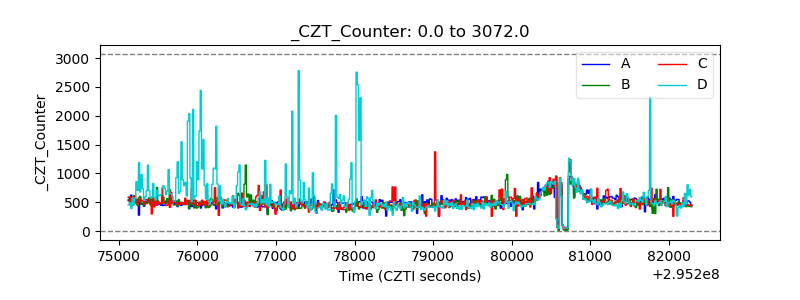 |
| +2.5 Volts monitor |  |
| +5 Volts monitor |  |
| _ROLL_ROT | 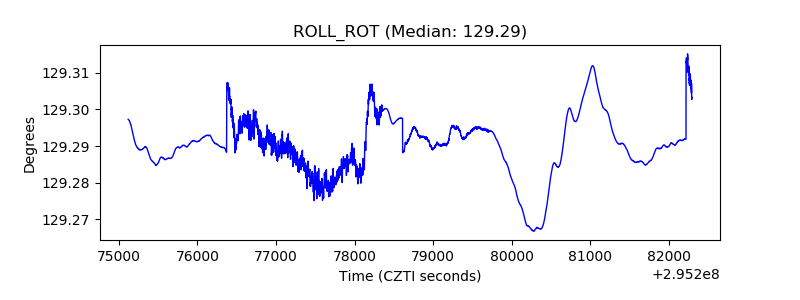 |
| _Roll_DEC | 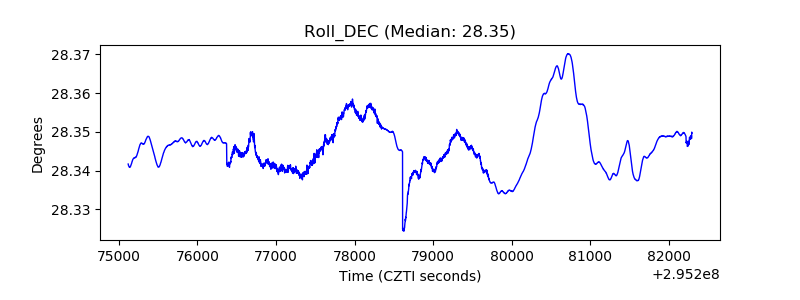 |
| _Roll_RA | 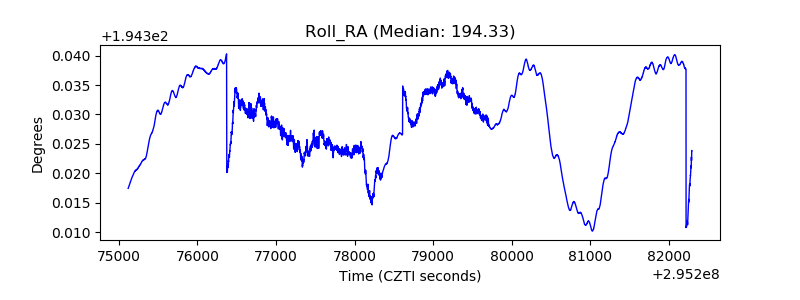 |
| Veto Counter | 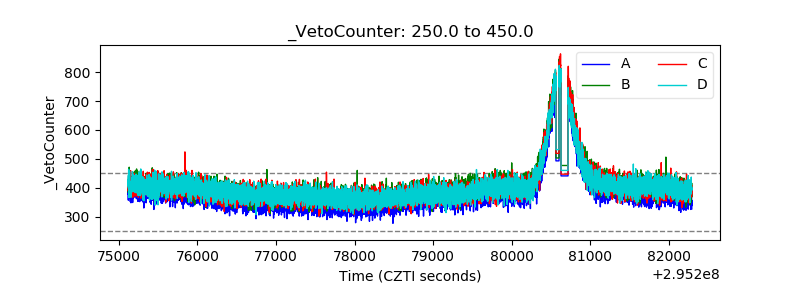 |