| Param | Original file | Final file |
|---|---|---|
| Filename | modeM0/AS1A05_115T02_9000002906_19560cztM0_level2.evt | modeM0/AS1A05_115T02_9000002906_19560cztM0_level2_quad_clean.evt |
| Size (bytes) | 524,505,600 | 97,041,600 |
| Size | 500.2 MB | 92.5 MB |
| Events in quadrant A | 3,782,236 | 627,688 |
| Events in quadrant B | 3,492,753 | 633,197 |
| Events in quadrant C | 3,822,828 | 597,511 |
| Events in quadrant D | 4,303,284 | 584,219 |
| Mode M0 | |||
|---|---|---|---|
| Quadrant | BADHDUFLAG | Total packets | Discarded packets |
| A | 0 | 15468 | 1 |
| B | 0 | 15008 | 1 |
| C | 0 | 15827 | 1 |
| D | 0 | 17353 | 1 |
| Mode M9 | |||
|---|---|---|---|
| Quadrant | BADHDUFLAG | Total packets | Discarded packets |
| A | 0 | 2 | 0 |
| B | 0 | 2 | 0 |
| C | 0 | 2 | 0 |
| D | 0 | 2 | 0 |
| Mode SS | |||
|---|---|---|---|
| Quadrant | BADHDUFLAG | Total packets | Discarded packets |
| A | 0 | 146 | 0 |
| B | 0 | 146 | 0 |
| C | 0 | 146 | 0 |
| D | 0 | 146 | 0 |
| Quadrant | Total seconds | Saturated seconds | Saturation percentage |
|---|---|---|---|
| A | 7124 | 155 | 2.175744% |
| B | 7125 | 172 | 2.414035% |
| C | 7125 | 224 | 3.143860% |
| D | 7125 | 228 | 3.200000% |
Noise dominated data is calculated using 1-second bins in cleaned event files. If a bin has >2000 counts, and if more than 50% of those come from <1% of pixels, then it is considered to be noise-dominated and hence unusable.
| Quadrant | # 1 sec bins | Bins with >0 counts | Bins with >2000 counts | High rate bins dominated by noise | Noise dominated (total time) | Noise dominated (detector-on time) | Marked lightcurve |
|---|---|---|---|---|---|---|---|
| A | 7309 | 7126 | 0 | 0 | 0.00% | 0.00% | 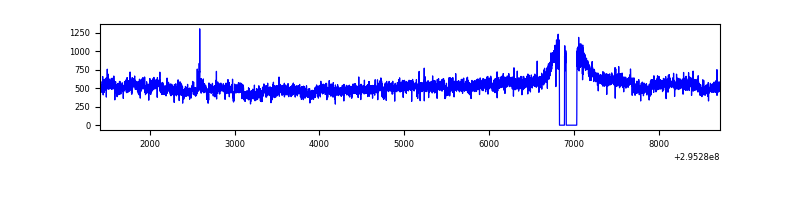 |
| B | 7310 | 7126 | 7 | 7 | 0.10% | 0.10% | 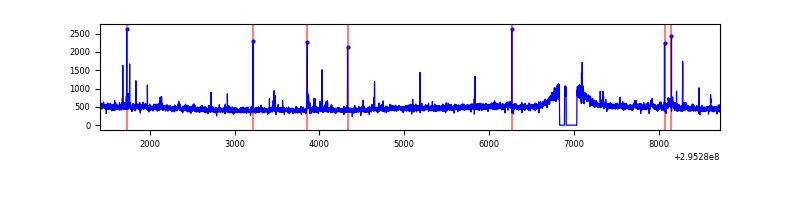 |
| C | 7310 | 7126 | 36 | 36 | 0.49% | 0.51% | 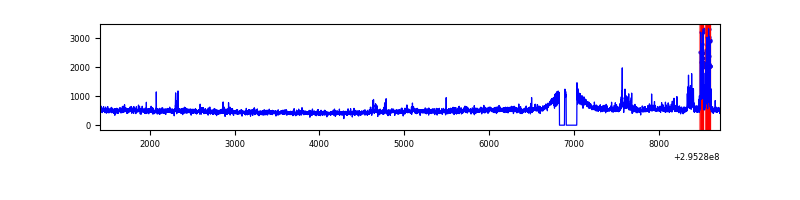 |
| D | 7310 | 7126 | 116 | 116 | 1.59% | 1.63% | 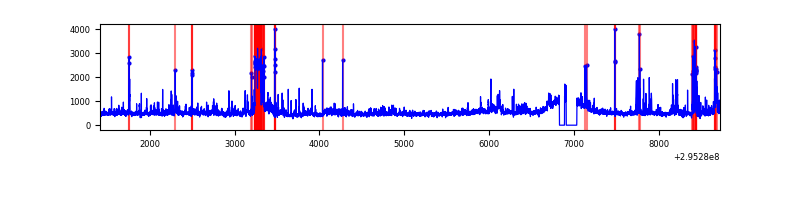 |
Top three noisy pixels from each quadrant. If the there are fewer than three noisy pixels in the level2.evt file, extra rows are filled as -1
| Pixel properties | Quadrant properties | ||||||
|---|---|---|---|---|---|---|---|
| Quadrant | DetID | PixID | Counts | Sigma | Mean | Median | Sigma |
| A | 15 | 191 | 426928 | 2420.78 | 869 | 850 | 176.0 |
| A | 13 | 254 | 10340 | 53.92 | 869 | 850 | 176.0 |
| A | 0 | 226 | 7402 | 37.23 | 869 | 850 | 176.0 |
| B | 3 | 64 | 46443 | 273.98 | 859 | 837 | 166.5 |
| B | 12 | 111 | 20387 | 117.45 | 859 | 837 | 166.5 |
| B | 11 | 111 | 18332 | 105.1 | 859 | 837 | 166.5 |
| C | 3 | 233 | 403379 | 2057.89 | 829 | 837 | 195.6 |
| C | 14 | 238 | 127026 | 645.11 | 829 | 837 | 195.6 |
| C | 9 | 221 | 25653 | 126.86 | 829 | 837 | 195.6 |
| D | 12 | 233 | 399111 | 1914.87 | 842 | 817 | 208.0 |
| D | 7 | 238 | 338307 | 1622.54 | 842 | 817 | 208.0 |
| D | 12 | 218 | 149906 | 716.77 | 842 | 817 | 208.0 |
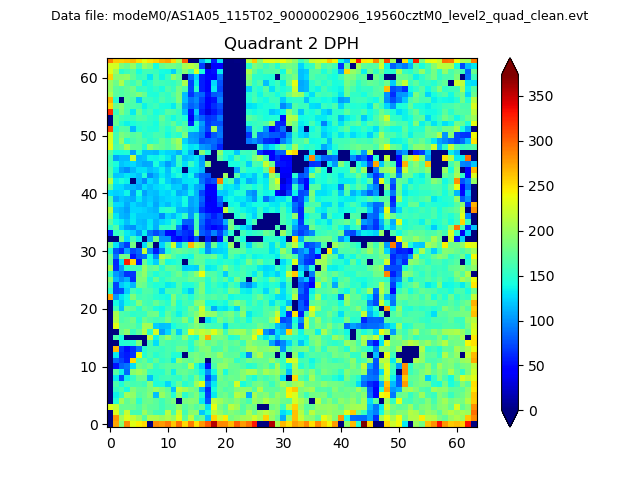
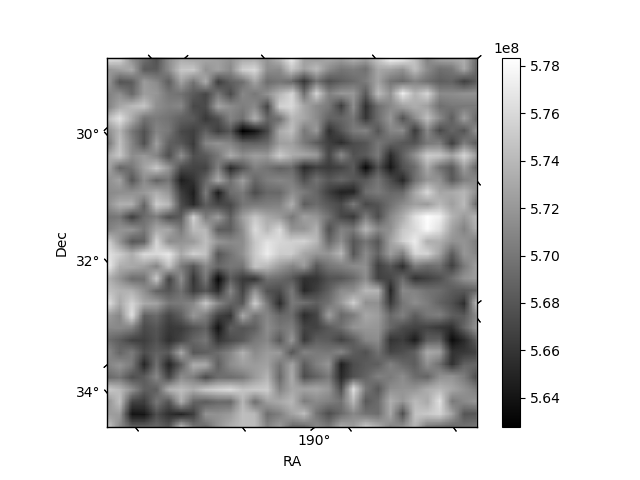
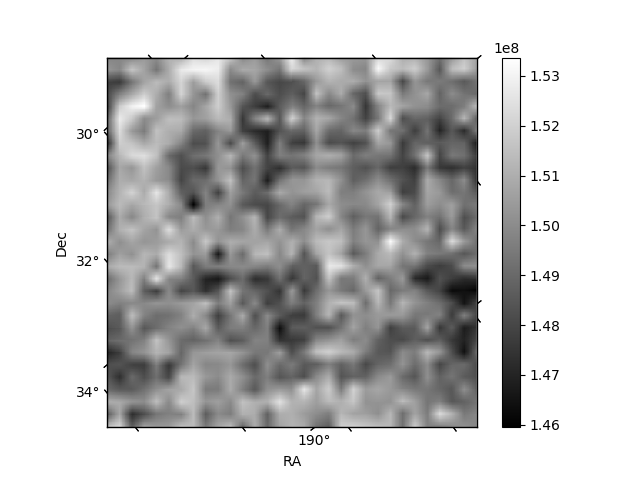
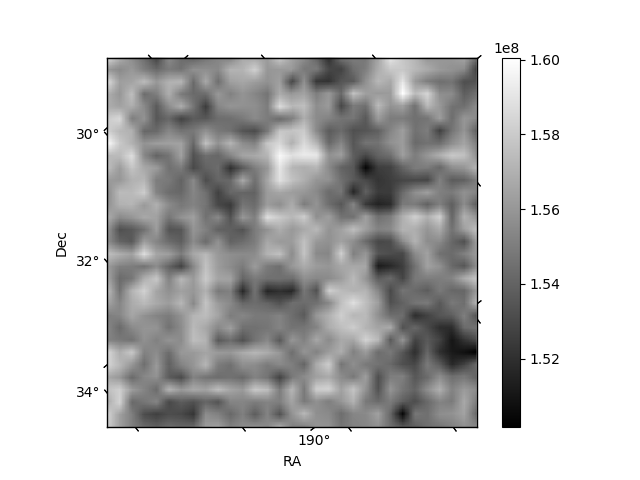
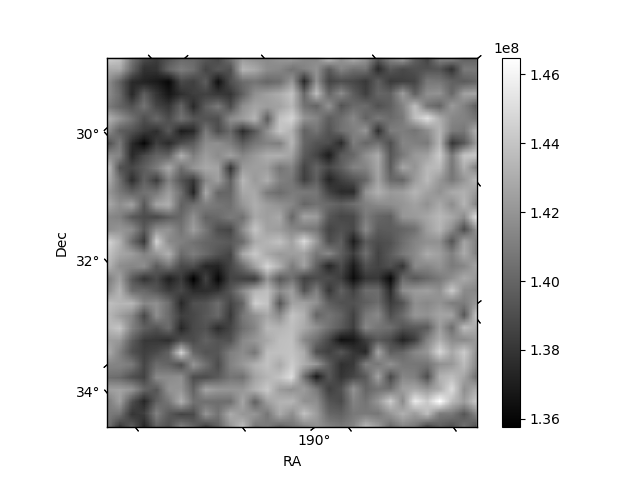
Histogram calculated using DETX and DETY for each event in the final _common_clean file
| Quadrant A | 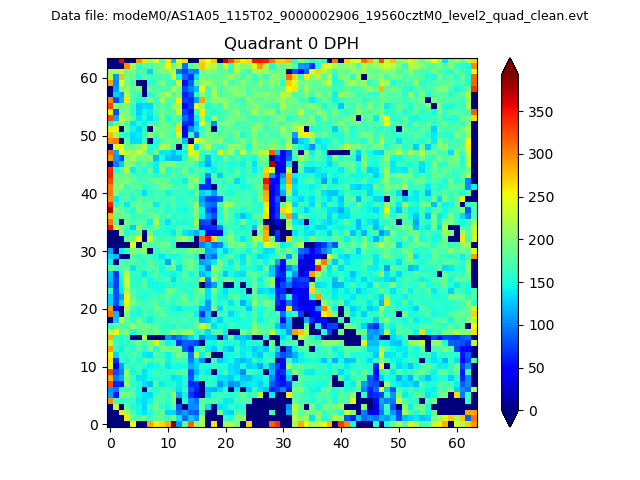 |
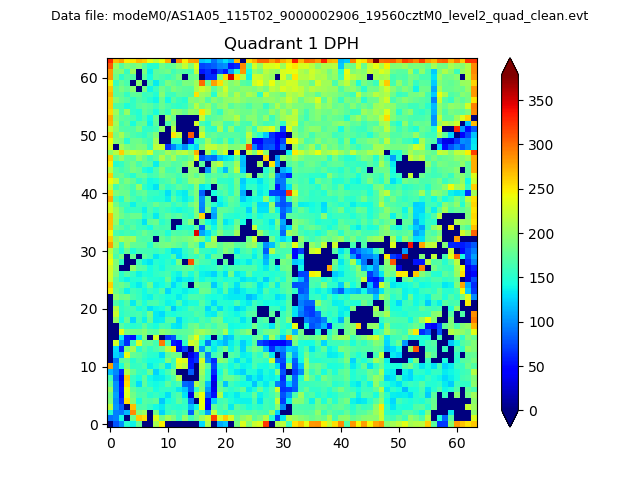 |
Quadrant B |
|---|---|---|---|
| Quadrant D | 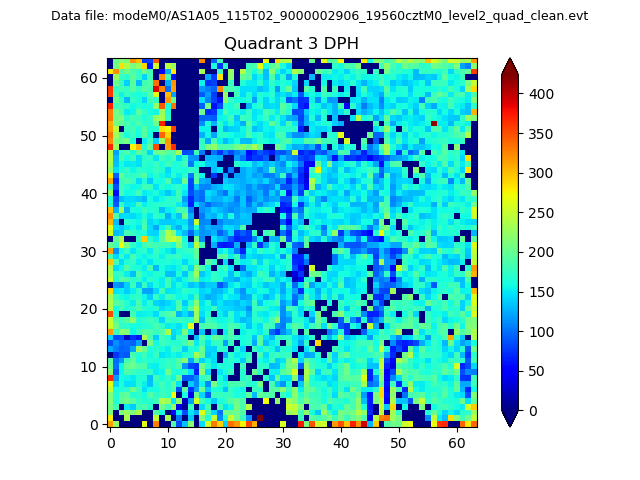 |
 |
Quadrant C |
| Plot type | Count rate plots | Images |
|---|---|---|
| Comparison with Poisson distribution Blue bars denote a histogram of data divided into 1 sec bins. Red curve is a Poisson curve with rate = median count rate of data. |
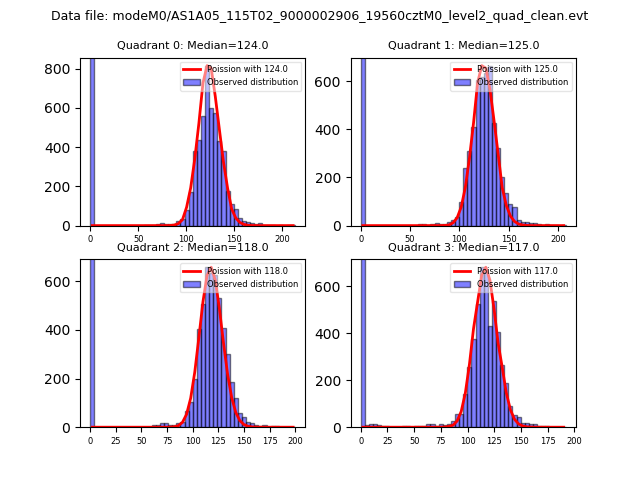 |
 |
| Quadrant-wise count rates Data is divided into 100 sec bins |
 |
|
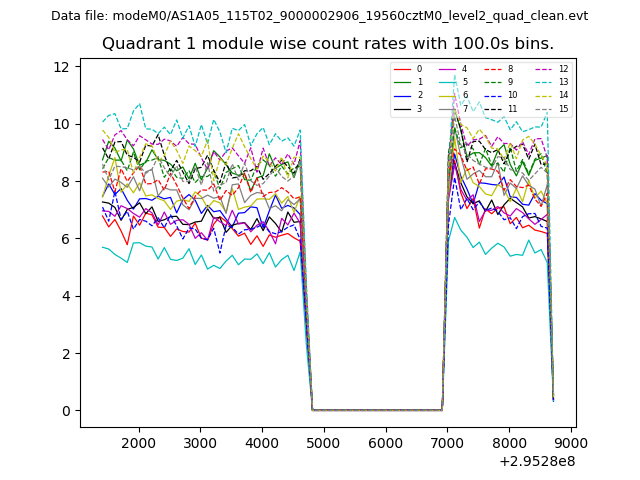
| Module-wise count rates for Quadrant A Data is divided into 100 sec bins |
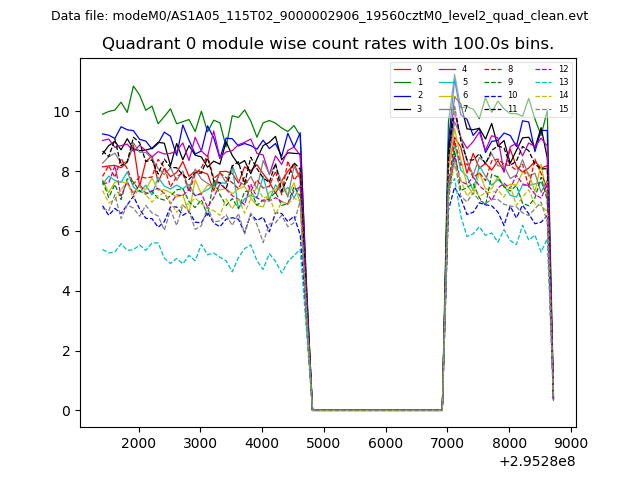 |
 |
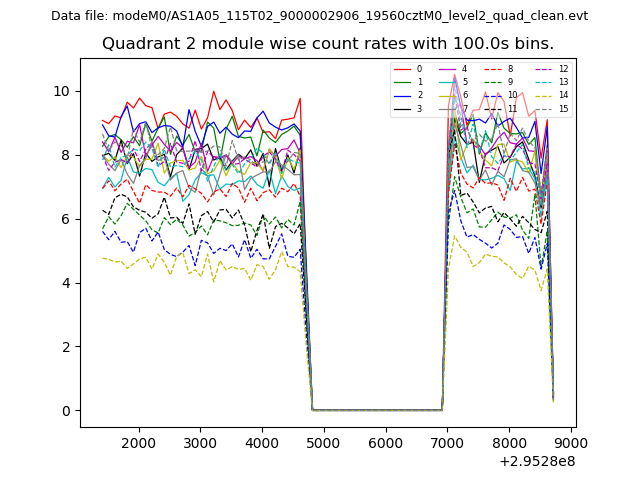
| Module-wise count rates for Quadrant B Data is divided into 100 sec bins |
 |
 |
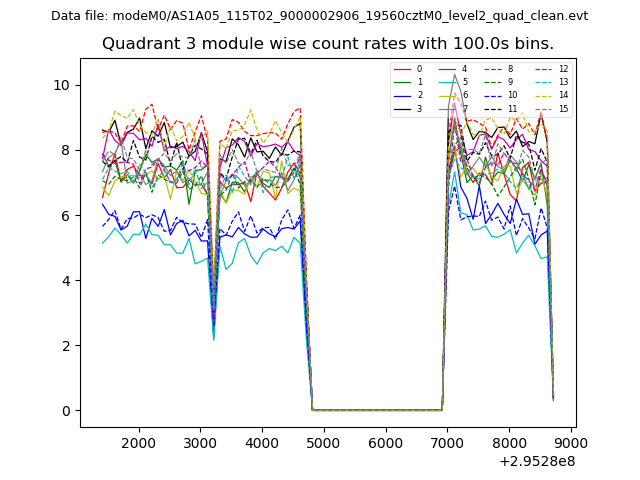
| Module-wise count rates for Quadrant C Data is divided into 100 sec bins |
 |
 |
| Module-wise count rates for Quadrant D Data is divided into 100 sec bins |
 |
 |
| Parameter | Plot |
|---|---|
| CZT HV Monitor | 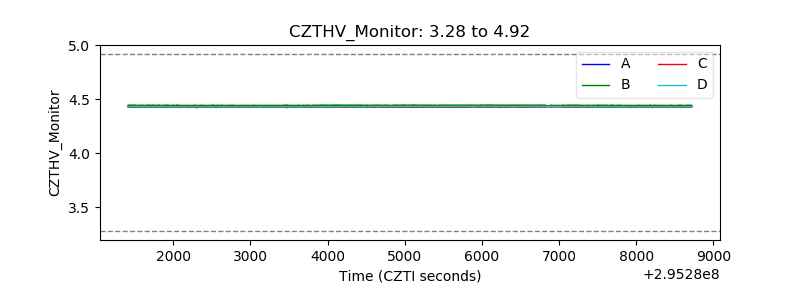 |
| D_VDD | 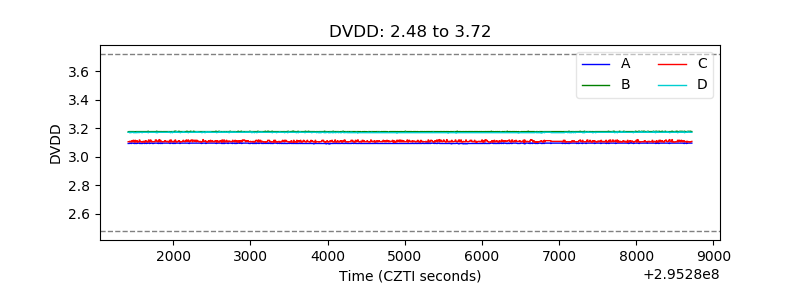 |
| Temperature 1 | 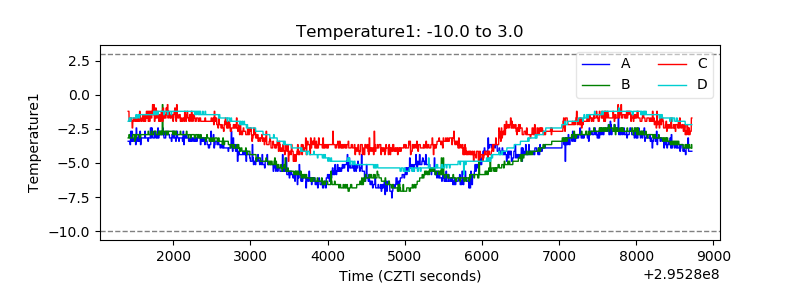 |
| Veto HV Monitor | 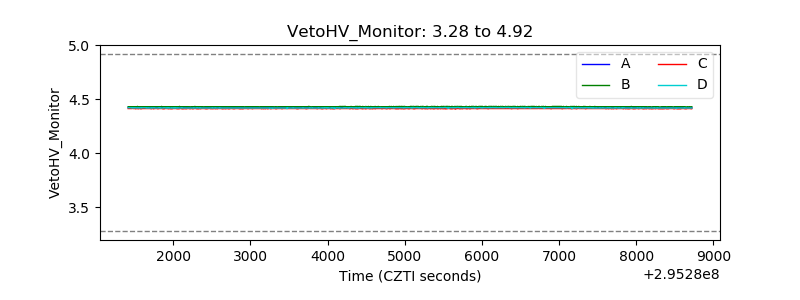 |
| Veto LLD | 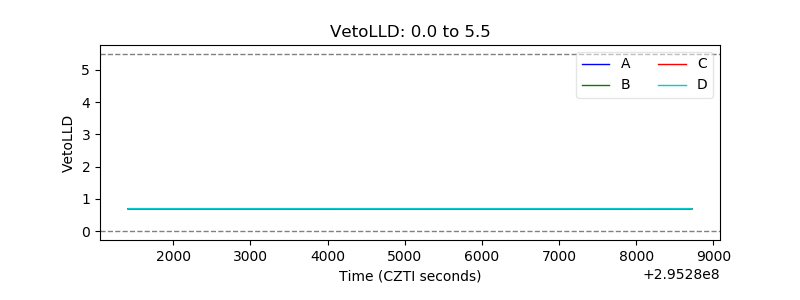 |
| Alpha Counter |  |
| _CPM_Rate | 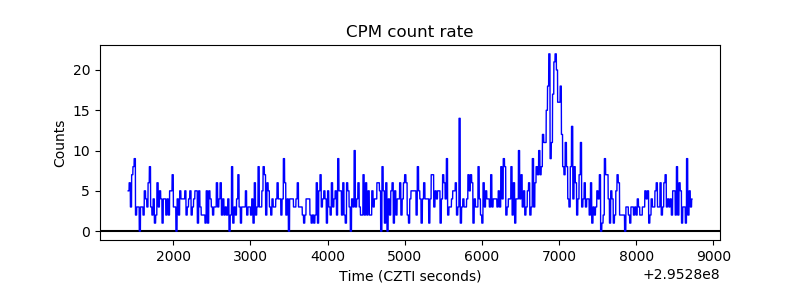 |
| CZT Counter |  |
| +2.5 Volts monitor |  |
| +5 Volts monitor |  |
| _ROLL_ROT | 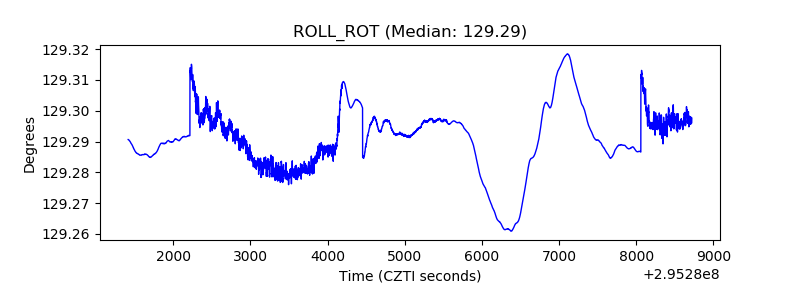 |
| _Roll_DEC | 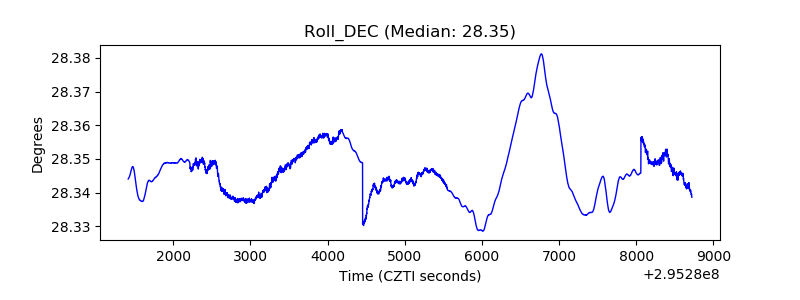 |
| _Roll_RA | 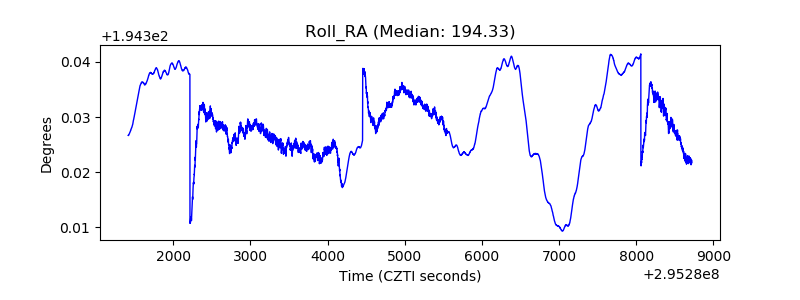 |
| Veto Counter | 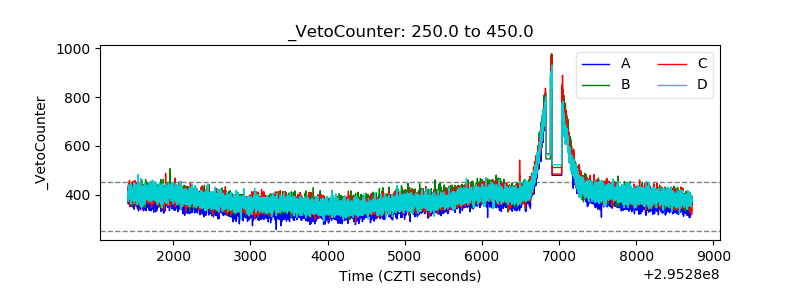 |