| Param | Original file | Final file |
|---|---|---|
| Filename | modeM0/AS1A05_115T02_9000002906_19563cztM0_level2.evt | modeM0/AS1A05_115T02_9000002906_19563cztM0_level2_quad_clean.evt |
| Size (bytes) | 254,617,920 | 56,113,920 |
| Size | 242.8 MB | 53.5 MB |
| Events in quadrant A | 1,666,687 | 381,738 |
| Events in quadrant B | 1,531,986 | 384,528 |
| Events in quadrant C | 2,054,228 | 359,736 |
| Events in quadrant D | 2,247,365 | 353,942 |
| Mode M0 | |||
|---|---|---|---|
| Quadrant | BADHDUFLAG | Total packets | Discarded packets |
| A | 0 | 6824 | 1 |
| B | 0 | 6657 | 1 |
| C | 0 | 8121 | 1 |
| D | 0 | 8746 | 1 |
| Mode M9 | |||
|---|---|---|---|
| Quadrant | BADHDUFLAG | Total packets | Discarded packets |
| A | 0 | 1 | 0 |
| B | 0 | 2 | 0 |
| C | 0 | 2 | 0 |
| D | 0 | 2 | 0 |
| Mode SS | |||
|---|---|---|---|
| Quadrant | BADHDUFLAG | Total packets | Discarded packets |
| A | 0 | 66 | 0 |
| B | 0 | 66 | 0 |
| C | 0 | 66 | 0 |
| D | 0 | 66 | 0 |
| Quadrant | Total seconds | Saturated seconds | Saturation percentage |
|---|---|---|---|
| A | 3075 | 81 | 2.634146% |
| B | 3075 | 100 | 3.252033% |
| C | 3075 | 157 | 5.105691% |
| D | 3075 | 188 | 6.113821% |
Noise dominated data is calculated using 1-second bins in cleaned event files. If a bin has >2000 counts, and if more than 50% of those come from <1% of pixels, then it is considered to be noise-dominated and hence unusable.
| Quadrant | # 1 sec bins | Bins with >0 counts | Bins with >2000 counts | High rate bins dominated by noise | Noise dominated (total time) | Noise dominated (detector-on time) | Marked lightcurve |
|---|---|---|---|---|---|---|---|
| A | 3200 | 3076 | 0 | 0 | 0.00% | 0.00% | 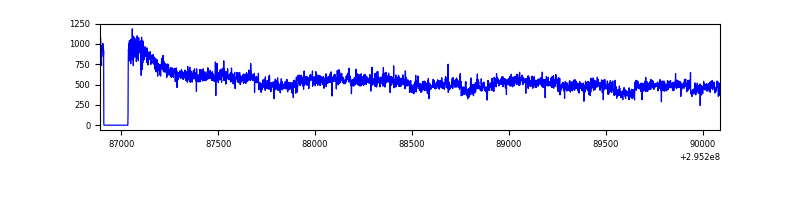 |
| B | 3200 | 3075 | 8 | 8 | 0.25% | 0.26% | 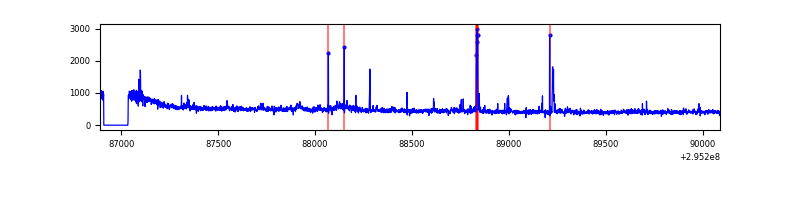 |
| C | 3200 | 3075 | 50 | 50 | 1.56% | 1.63% | 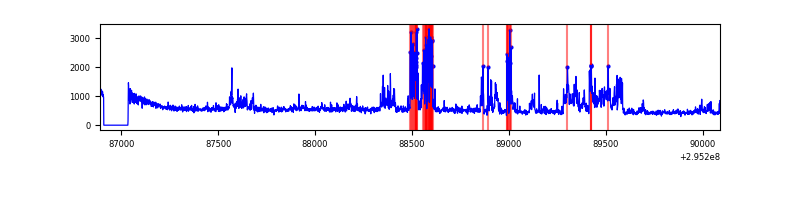 |
| D | 3200 | 3075 | 132 | 132 | 4.12% | 4.29% | 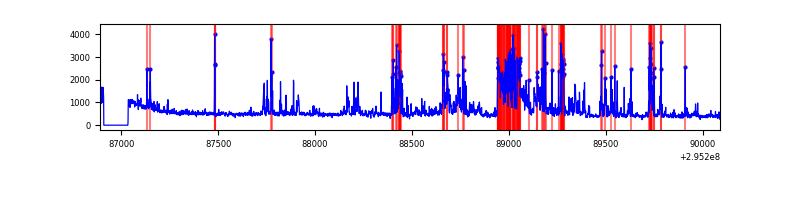 |
Top three noisy pixels from each quadrant. If the there are fewer than three noisy pixels in the level2.evt file, extra rows are filled as -1
| Pixel properties | Quadrant properties | ||||||
|---|---|---|---|---|---|---|---|
| Quadrant | DetID | PixID | Counts | Sigma | Mean | Median | Sigma |
| A | 15 | 191 | 233509 | 3043.14 | 371 | 363 | 76.6 |
| A | 13 | 254 | 4521 | 54.27 | 371 | 363 | 76.6 |
| A | 0 | 226 | 3213 | 37.2 | 371 | 363 | 76.6 |
| B | 3 | 64 | 33292 | 454.02 | 366 | 356 | 72.5 |
| B | 7 | 220 | 31432 | 428.38 | 366 | 356 | 72.5 |
| B | 12 | 111 | 8553 | 113.0 | 366 | 356 | 72.5 |
| C | 3 | 233 | 597316 | 6969.04 | 353 | 354 | 85.7 |
| C | 14 | 238 | 53552 | 621.04 | 353 | 354 | 85.7 |
| C | 9 | 221 | 13197 | 149.93 | 353 | 354 | 85.7 |
| D | 12 | 218 | 330567 | 3729.81 | 361 | 351 | 88.5 |
| D | 13 | 104 | 275753 | 3110.69 | 361 | 351 | 88.5 |
| D | 12 | 233 | 125657 | 1415.34 | 361 | 351 | 88.5 |
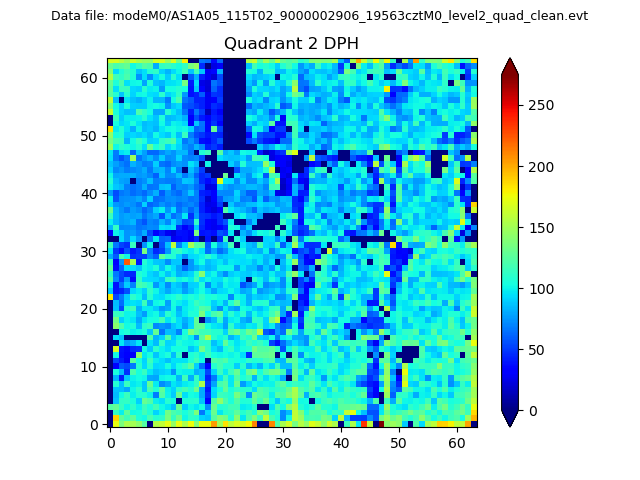
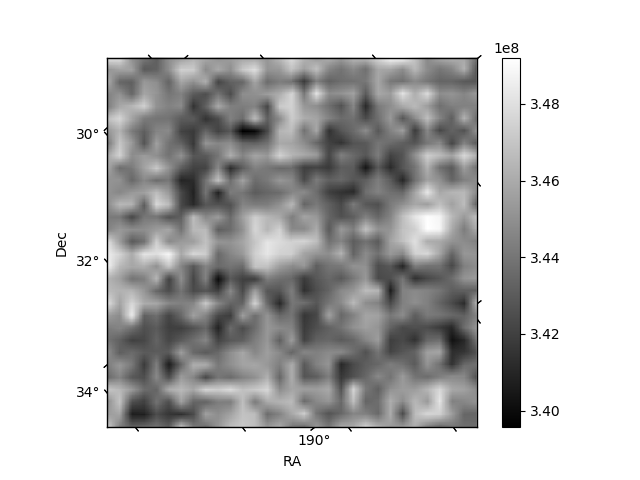
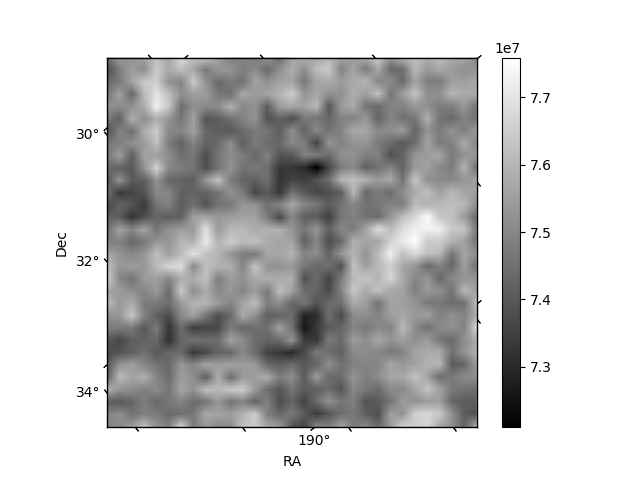
Histogram calculated using DETX and DETY for each event in the final _common_clean file
| Quadrant A | 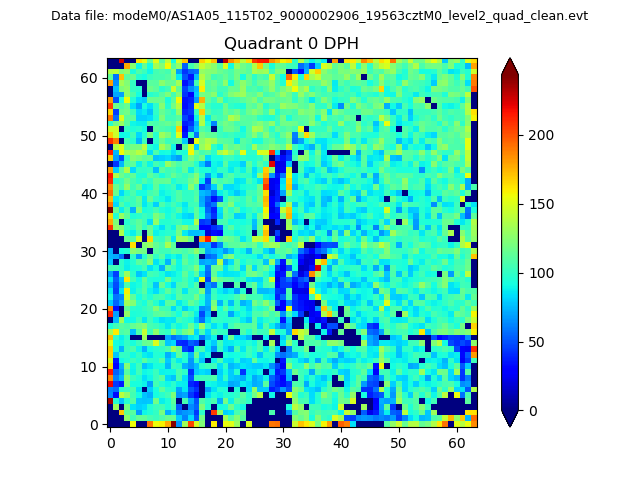 |
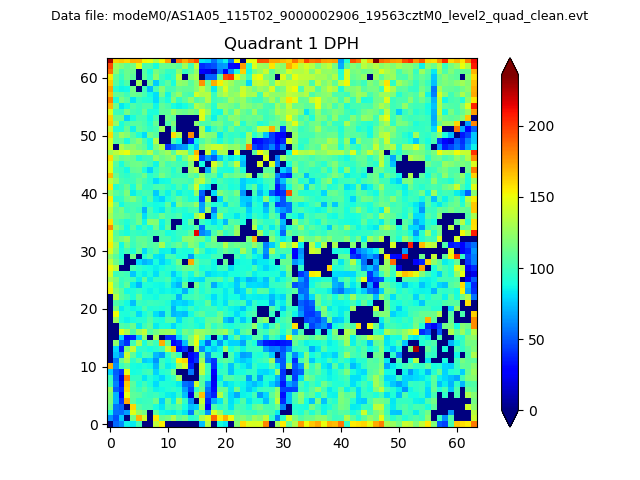 |
Quadrant B |
|---|---|---|---|
| Quadrant D | 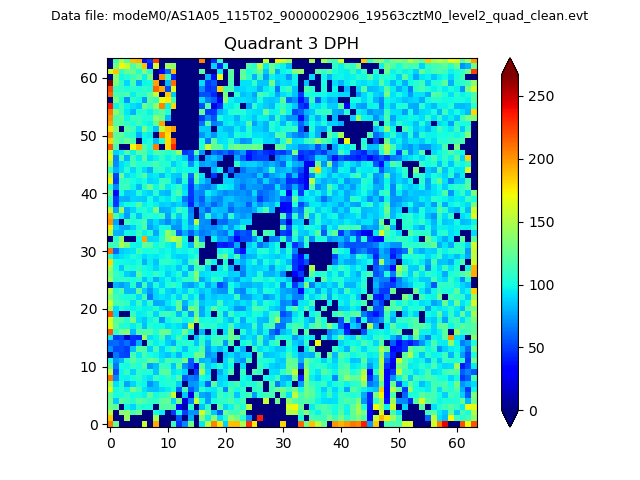 |
 |
Quadrant C |
| Plot type | Count rate plots | Images |
|---|---|---|
| Comparison with Poisson distribution Blue bars denote a histogram of data divided into 1 sec bins. Red curve is a Poisson curve with rate = median count rate of data. |
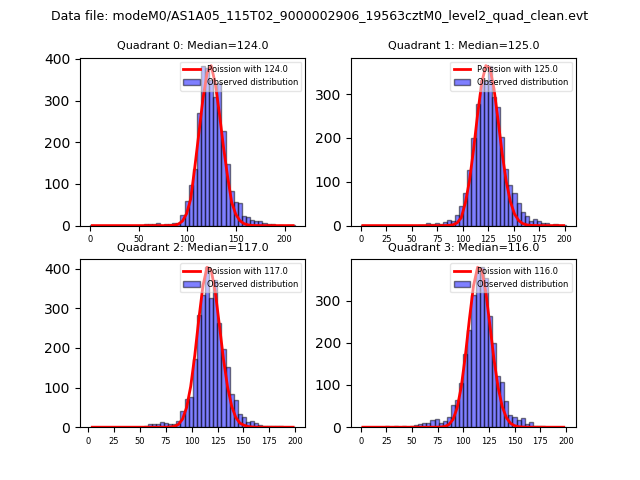 |
 |
| Quadrant-wise count rates Data is divided into 100 sec bins |
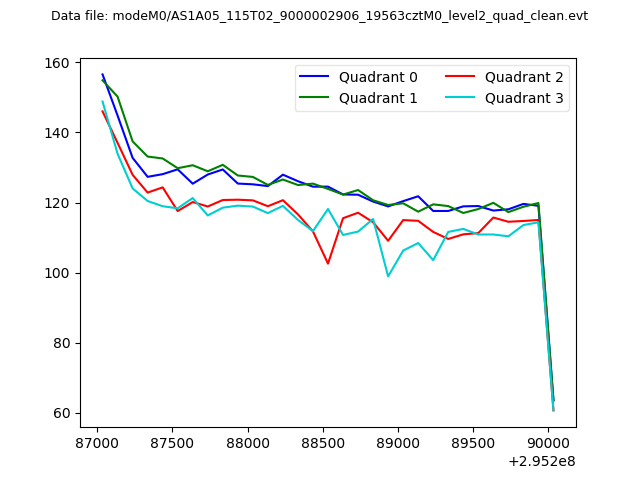 |
|
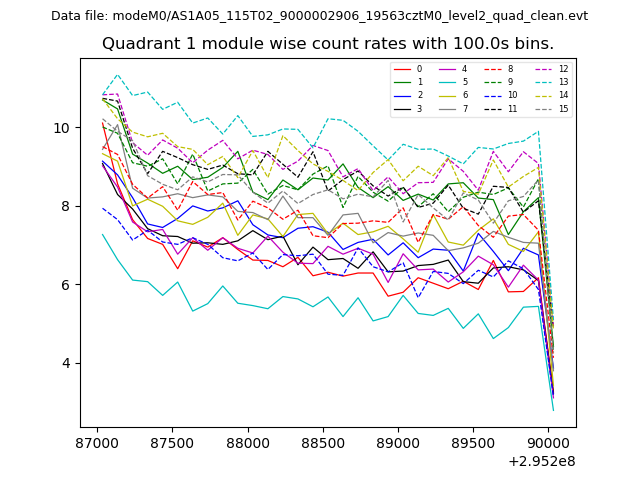
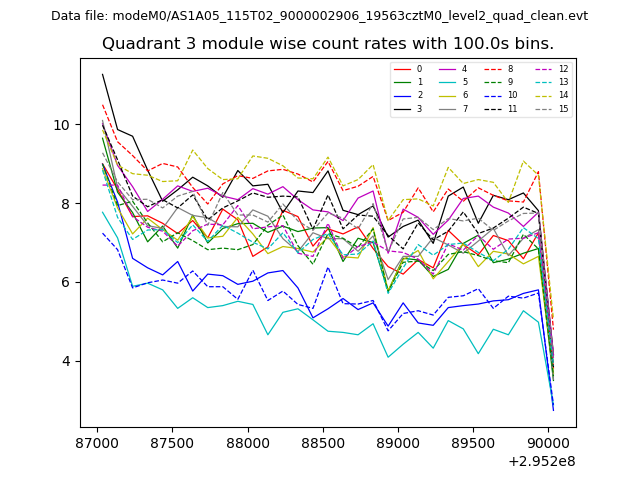
| Module-wise count rates for Quadrant A Data is divided into 100 sec bins |
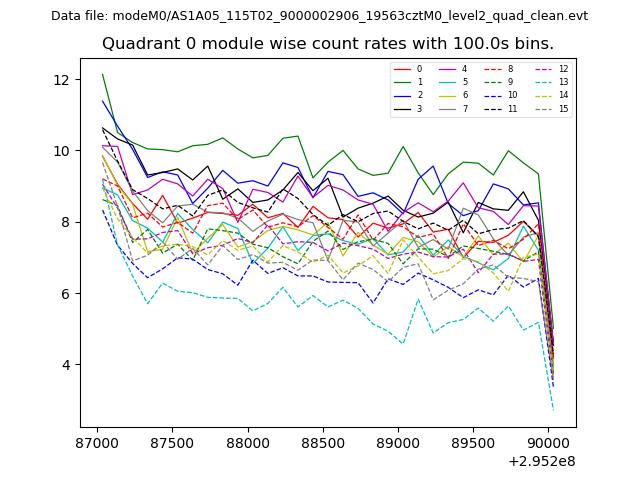 |
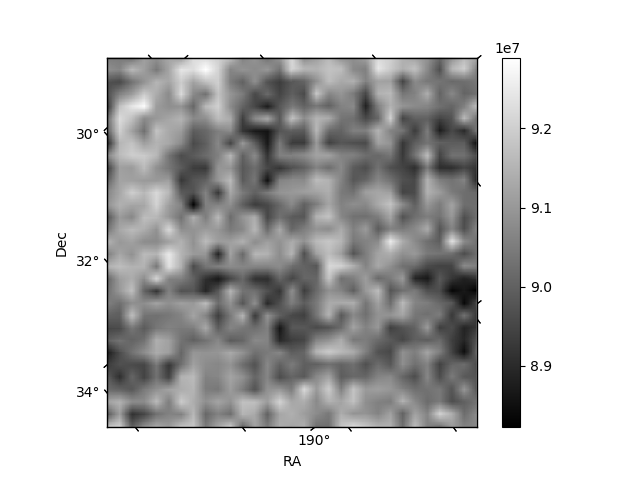 |
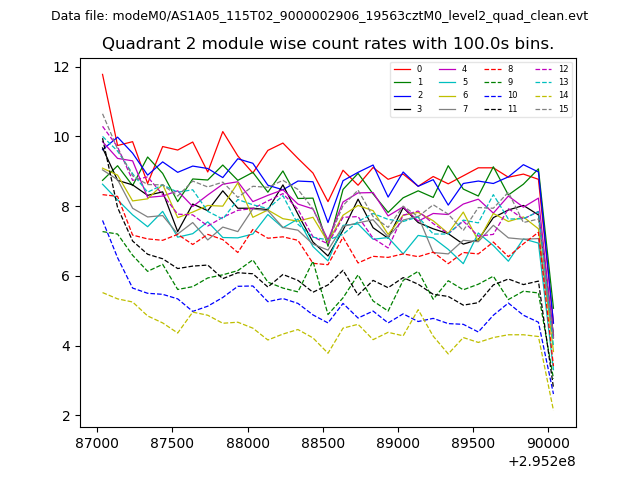
| Module-wise count rates for Quadrant B Data is divided into 100 sec bins |
 |
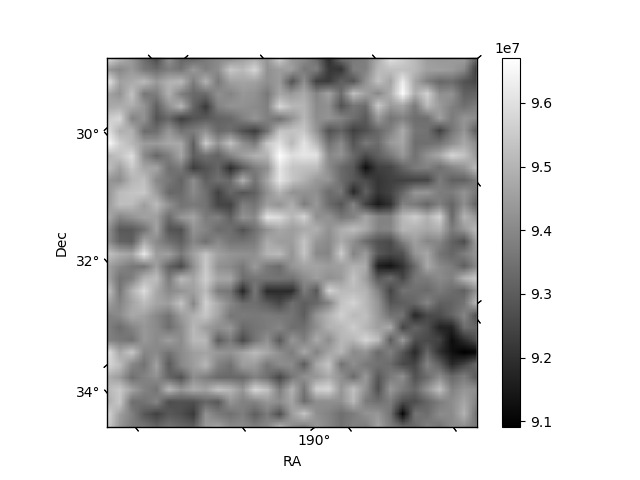 |
| Module-wise count rates for Quadrant C Data is divided into 100 sec bins |
 |
 |
| Module-wise count rates for Quadrant D Data is divided into 100 sec bins |
 |
 |
| Parameter | Plot |
|---|---|
| CZT HV Monitor | 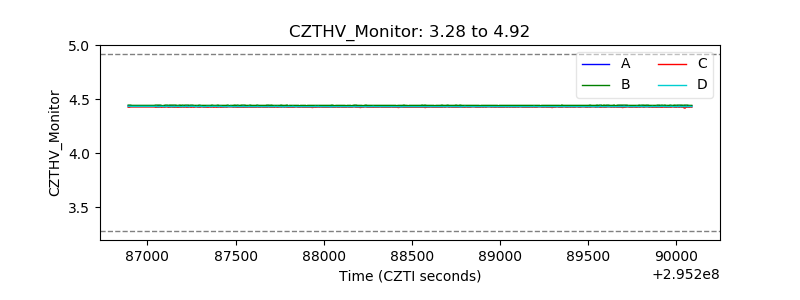 |
| D_VDD | 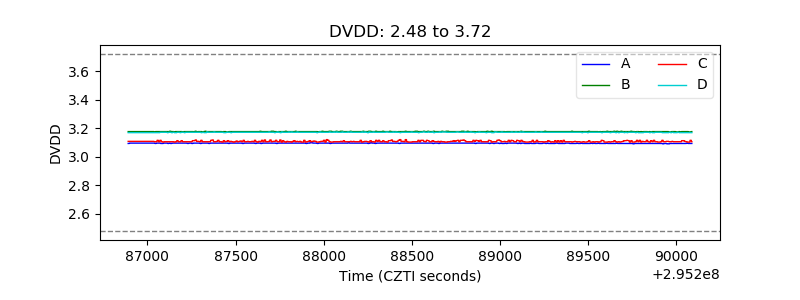 |
| Temperature 1 | 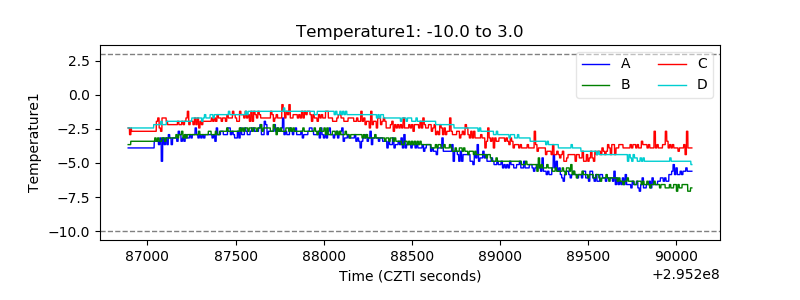 |
| Veto HV Monitor | 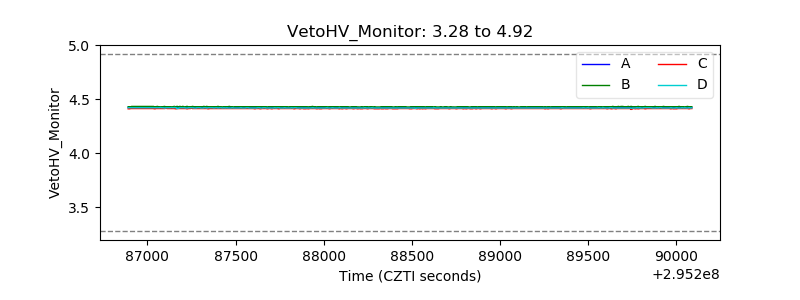 |
| Veto LLD | 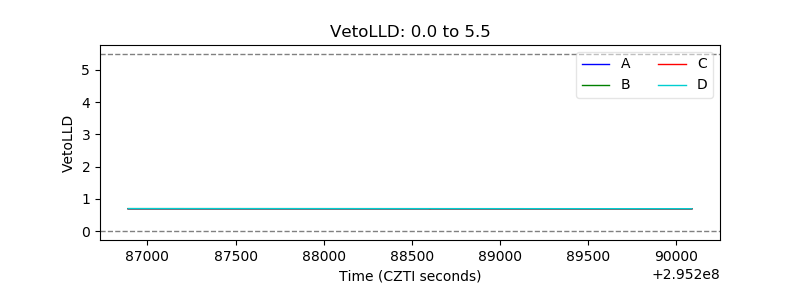 |
| Alpha Counter | 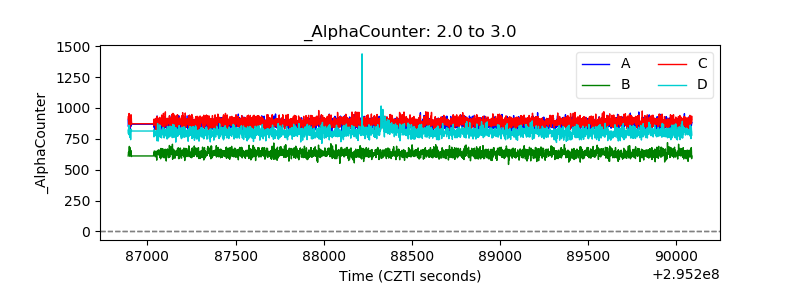 |
| _CPM_Rate | 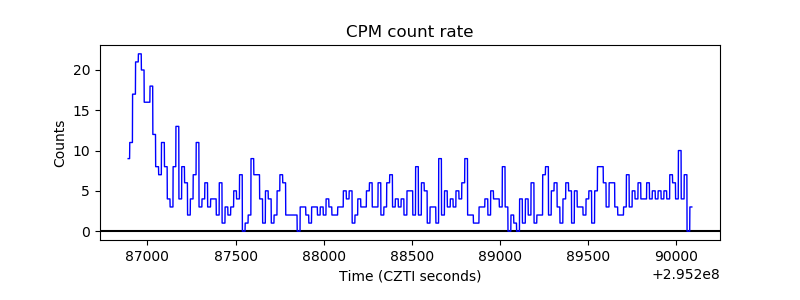 |
| CZT Counter | 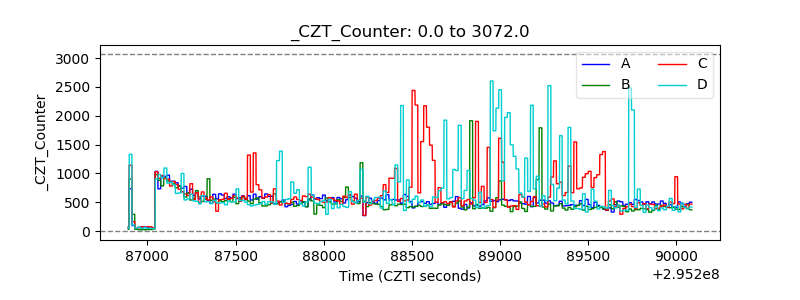 |
| +2.5 Volts monitor |  |
| +5 Volts monitor |  |
| _ROLL_ROT | 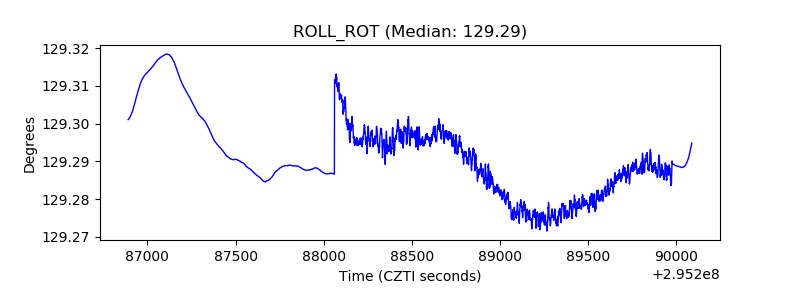 |
| _Roll_DEC | 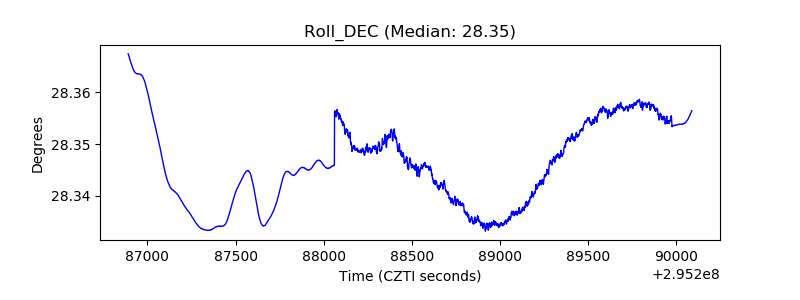 |
| _Roll_RA | 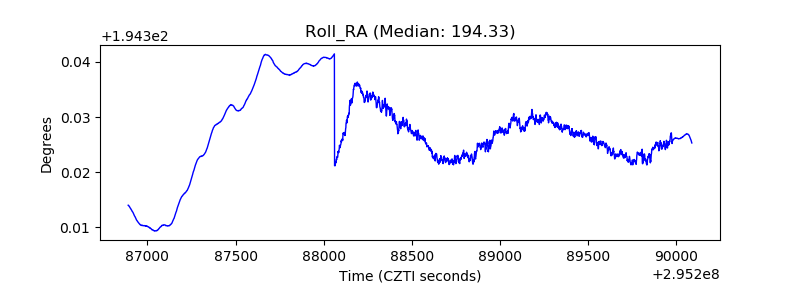 |
| Veto Counter | 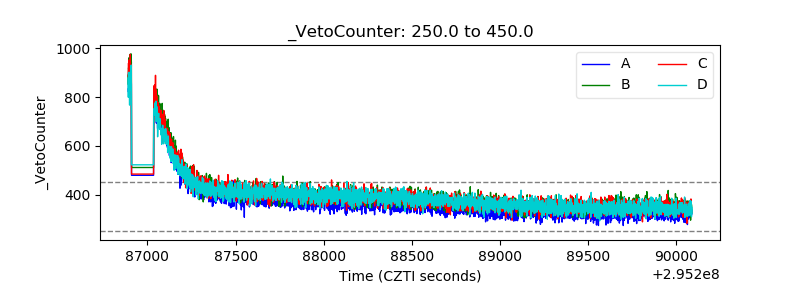 |