| Param | Original file | Final file |
|---|---|---|
| Filename | modeM0/AS1A05_142T01_9000002904_19538cztM0_level2.evt | modeM0/AS1A05_142T01_9000002904_19538cztM0_level2_quad_clean.evt |
| Size (bytes) | 138,559,680 | 42,894,720 |
| Size | 132.1 MB | 40.9 MB |
| Events in quadrant A | 998,884 | 296,540 |
| Events in quadrant B | 1,015,523 | 300,756 |
| Events in quadrant C | 1,072,509 | 280,351 |
| Events in quadrant D | 976,844 | 281,887 |
| Mode SS | |||
|---|---|---|---|
| Quadrant | BADHDUFLAG | Total packets | Discarded packets |
| A | 0 | 43 | 3 |
| B | 0 | 42 | 0 |
| C | 0 | 42 | 2 |
| D | 0 | 42 | 2 |
| Mode M0 | |||
|---|---|---|---|
| Quadrant | BADHDUFLAG | Total packets | Discarded packets |
| A | 0 | 4225 | 150 |
| B | 0 | 4280 | 132 |
| C | 0 | 4541 | 188 |
| D | 0 | 4252 | 141 |
| Mode M9 | |||
|---|---|---|---|
| Quadrant | BADHDUFLAG | Total packets | Discarded packets |
| A | 0 | 11 | 0 |
| B | 0 | 11 | 0 |
| C | 0 | 11 | 0 |
| D | 0 | 11 | 0 |
| Quadrant | Total seconds | Saturated seconds | Saturation percentage |
|---|---|---|---|
| A | 1905 | 16 | 0.839895% |
| B | 1917 | 33 | 1.721440% |
| C | 1902 | 31 | 1.629863% |
| D | 1911 | 9 | 0.470958% |
Noise dominated data is calculated using 1-second bins in cleaned event files. If a bin has >2000 counts, and if more than 50% of those come from <1% of pixels, then it is considered to be noise-dominated and hence unusable.
| Quadrant | # 1 sec bins | Bins with >0 counts | Bins with >2000 counts | High rate bins dominated by noise | Noise dominated (total time) | Noise dominated (detector-on time) | Marked lightcurve |
|---|---|---|---|---|---|---|---|
| A | 3149 | 1948 | 0 | 0 | 0.00% | 0.00% | 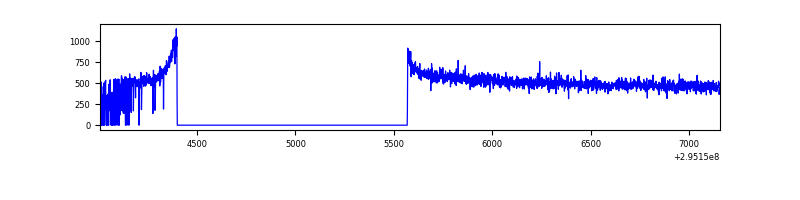 |
| B | 3149 | 1955 | 0 | 0 | 0.00% | 0.00% | 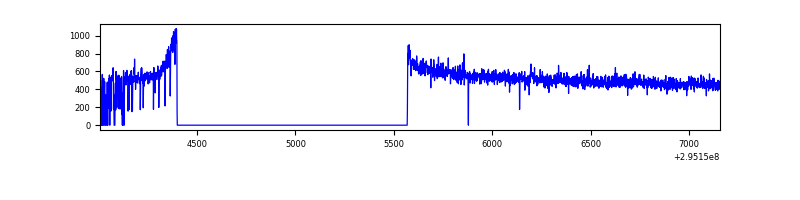 |
| C | 3147 | 1955 | 0 | 0 | 0.00% | 0.00% | 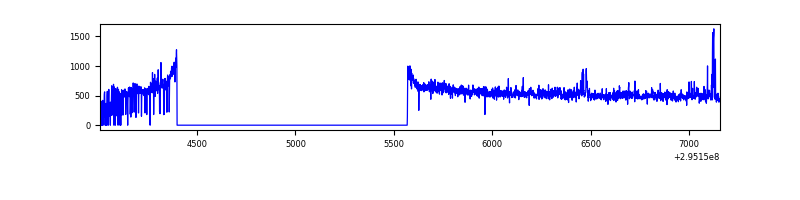 |
| D | 3149 | 1955 | 1 | 1 | 0.03% | 0.05% | 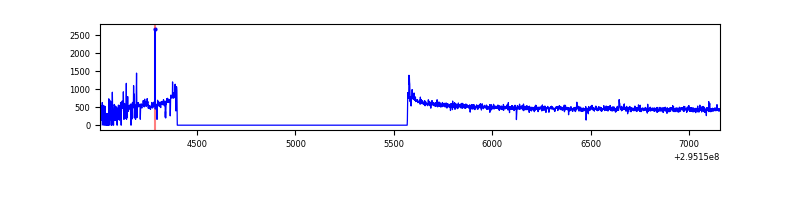 |
Top three noisy pixels from each quadrant. If the there are fewer than three noisy pixels in the level2.evt file, extra rows are filled as -1
| Pixel properties | Quadrant properties | ||||||
|---|---|---|---|---|---|---|---|
| Quadrant | DetID | PixID | Counts | Sigma | Mean | Median | Sigma |
| A | 0 | 226 | 2239 | 37.15 | 259 | 255 | 53.4 |
| A | 13 | 254 | 2151 | 35.5 | 259 | 255 | 53.4 |
| A | 3 | 137 | 1841 | 29.7 | 259 | 255 | 53.4 |
| B | 12 | 111 | 5672 | 107.88 | 258 | 252 | 50.2 |
| B | 11 | 111 | 4940 | 93.31 | 258 | 252 | 50.2 |
| B | 14 | 111 | 4625 | 87.04 | 258 | 252 | 50.2 |
| C | 3 | 233 | 58420 | 992.53 | 245 | 246 | 58.6 |
| C | 14 | 238 | 39315 | 666.57 | 245 | 246 | 58.6 |
| C | 5 | 112 | 18397 | 309.68 | 245 | 246 | 58.6 |
| D | 12 | 218 | 11583 | 183.9 | 250 | 243 | 61.7 |
| D | 15 | 0 | 10173 | 161.04 | 250 | 243 | 61.7 |
| D | 2 | 234 | 5819 | 90.43 | 250 | 243 | 61.7 |
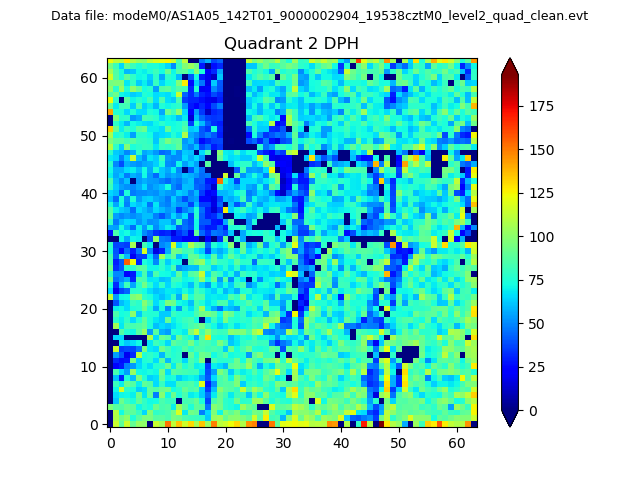
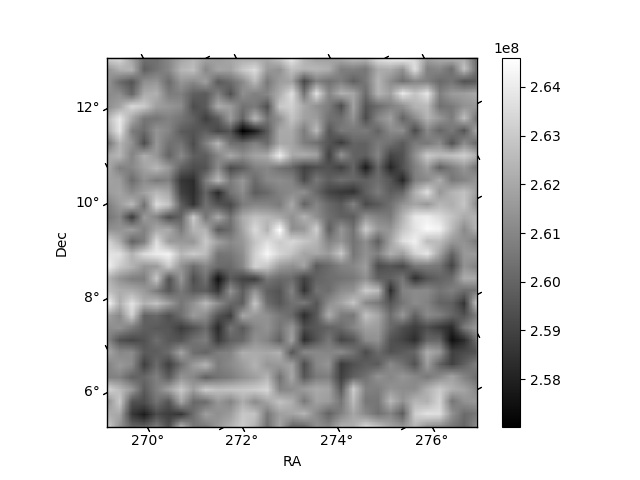
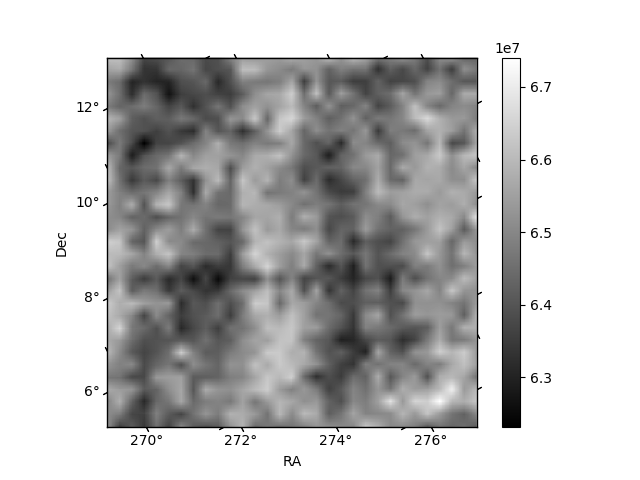
Histogram calculated using DETX and DETY for each event in the final _common_clean file
| Quadrant A | 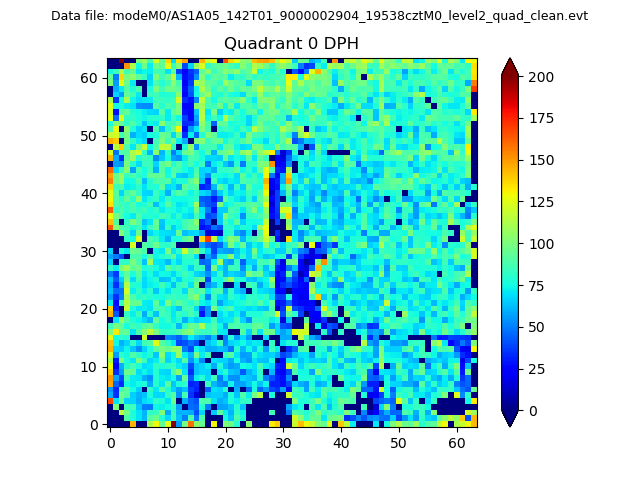 |
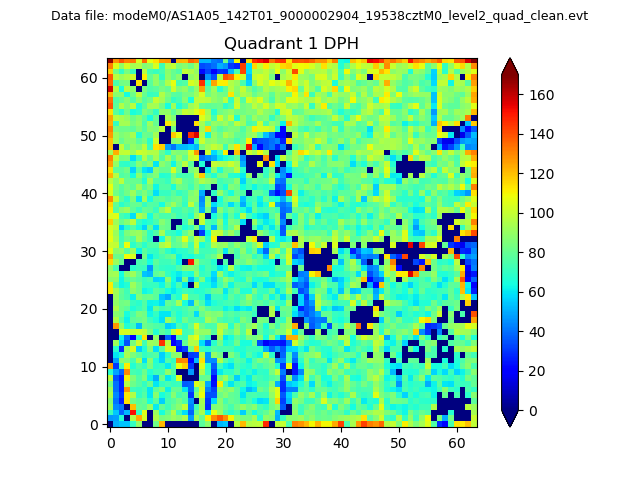 |
Quadrant B |
|---|---|---|---|
| Quadrant D | 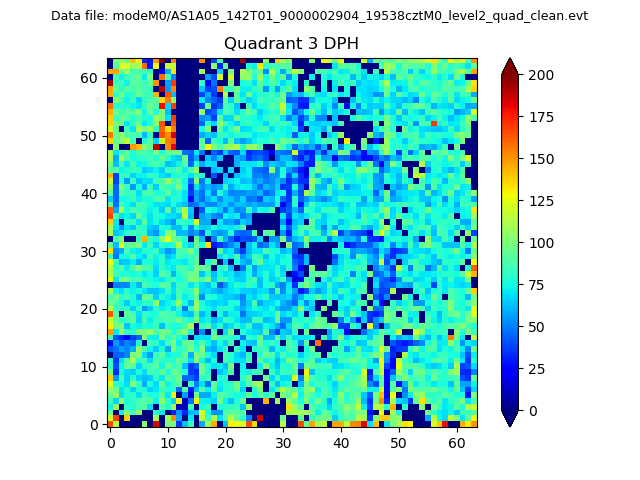 |
 |
Quadrant C |
| Plot type | Count rate plots | Images |
|---|---|---|
| Comparison with Poisson distribution Blue bars denote a histogram of data divided into 1 sec bins. Red curve is a Poisson curve with rate = median count rate of data. |
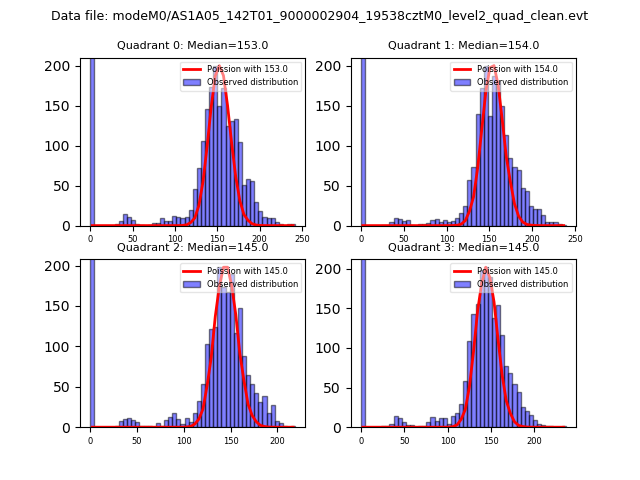 |
 |
| Quadrant-wise count rates Data is divided into 100 sec bins |
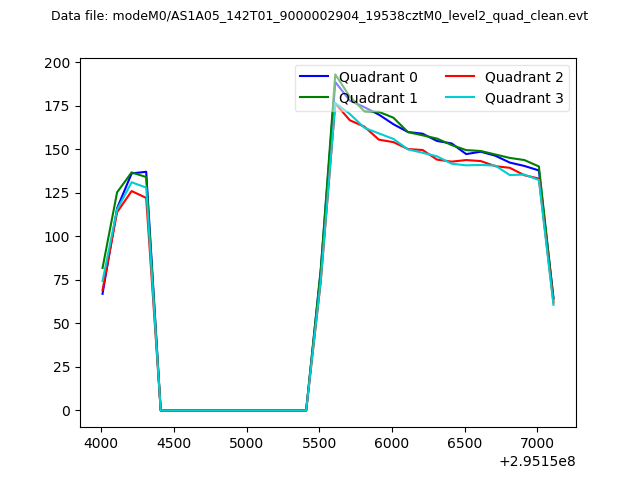 |
|
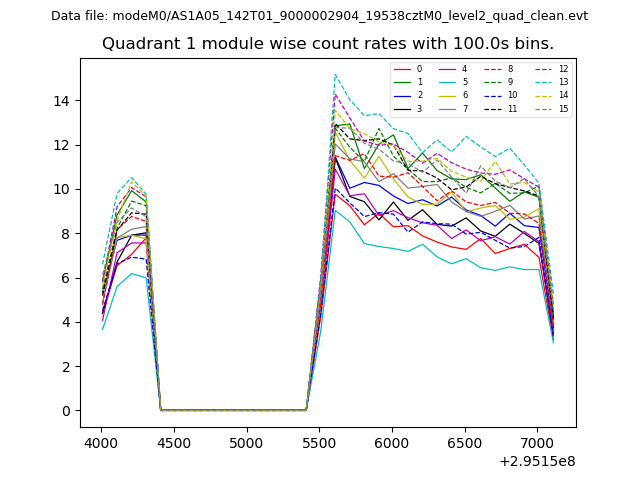
| Module-wise count rates for Quadrant A Data is divided into 100 sec bins |
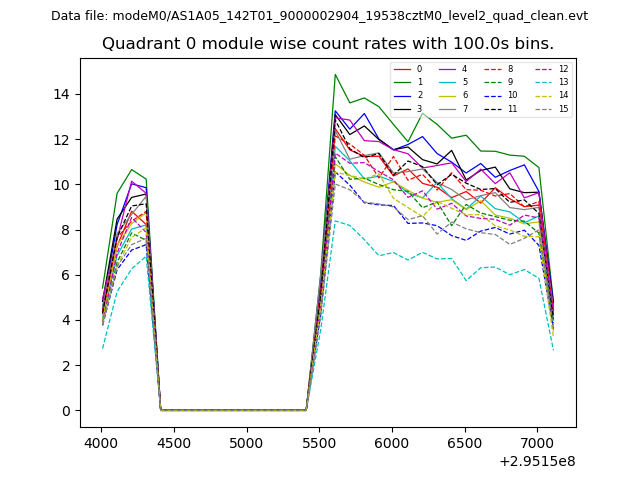 |
 |
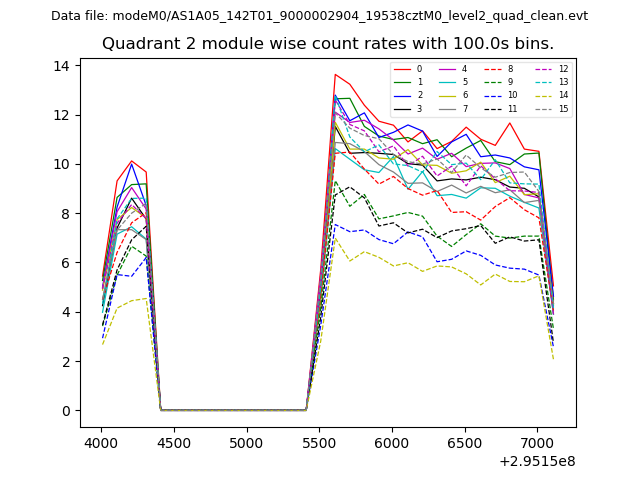
| Module-wise count rates for Quadrant B Data is divided into 100 sec bins |
 |
 |
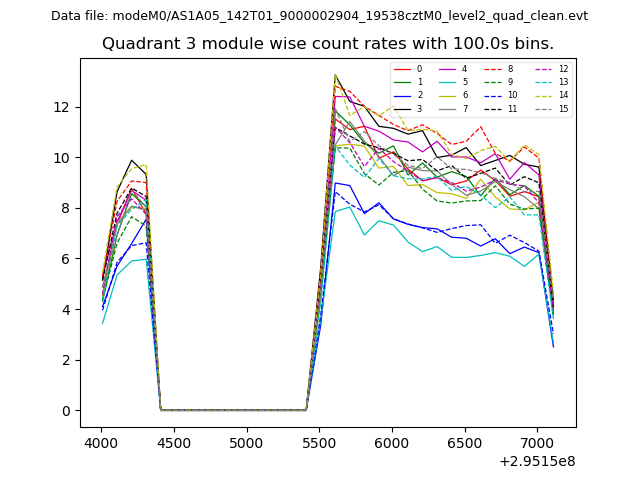
| Module-wise count rates for Quadrant C Data is divided into 100 sec bins |
 |
 |
| Module-wise count rates for Quadrant D Data is divided into 100 sec bins |
 |
 |
| Parameter | Plot |
|---|---|
| CZT HV Monitor | 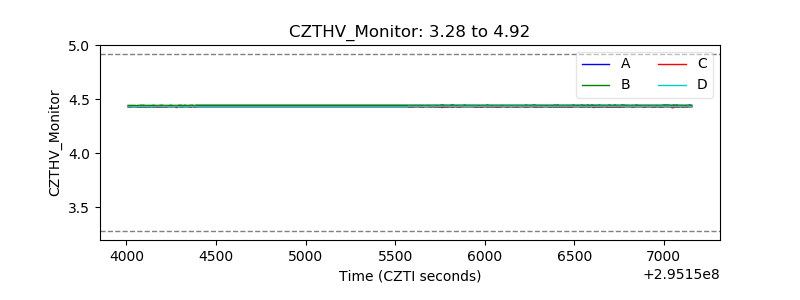 |
| D_VDD | 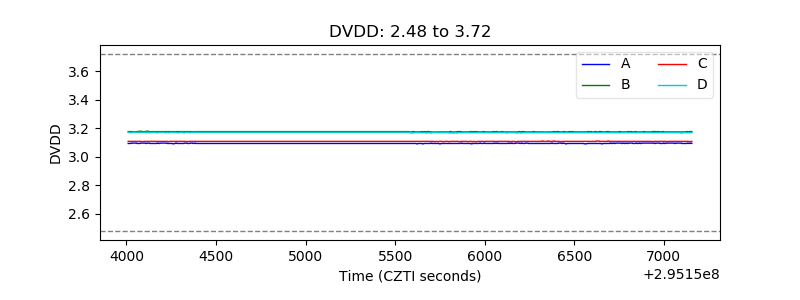 |
| Temperature 1 | 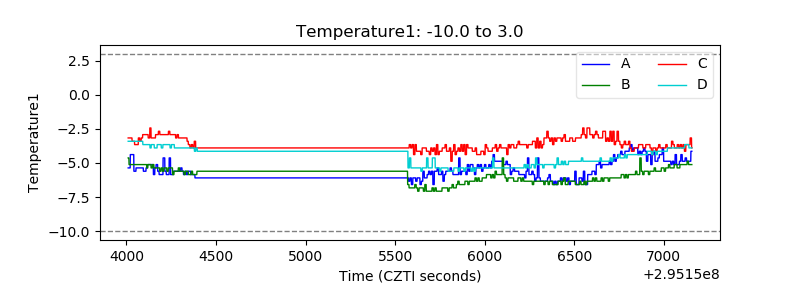 |
| Veto HV Monitor | 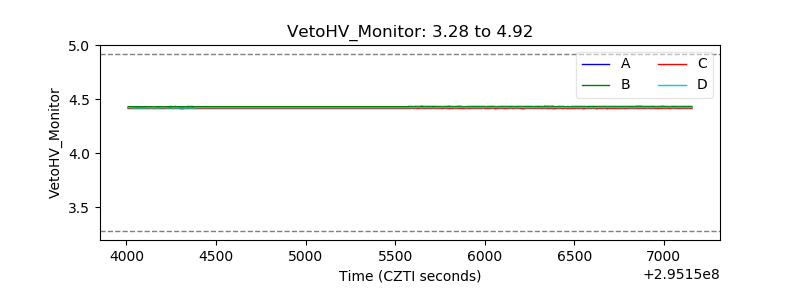 |
| Veto LLD | 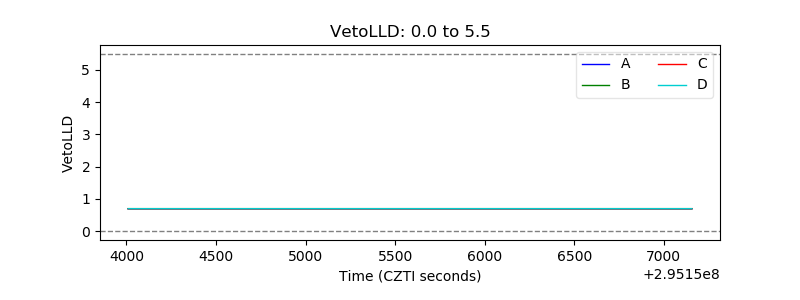 |
| Alpha Counter | 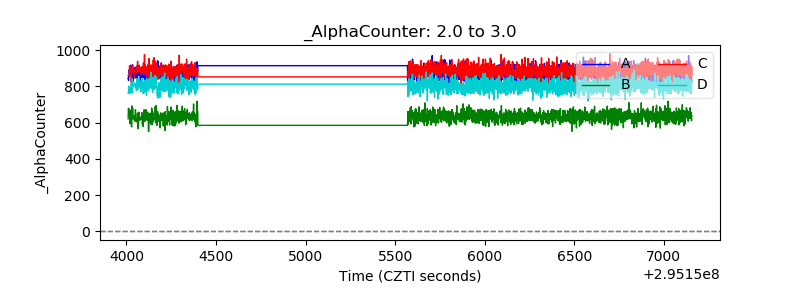 |
| _CPM_Rate | 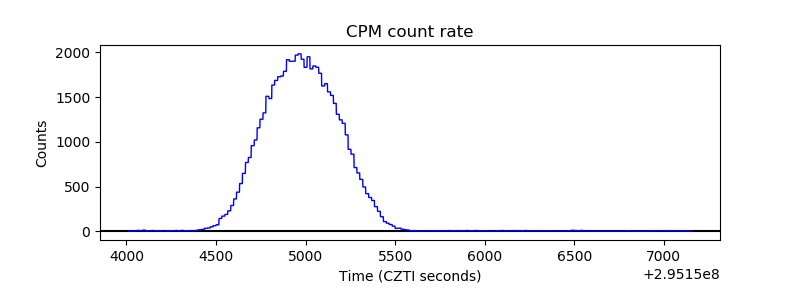 |
| CZT Counter | 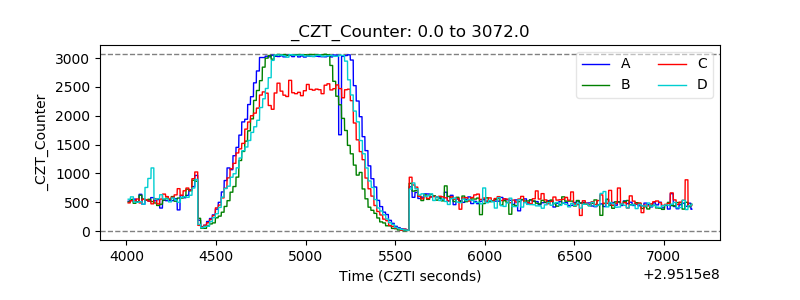 |
| +2.5 Volts monitor | 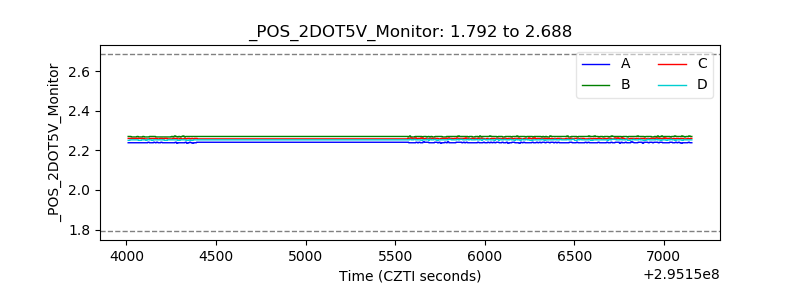 |
| +5 Volts monitor |  |
| _ROLL_ROT | 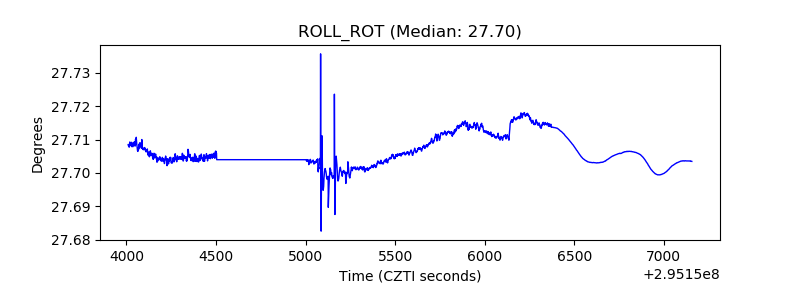 |
| _Roll_DEC | 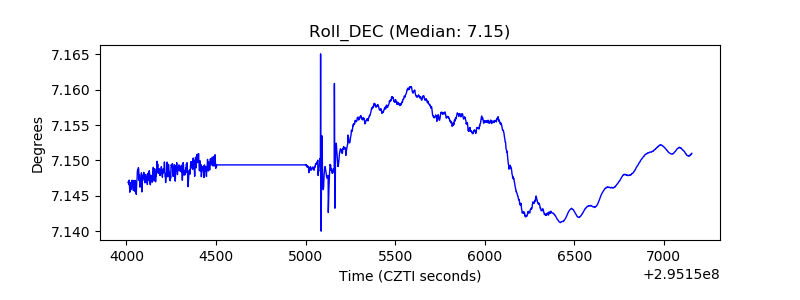 |
| _Roll_RA | 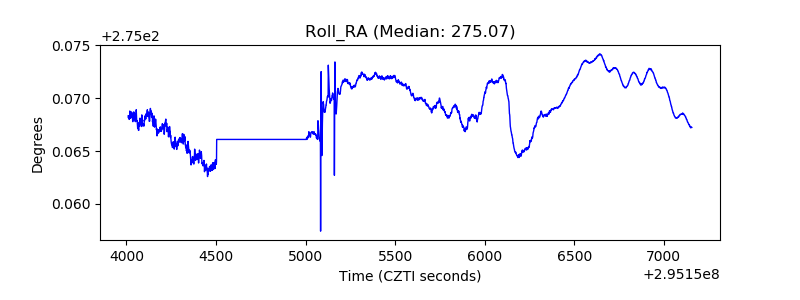 |
| Veto Counter | 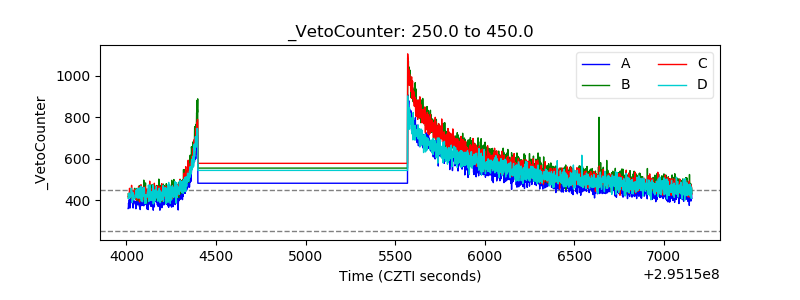 |