| Param | Original file | Final file |
|---|---|---|
| Filename | modeM0/AS1A05_142T01_9000002904_19539cztM0_level2.evt | modeM0/AS1A05_142T01_9000002904_19539cztM0_level2_quad_clean.evt |
| Size (bytes) | 419,806,080 | 83,105,280 |
| Size | 400.4 MB | 79.3 MB |
| Events in quadrant A | 2,980,485 | 539,639 |
| Events in quadrant B | 3,165,205 | 543,752 |
| Events in quadrant C | 3,225,892 | 510,793 |
| Events in quadrant D | 2,941,597 | 510,605 |
| Mode SS | |||
|---|---|---|---|
| Quadrant | BADHDUFLAG | Total packets | Discarded packets |
| A | 0 | 120 | 0 |
| B | 0 | 120 | 0 |
| C | 0 | 120 | 0 |
| D | 0 | 120 | 0 |
| Mode M0 | |||
|---|---|---|---|
| Quadrant | BADHDUFLAG | Total packets | Discarded packets |
| A | 0 | 12252 | 1 |
| B | 0 | 12812 | 1 |
| C | 0 | 13120 | 1 |
| D | 0 | 12431 | 1 |
| Mode M9 | |||
|---|---|---|---|
| Quadrant | BADHDUFLAG | Total packets | Discarded packets |
| A | 0 | 13 | 0 |
| B | 0 | 13 | 0 |
| C | 0 | 13 | 0 |
| D | 0 | 13 | 0 |
| Quadrant | Total seconds | Saturated seconds | Saturation percentage |
|---|---|---|---|
| A | 5893 | 36 | 0.610894% |
| B | 5894 | 105 | 1.781473% |
| C | 5894 | 74 | 1.255514% |
| D | 5894 | 37 | 0.627757% |
Noise dominated data is calculated using 1-second bins in cleaned event files. If a bin has >2000 counts, and if more than 50% of those come from <1% of pixels, then it is considered to be noise-dominated and hence unusable.
| Quadrant | # 1 sec bins | Bins with >0 counts | Bins with >2000 counts | High rate bins dominated by noise | Noise dominated (total time) | Noise dominated (detector-on time) | Marked lightcurve |
|---|---|---|---|---|---|---|---|
| A | 7153 | 5893 | 0 | 0 | 0.00% | 0.00% | 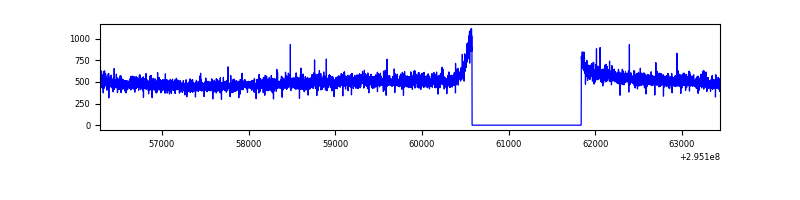 |
| B | 7154 | 5895 | 40 | 40 | 0.56% | 0.68% | 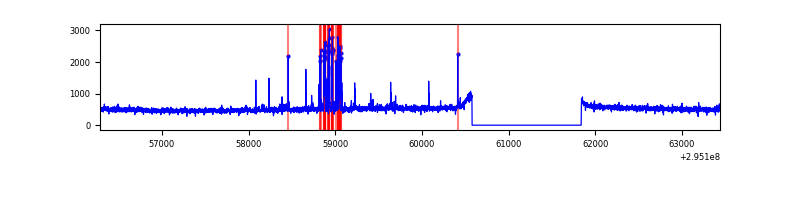 |
| C | 7154 | 5895 | 9 | 9 | 0.13% | 0.15% | 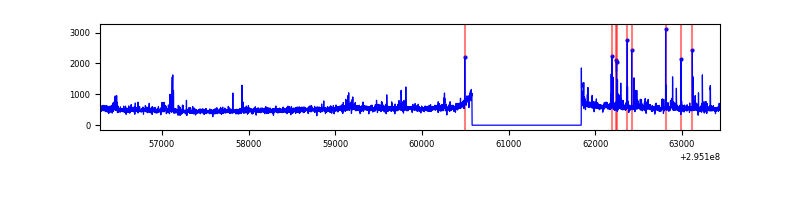 |
| D | 7154 | 5895 | 10 | 10 | 0.14% | 0.17% | 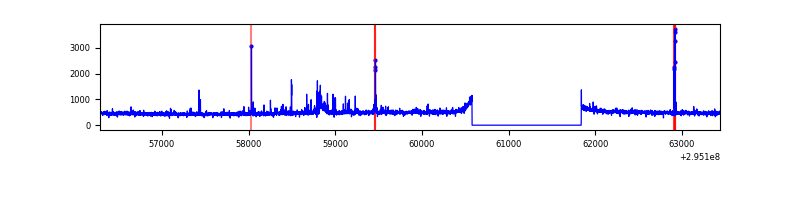 |
Top three noisy pixels from each quadrant. If the there are fewer than three noisy pixels in the level2.evt file, extra rows are filled as -1
| Pixel properties | Quadrant properties | ||||||
|---|---|---|---|---|---|---|---|
| Quadrant | DetID | PixID | Counts | Sigma | Mean | Median | Sigma |
| A | 0 | 226 | 6778 | 38.93 | 774 | 761 | 154.6 |
| A | 13 | 254 | 6367 | 36.27 | 774 | 761 | 154.6 |
| A | 3 | 137 | 5827 | 32.78 | 774 | 761 | 154.6 |
| B | 7 | 220 | 140735 | 971.28 | 759 | 743 | 144.1 |
| B | 0 | 244 | 21165 | 141.69 | 759 | 743 | 144.1 |
| B | 12 | 111 | 16689 | 110.63 | 759 | 743 | 144.1 |
| C | 3 | 233 | 154371 | 917.49 | 722 | 730 | 167.5 |
| C | 5 | 112 | 127638 | 757.85 | 722 | 730 | 167.5 |
| C | 14 | 238 | 115465 | 685.16 | 722 | 730 | 167.5 |
| D | 1 | 52 | 56715 | 314.7 | 743 | 725 | 177.9 |
| D | 12 | 218 | 32490 | 178.54 | 743 | 725 | 177.9 |
| D | 2 | 234 | 21614 | 117.41 | 743 | 725 | 177.9 |
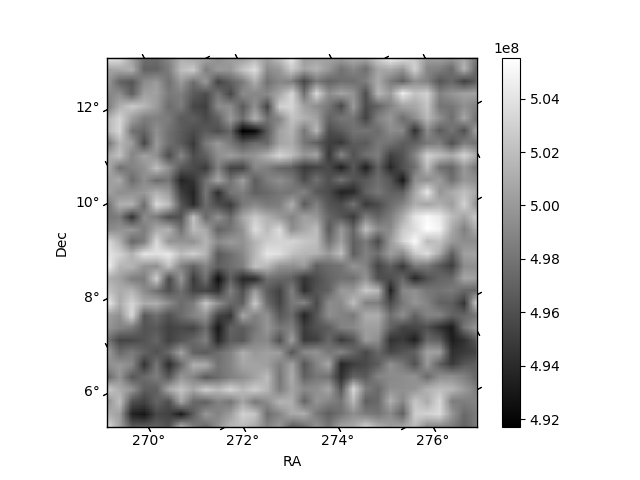
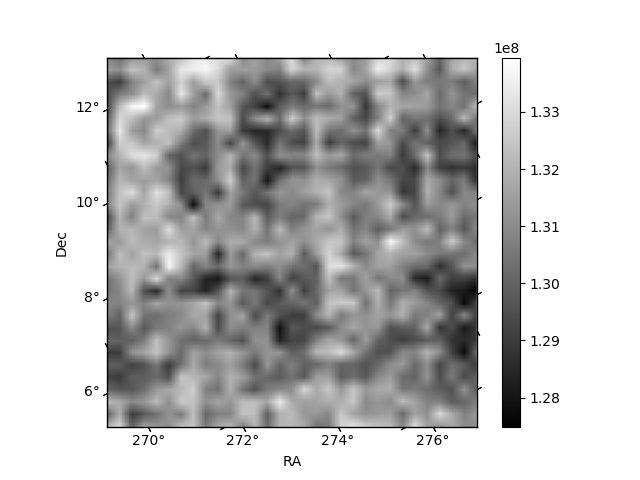
Histogram calculated using DETX and DETY for each event in the final _common_clean file
| Quadrant A | 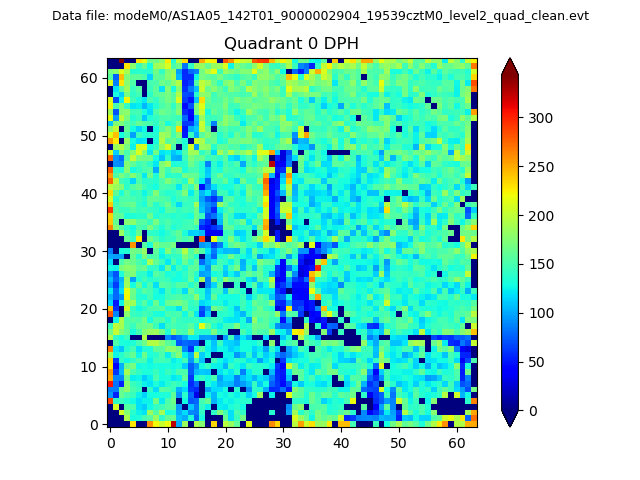 |
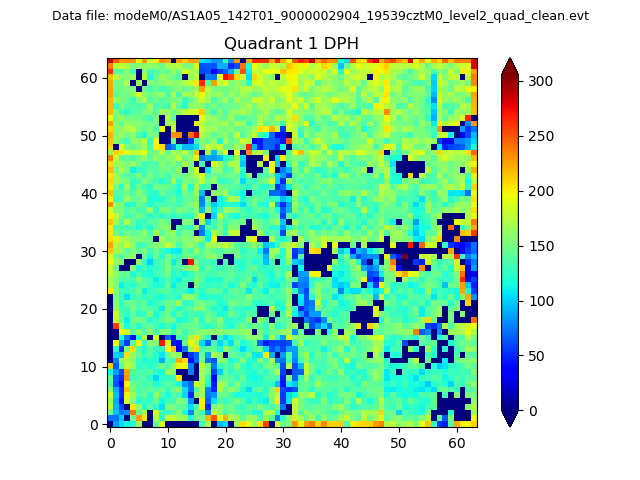 |
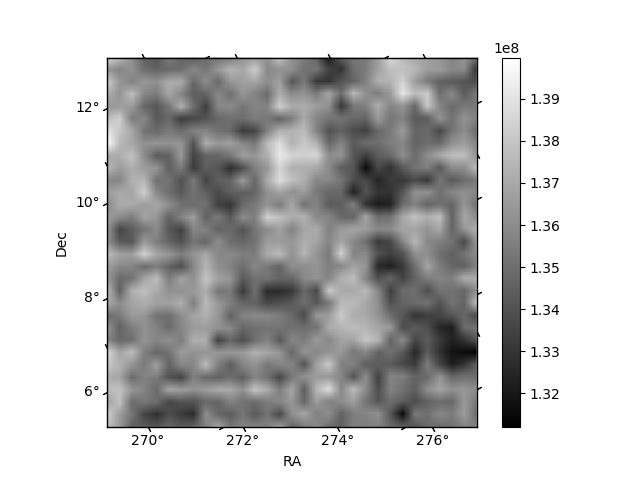
Quadrant B |
|---|---|---|---|
| Quadrant D | 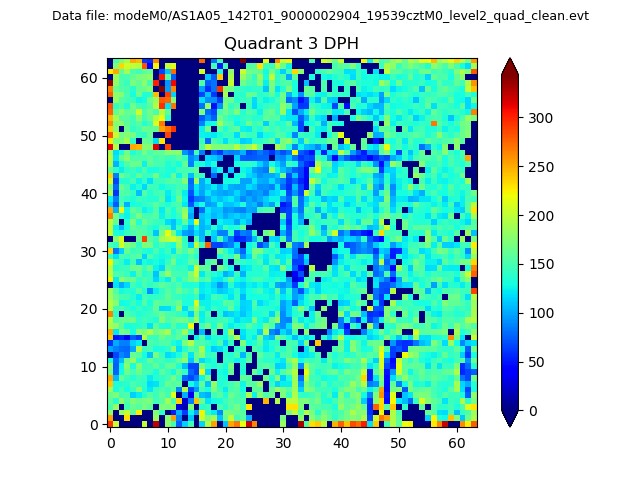 |
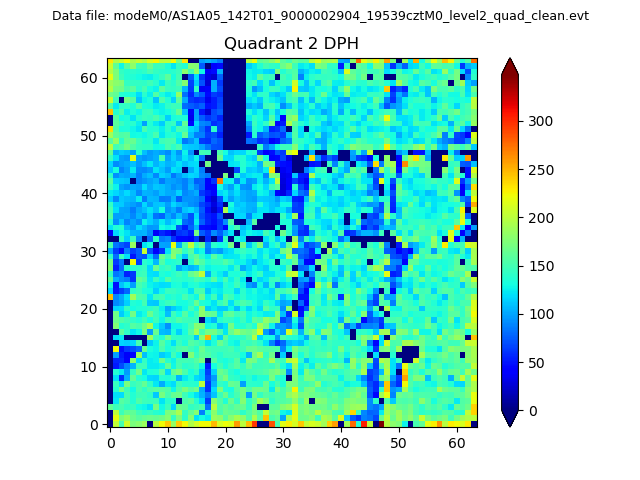 |
Quadrant C |
| Plot type | Count rate plots | Images |
|---|---|---|
| Comparison with Poisson distribution Blue bars denote a histogram of data divided into 1 sec bins. Red curve is a Poisson curve with rate = median count rate of data. |
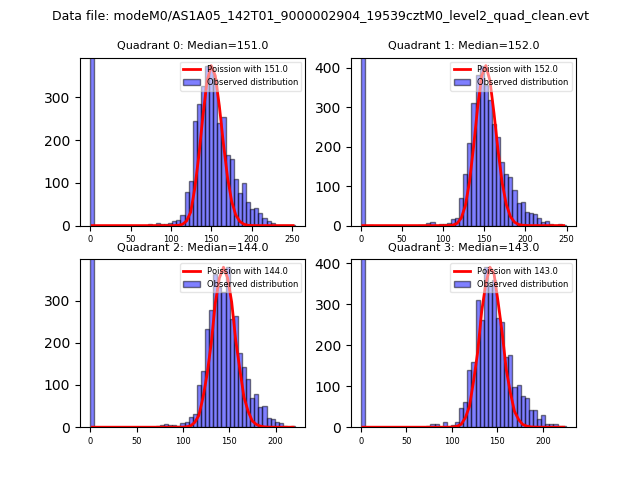 |
 |
| Quadrant-wise count rates Data is divided into 100 sec bins |
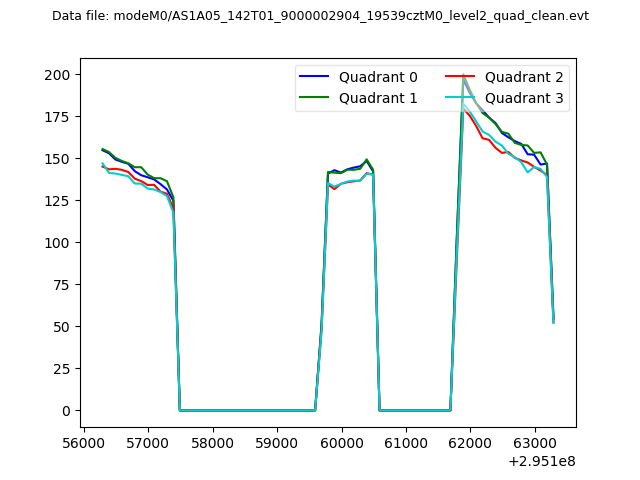 |
|
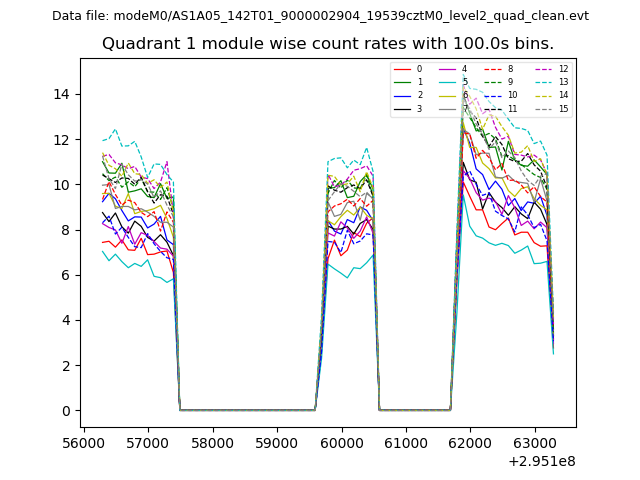
| Module-wise count rates for Quadrant A Data is divided into 100 sec bins |
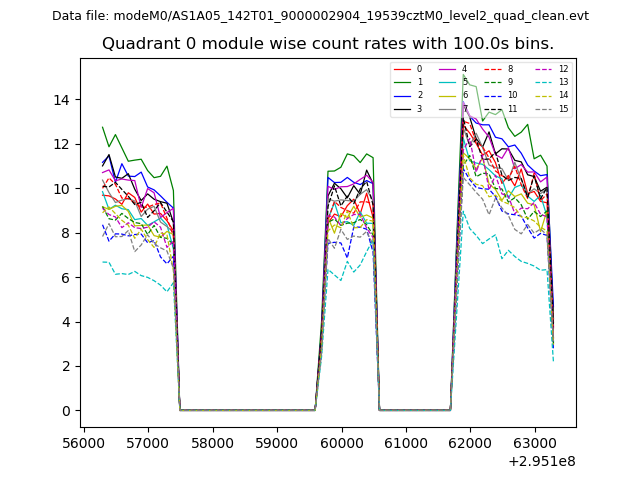 |
 |
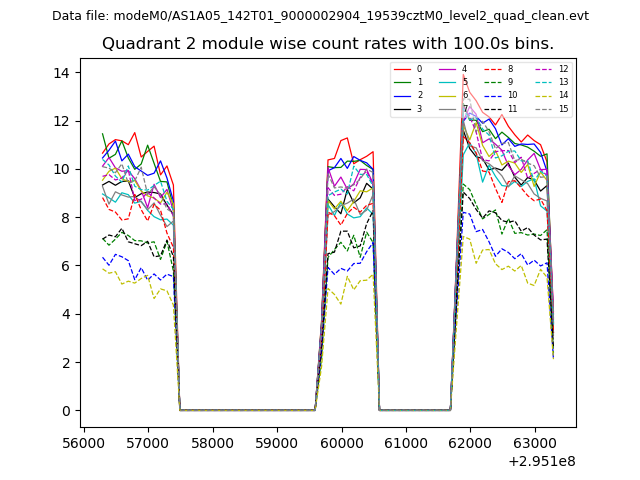
| Module-wise count rates for Quadrant B Data is divided into 100 sec bins |
 |
 |
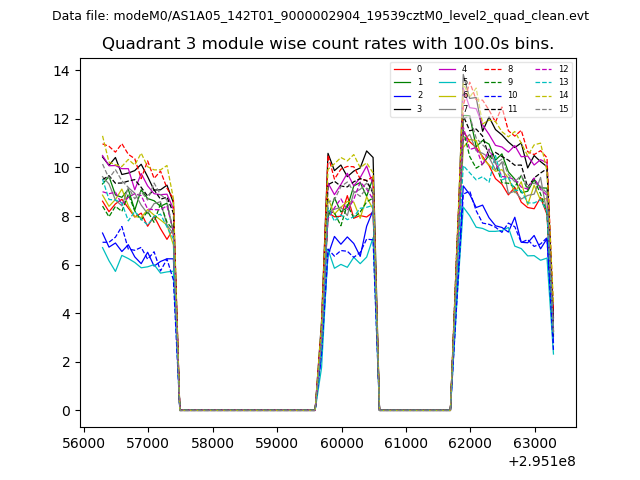
| Module-wise count rates for Quadrant C Data is divided into 100 sec bins |
 |
 |
| Module-wise count rates for Quadrant D Data is divided into 100 sec bins |
 |
 |
| Parameter | Plot |
|---|---|
| CZT HV Monitor | 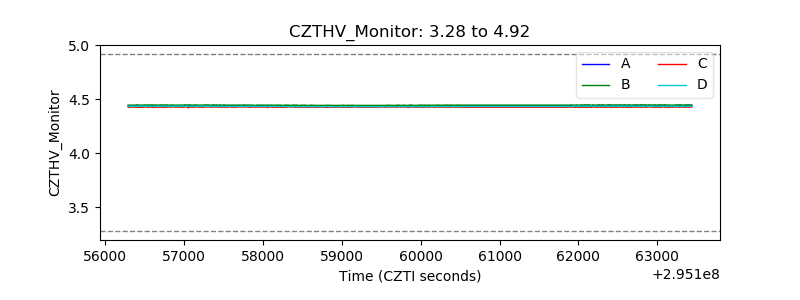 |
| D_VDD | 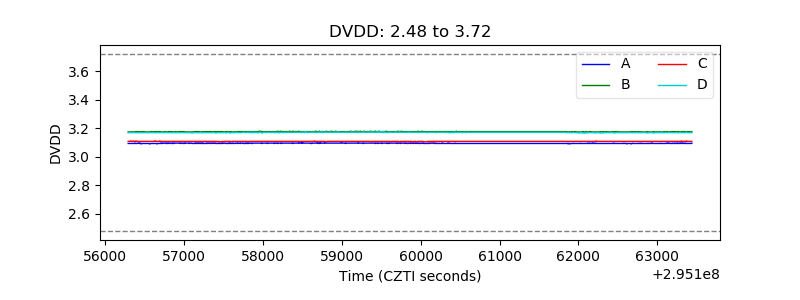 |
| Temperature 1 | 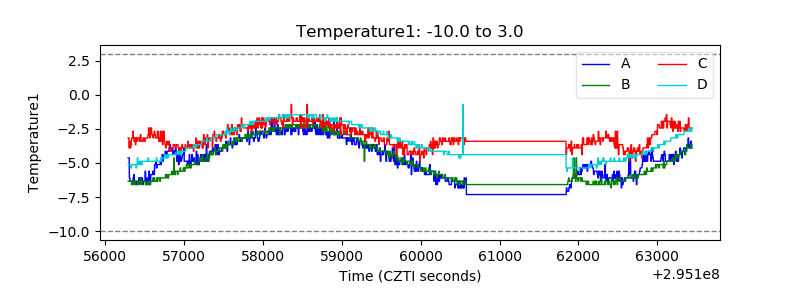 |
| Veto HV Monitor | 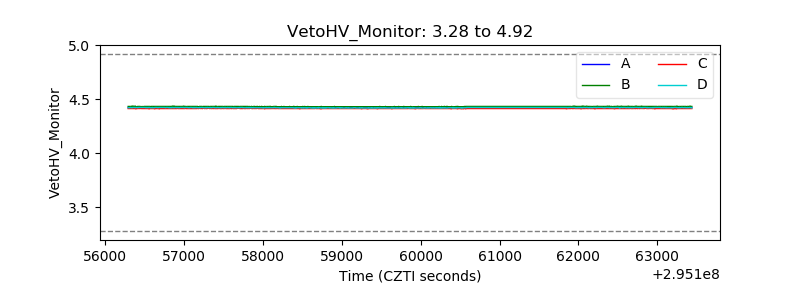 |
| Veto LLD | 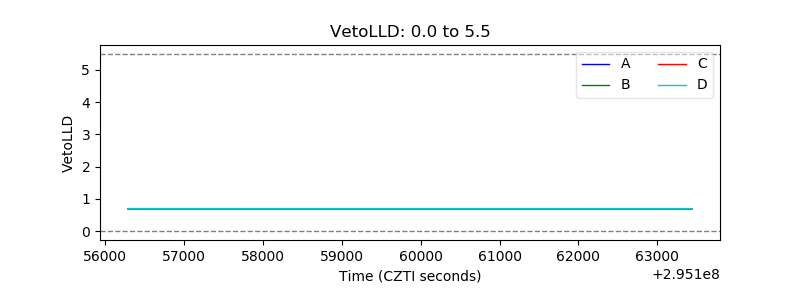 |
| Alpha Counter | 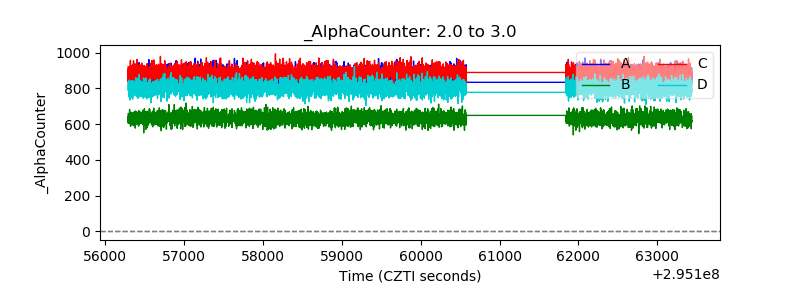 |
| _CPM_Rate | 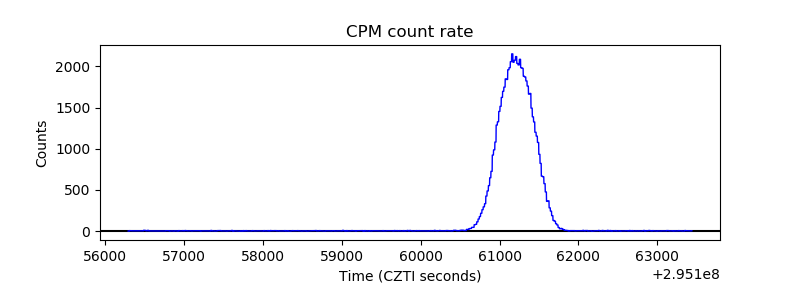 |
| CZT Counter | 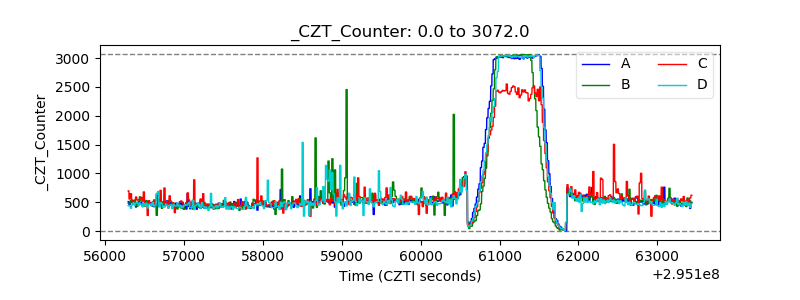 |
| +2.5 Volts monitor |  |
| +5 Volts monitor |  |
| _ROLL_ROT | 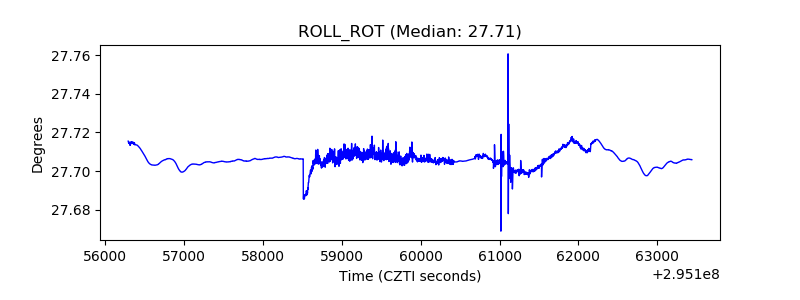 |
| _Roll_DEC | 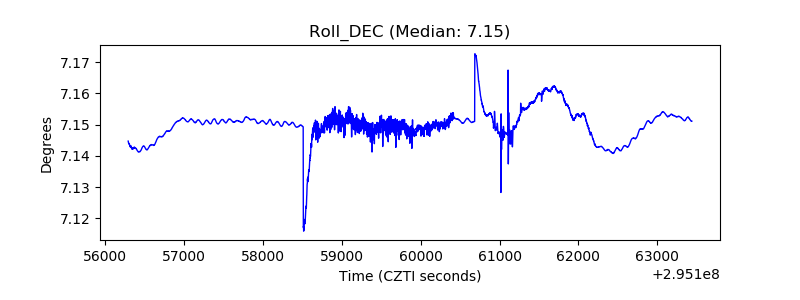 |
| _Roll_RA | 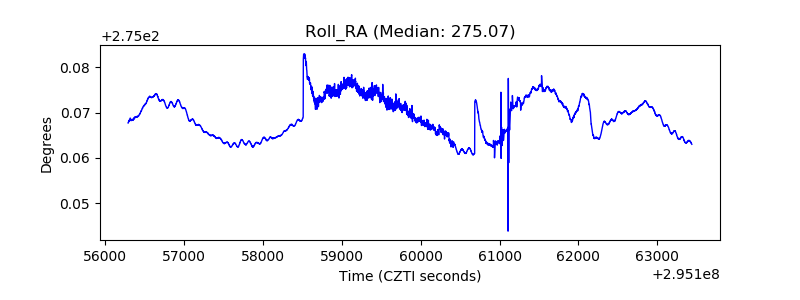 |
| Veto Counter | 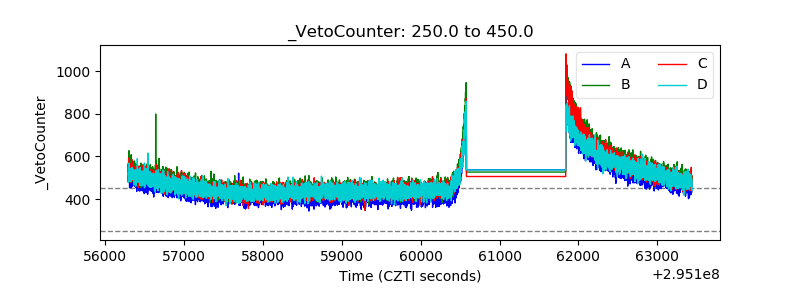 |