| Param | Original file | Final file |
|---|---|---|
| Filename | modeM0/AS1A05_142T01_9000002904_19540cztM0_level2.evt | modeM0/AS1A05_142T01_9000002904_19540cztM0_level2_quad_clean.evt |
| Size (bytes) | 1,230,966,720 | 224,320,320 |
| Size | 1.1 GB | 213.9 MB |
| Events in quadrant A | 8,591,143 | 1,441,493 |
| Events in quadrant B | 9,060,954 | 1,455,731 |
| Events in quadrant C | 9,388,294 | 1,372,768 |
| Events in quadrant D | 9,100,680 | 1,361,885 |
| Mode SS | |||
|---|---|---|---|
| Quadrant | BADHDUFLAG | Total packets | Discarded packets |
| A | 0 | 346 | 0 |
| B | 0 | 346 | 0 |
| C | 0 | 346 | 0 |
| D | 0 | 346 | 0 |
| Mode M0 | |||
|---|---|---|---|
| Quadrant | BADHDUFLAG | Total packets | Discarded packets |
| A | 0 | 35396 | 4 |
| B | 0 | 36852 | 4 |
| C | 0 | 38059 | 4 |
| D | 0 | 37789 | 4 |
| Mode M9 | |||
|---|---|---|---|
| Quadrant | BADHDUFLAG | Total packets | Discarded packets |
| A | 0 | 47 | 0 |
| B | 0 | 47 | 0 |
| C | 0 | 47 | 0 |
| D | 0 | 47 | 0 |
| Quadrant | Total seconds | Saturated seconds | Saturation percentage |
|---|---|---|---|
| A | 16852 | 163 | 0.967244% |
| B | 16852 | 306 | 1.815808% |
| C | 16852 | 270 | 1.602184% |
| D | 16852 | 232 | 1.376691% |
Noise dominated data is calculated using 1-second bins in cleaned event files. If a bin has >2000 counts, and if more than 50% of those come from <1% of pixels, then it is considered to be noise-dominated and hence unusable.
| Quadrant | # 1 sec bins | Bins with >0 counts | Bins with >2000 counts | High rate bins dominated by noise | Noise dominated (total time) | Noise dominated (detector-on time) | Marked lightcurve |
|---|---|---|---|---|---|---|---|
| A | 21617 | 16853 | 4 | 4 | 0.02% | 0.02% | 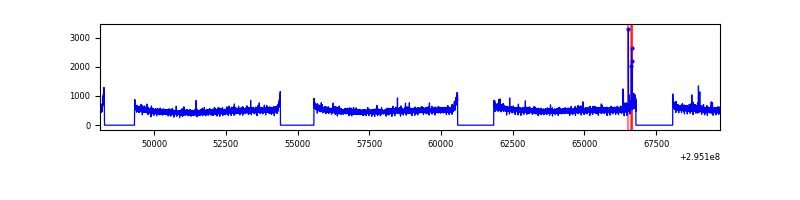 |
| B | 21617 | 16854 | 62 | 62 | 0.29% | 0.37% | 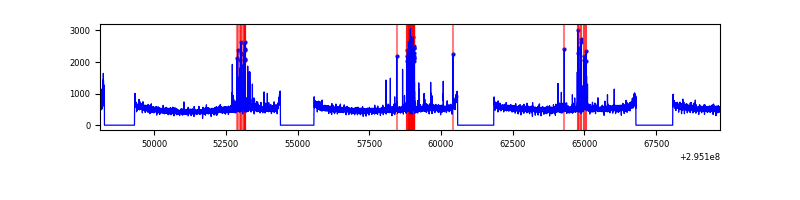 |
| C | 21617 | 16854 | 17 | 17 | 0.08% | 0.10% | 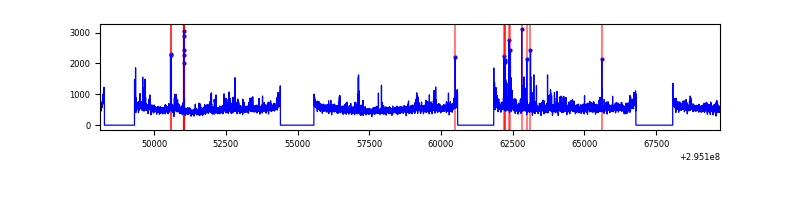 |
| D | 21617 | 16855 | 99 | 99 | 0.46% | 0.59% | 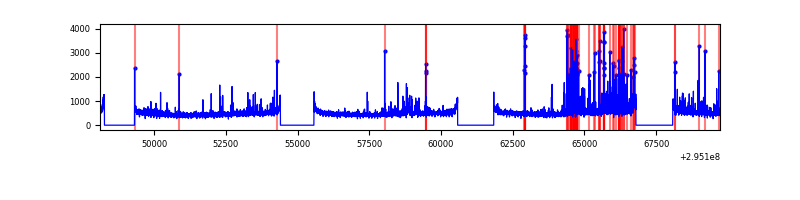 |
Top three noisy pixels from each quadrant. If the there are fewer than three noisy pixels in the level2.evt file, extra rows are filled as -1
| Pixel properties | Quadrant properties | ||||||
|---|---|---|---|---|---|---|---|
| Quadrant | DetID | PixID | Counts | Sigma | Mean | Median | Sigma |
| A | 5 | 16 | 46595 | 100.24 | 2220 | 2182 | 443.1 |
| A | 13 | 254 | 20690 | 41.77 | 2220 | 2182 | 443.1 |
| A | 0 | 226 | 19128 | 38.25 | 2220 | 2182 | 443.1 |
| B | 7 | 220 | 275131 | 672.91 | 2186 | 2140 | 405.7 |
| B | 0 | 244 | 128023 | 310.29 | 2186 | 2140 | 405.7 |
| B | 12 | 111 | 48505 | 114.29 | 2186 | 2140 | 405.7 |
| C | 3 | 233 | 711840 | 1477.13 | 2083 | 2104 | 480.5 |
| C | 14 | 238 | 330011 | 682.45 | 2083 | 2104 | 480.5 |
| C | 5 | 112 | 185693 | 382.09 | 2083 | 2104 | 480.5 |
| D | 1 | 52 | 751016 | 1454.24 | 2138 | 2082 | 515.0 |
| D | 12 | 218 | 90191 | 171.08 | 2138 | 2082 | 515.0 |
| D | 12 | 225 | 68284 | 128.55 | 2138 | 2082 | 515.0 |
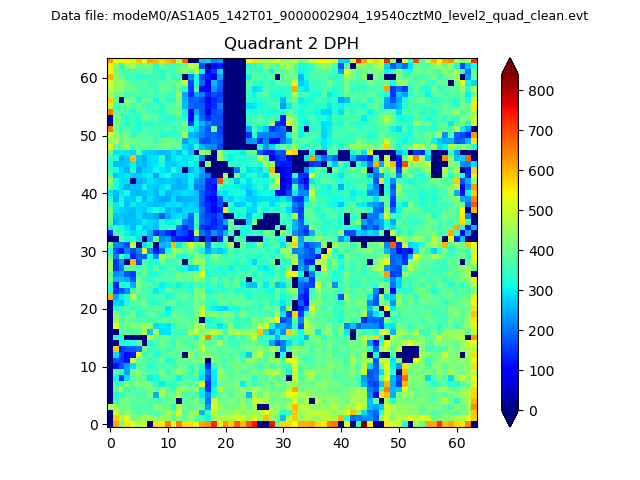
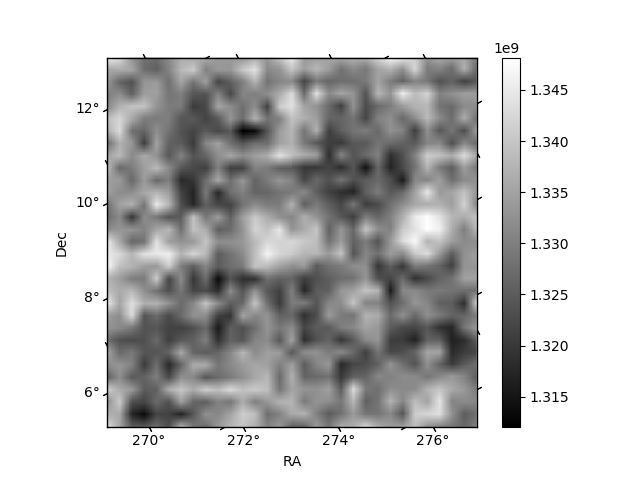
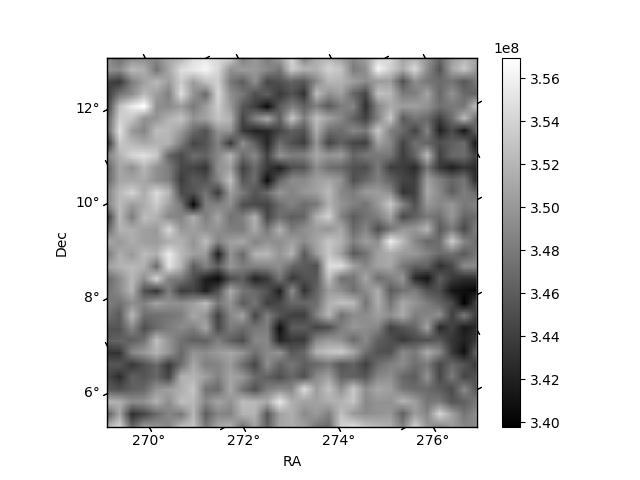
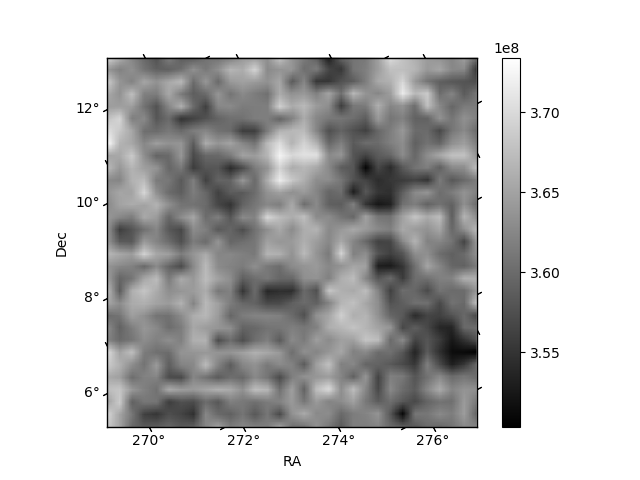
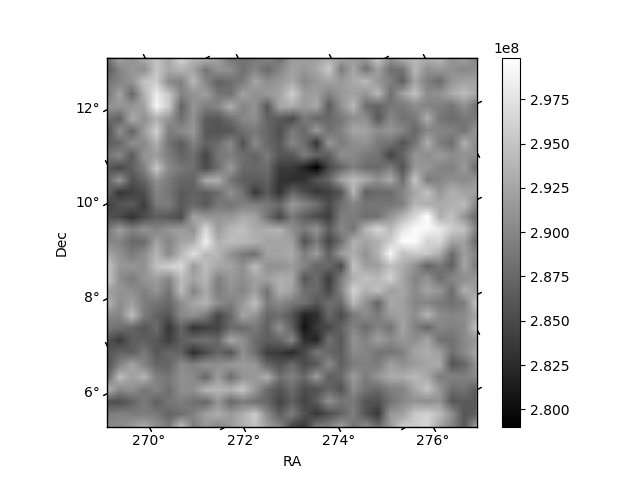
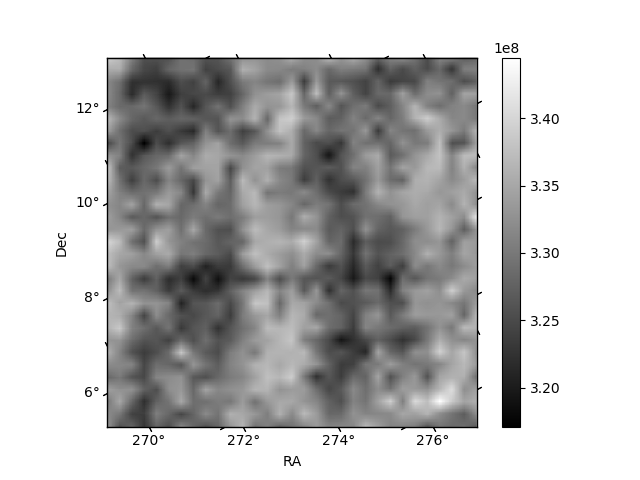
Histogram calculated using DETX and DETY for each event in the final _common_clean file
| Quadrant A | 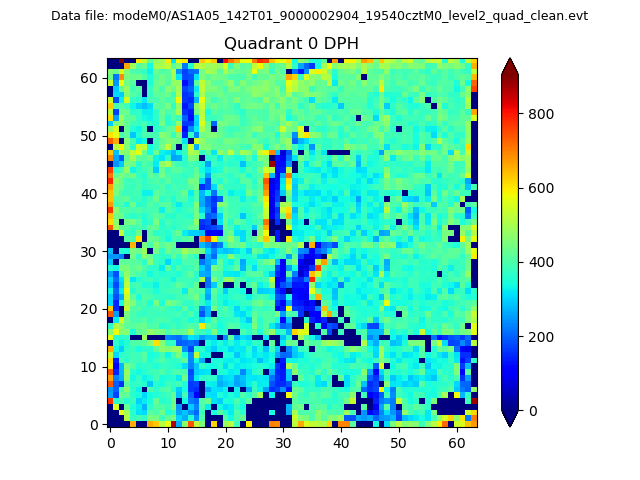 |
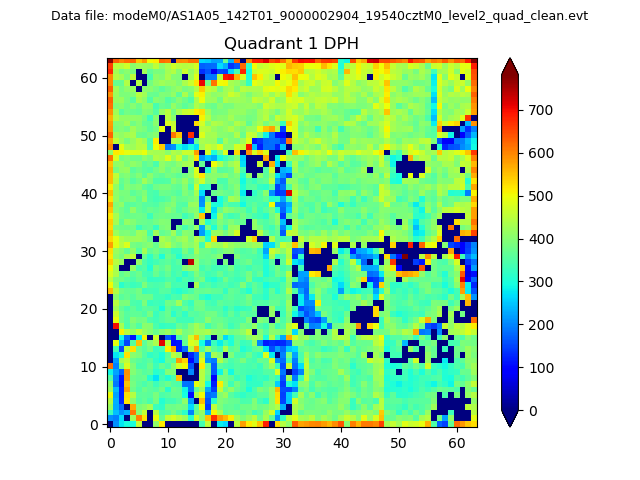 |
Quadrant B |
|---|---|---|---|
| Quadrant D | 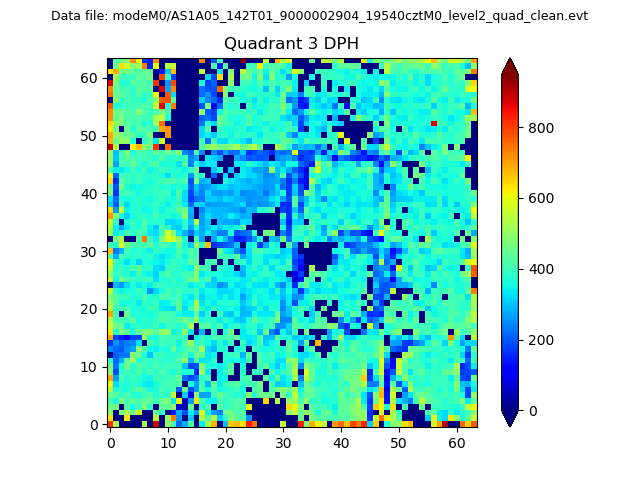 |
 |
Quadrant C |
| Plot type | Count rate plots | Images |
|---|---|---|
| Comparison with Poisson distribution Blue bars denote a histogram of data divided into 1 sec bins. Red curve is a Poisson curve with rate = median count rate of data. |
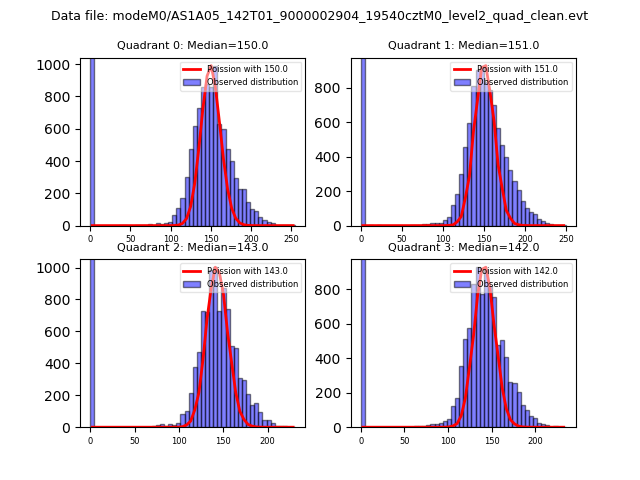 |
 |
| Quadrant-wise count rates Data is divided into 100 sec bins |
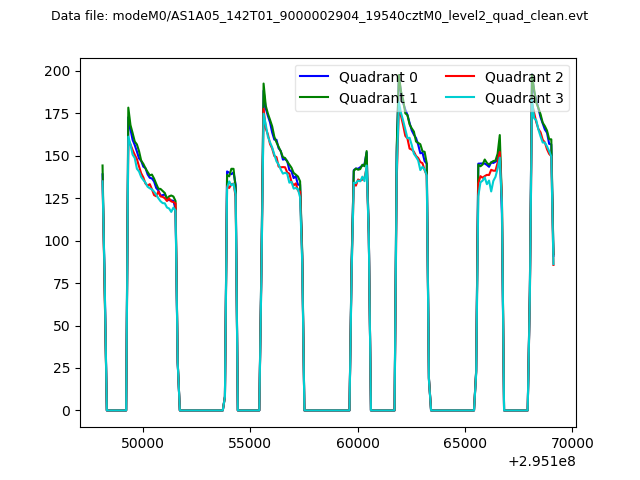 |
|
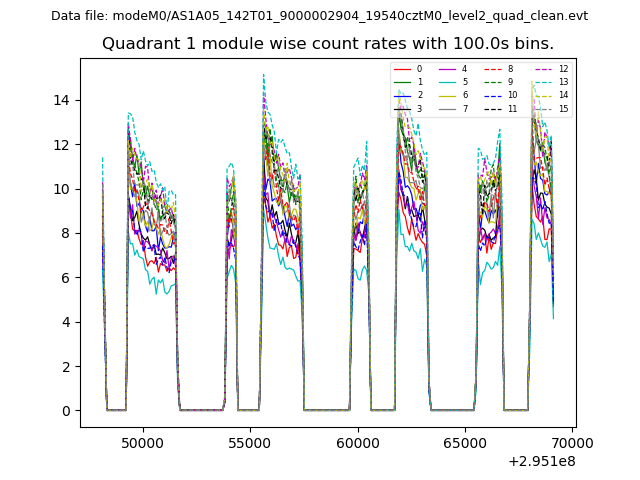
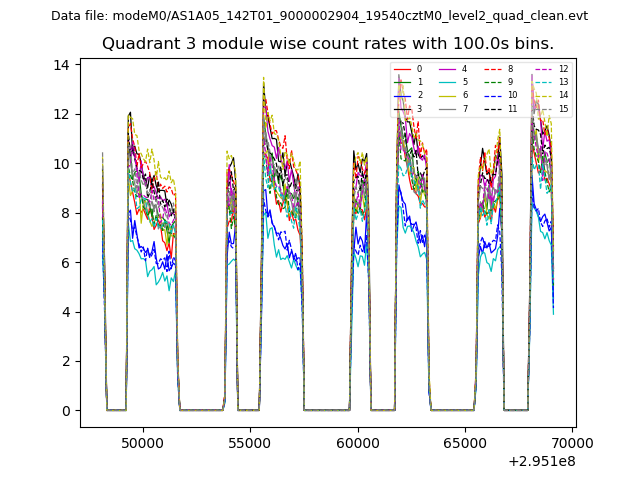
| Module-wise count rates for Quadrant A Data is divided into 100 sec bins |
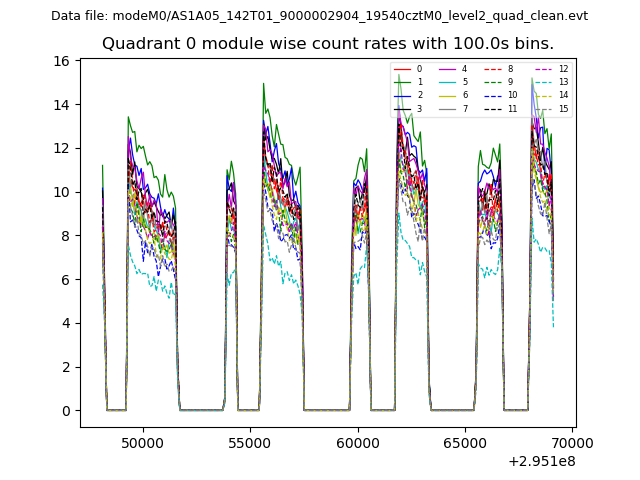 |
 |
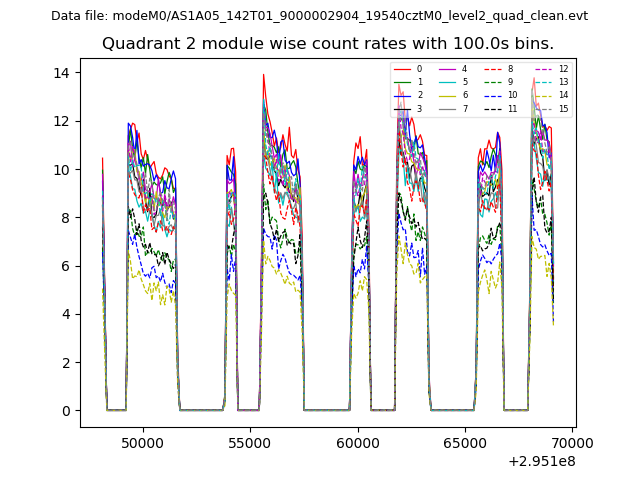
| Module-wise count rates for Quadrant B Data is divided into 100 sec bins |
 |
 |
| Module-wise count rates for Quadrant C Data is divided into 100 sec bins |
 |
 |
| Module-wise count rates for Quadrant D Data is divided into 100 sec bins |
 |
 |
| Parameter | Plot |
|---|---|
| CZT HV Monitor | 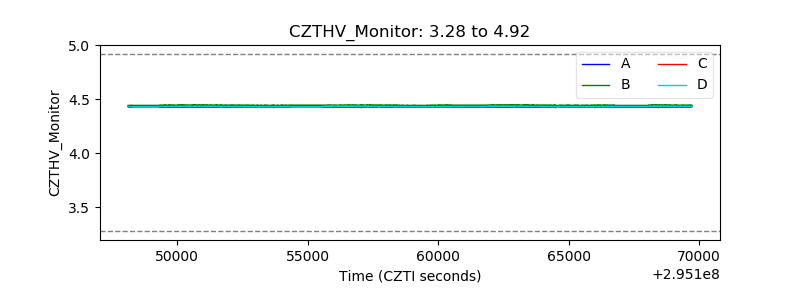 |
| D_VDD | 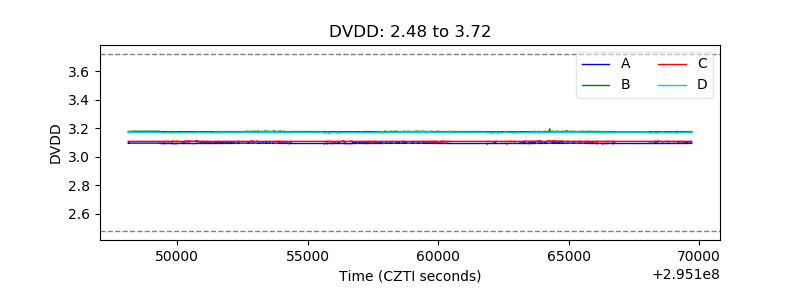 |
| Temperature 1 | 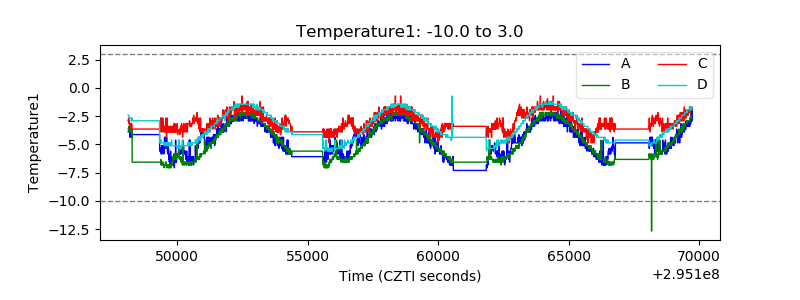 |
| Veto HV Monitor | 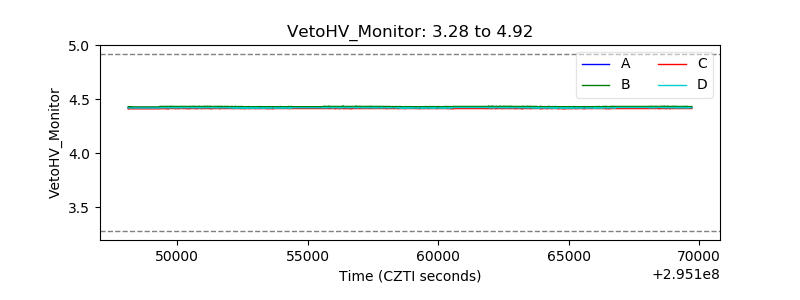 |
| Veto LLD | 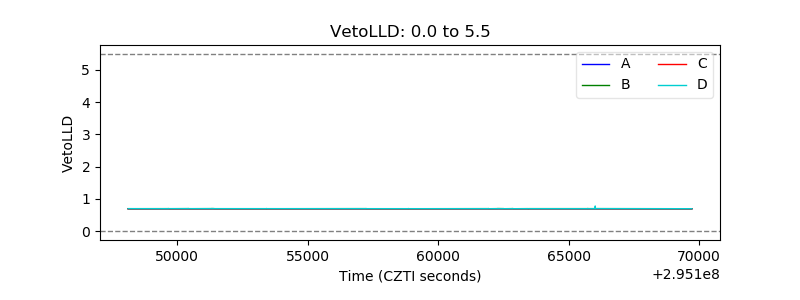 |
| Alpha Counter | 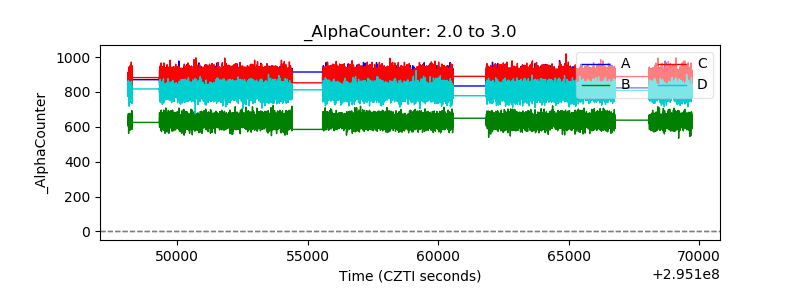 |
| _CPM_Rate | 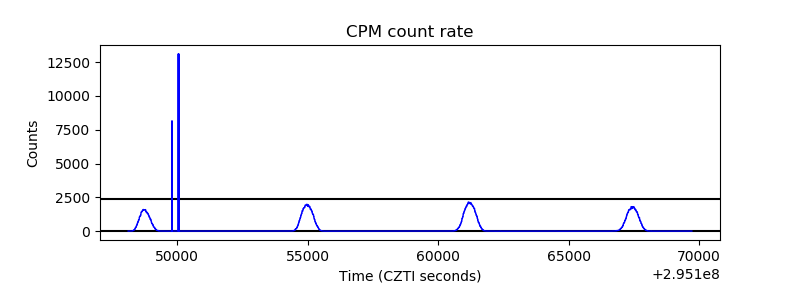 |
| CZT Counter | 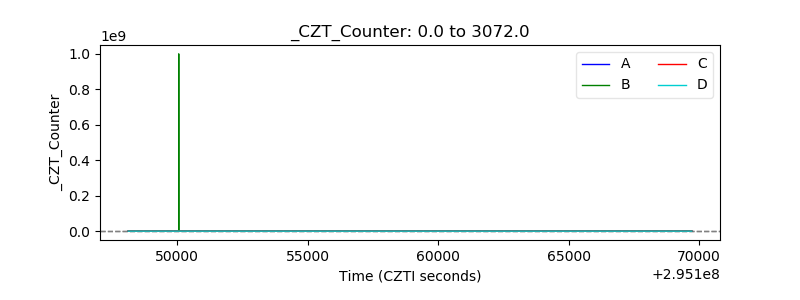 |
| +2.5 Volts monitor |  |
| +5 Volts monitor | 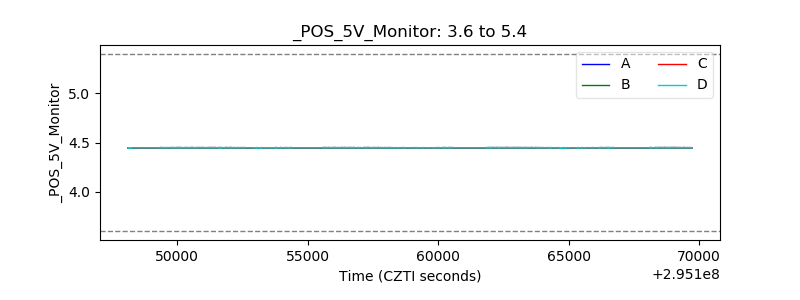 |
| _ROLL_ROT | 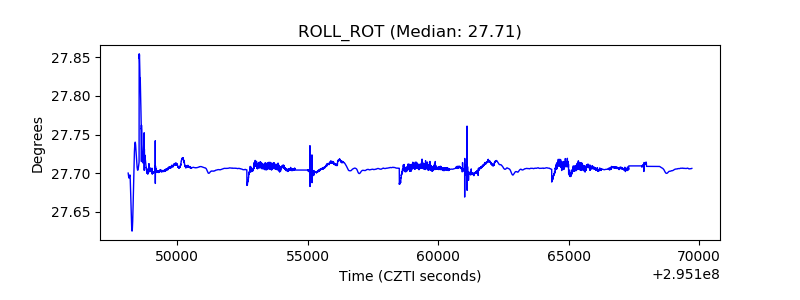 |
| _Roll_DEC | 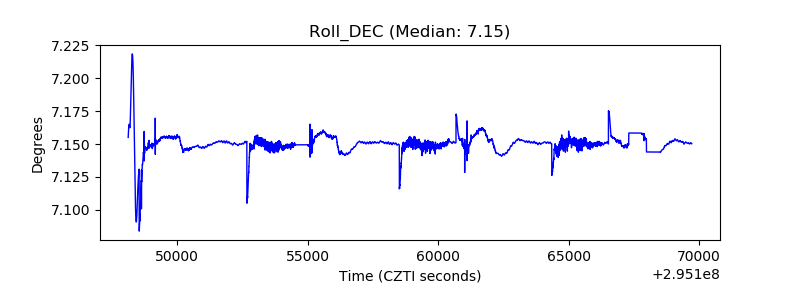 |
| _Roll_RA | 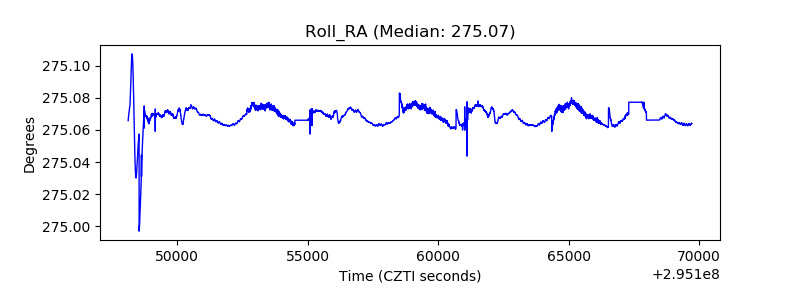 |
| Veto Counter | 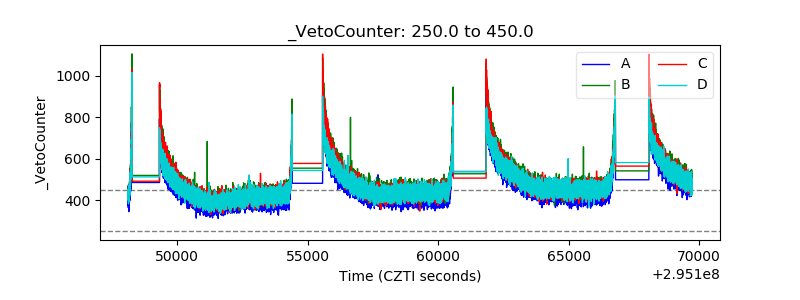 |