| Param | Original file | Final file |
|---|---|---|
| Filename | modeM0/AS1A05_142T01_9000002904_19542cztM0_level2.evt | modeM0/AS1A05_142T01_9000002904_19542cztM0_level2_quad_clean.evt |
| Size (bytes) | 468,342,720 | 69,834,240 |
| Size | 446.6 MB | 66.6 MB |
| Events in quadrant A | 3,288,247 | 422,307 |
| Events in quadrant B | 3,469,373 | 427,007 |
| Events in quadrant C | 3,409,448 | 408,767 |
| Events in quadrant D | 3,577,993 | 405,814 |
| Mode SS | |||
|---|---|---|---|
| Quadrant | BADHDUFLAG | Total packets | Discarded packets |
| A | 0 | 132 | 0 |
| B | 0 | 132 | 0 |
| C | 0 | 132 | 0 |
| D | 0 | 132 | 0 |
| Mode M0 | |||
|---|---|---|---|
| Quadrant | BADHDUFLAG | Total packets | Discarded packets |
| A | 0 | 13395 | 1 |
| B | 0 | 13935 | 1 |
| C | 0 | 13784 | 1 |
| D | 0 | 14541 | 1 |
| Mode M9 | |||
|---|---|---|---|
| Quadrant | BADHDUFLAG | Total packets | Discarded packets |
| A | 0 | 11 | 0 |
| B | 0 | 11 | 0 |
| C | 0 | 11 | 0 |
| D | 0 | 11 | 0 |
| Quadrant | Total seconds | Saturated seconds | Saturation percentage |
|---|---|---|---|
| A | 6457 | 97 | 1.502246% |
| B | 6458 | 136 | 2.105915% |
| C | 6458 | 114 | 1.765252% |
| D | 6458 | 109 | 1.687829% |
Noise dominated data is calculated using 1-second bins in cleaned event files. If a bin has >2000 counts, and if more than 50% of those come from <1% of pixels, then it is considered to be noise-dominated and hence unusable.
| Quadrant | # 1 sec bins | Bins with >0 counts | Bins with >2000 counts | High rate bins dominated by noise | Noise dominated (total time) | Noise dominated (detector-on time) | Marked lightcurve |
|---|---|---|---|---|---|---|---|
| A | 7587 | 6457 | 0 | 0 | 0.00% | 0.00% | 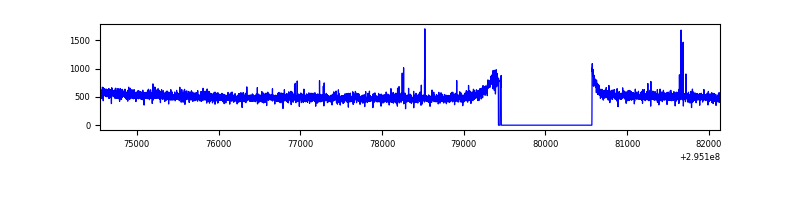 |
| B | 7588 | 6458 | 22 | 22 | 0.29% | 0.34% | 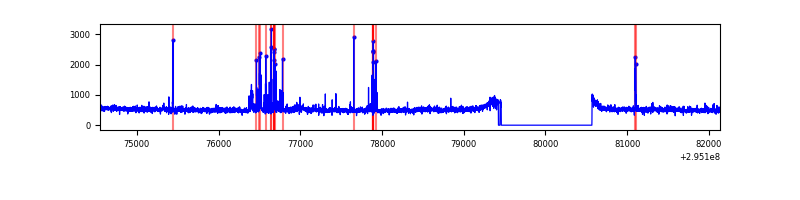 |
| C | 7588 | 6459 | 2 | 2 | 0.03% | 0.03% | 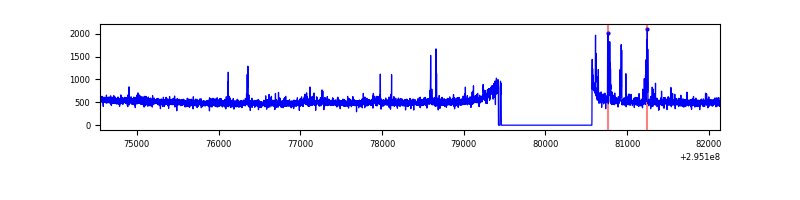 |
| D | 7588 | 6459 | 15 | 15 | 0.20% | 0.23% | 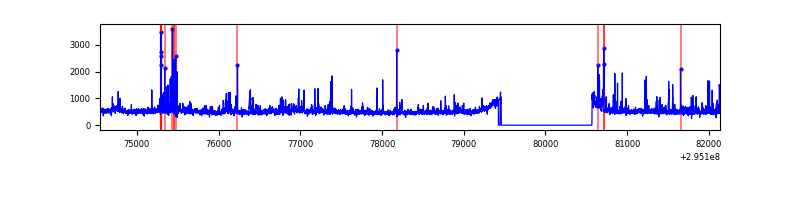 |
Top three noisy pixels from each quadrant. If the there are fewer than three noisy pixels in the level2.evt file, extra rows are filled as -1
| Pixel properties | Quadrant properties | ||||||
|---|---|---|---|---|---|---|---|
| Quadrant | DetID | PixID | Counts | Sigma | Mean | Median | Sigma |
| A | 5 | 16 | 14769 | 82.14 | 850 | 832 | 169.7 |
| A | 13 | 254 | 8939 | 47.78 | 850 | 832 | 169.7 |
| A | 0 | 226 | 7464 | 39.09 | 850 | 832 | 169.7 |
| B | 7 | 220 | 73434 | 458.96 | 832 | 812 | 158.2 |
| B | 0 | 244 | 44067 | 273.37 | 832 | 812 | 158.2 |
| B | 3 | 64 | 32137 | 197.97 | 832 | 812 | 158.2 |
| C | 14 | 238 | 126637 | 679.46 | 797 | 802 | 185.2 |
| C | 7 | 247 | 120258 | 645.01 | 797 | 802 | 185.2 |
| C | 3 | 233 | 54219 | 288.43 | 797 | 802 | 185.2 |
| D | 1 | 52 | 349050 | 1743.24 | 824 | 799 | 199.8 |
| D | 12 | 225 | 67752 | 335.15 | 824 | 799 | 199.8 |
| D | 12 | 218 | 30313 | 147.74 | 824 | 799 | 199.8 |
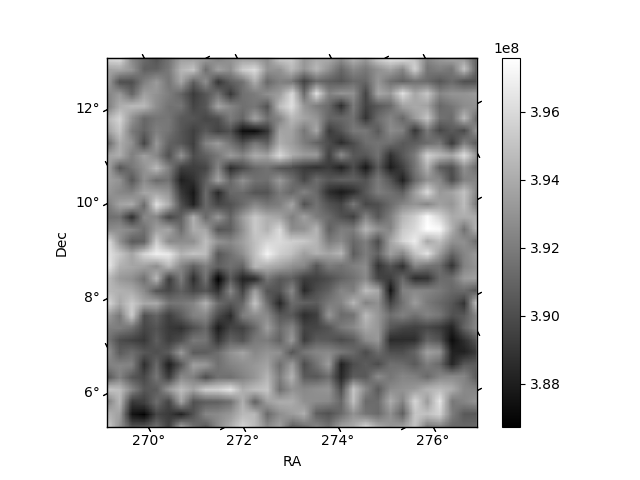
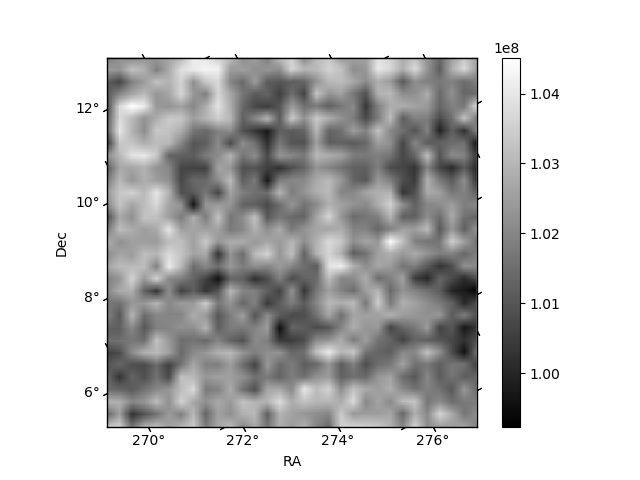
Histogram calculated using DETX and DETY for each event in the final _common_clean file
| Quadrant A | 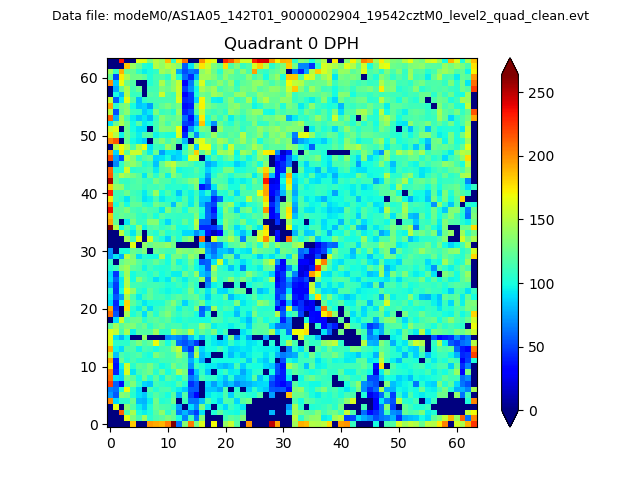 |
 |
Quadrant B |
|---|---|---|---|
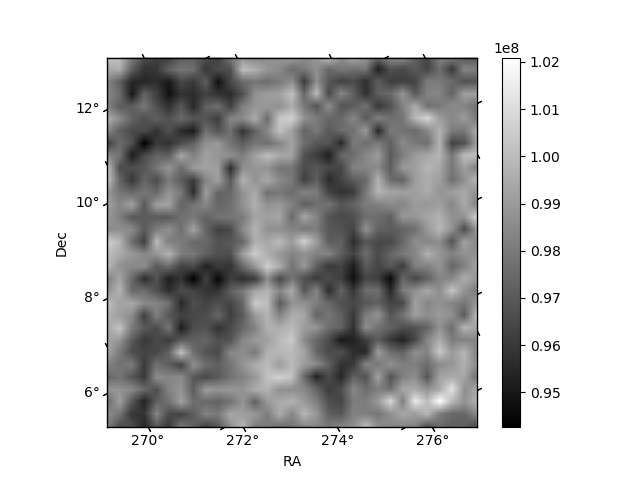
| Quadrant D | 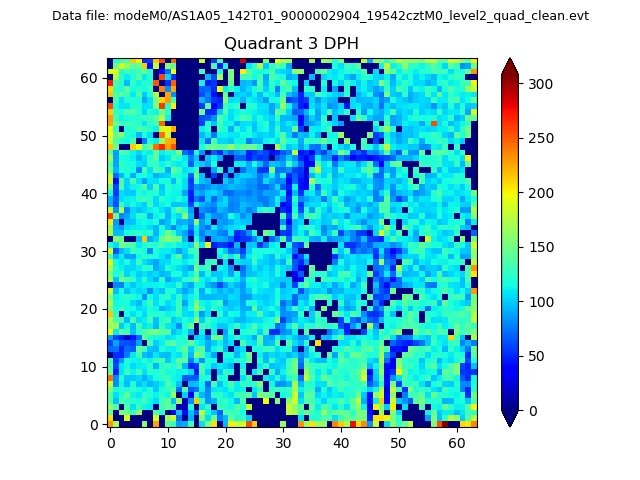 |
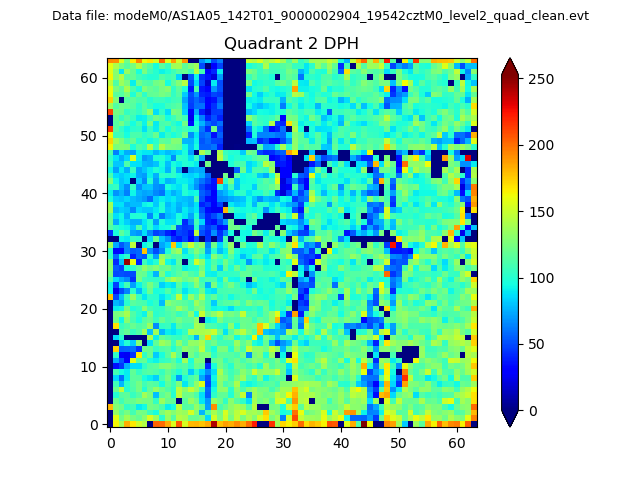 |
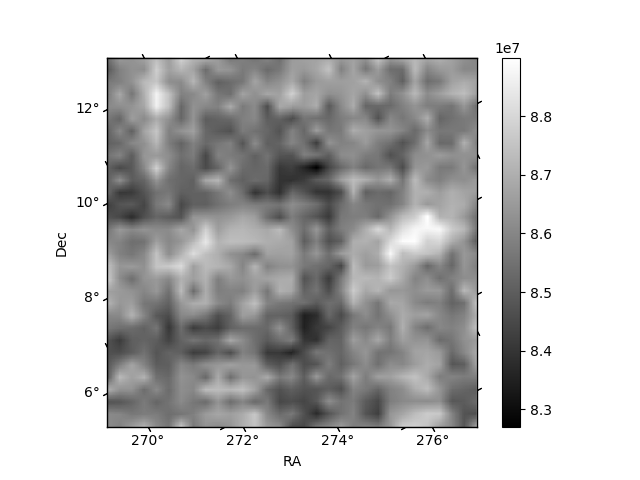
Quadrant C |
| Plot type | Count rate plots | Images |
|---|---|---|
| Comparison with Poisson distribution Blue bars denote a histogram of data divided into 1 sec bins. Red curve is a Poisson curve with rate = median count rate of data. |
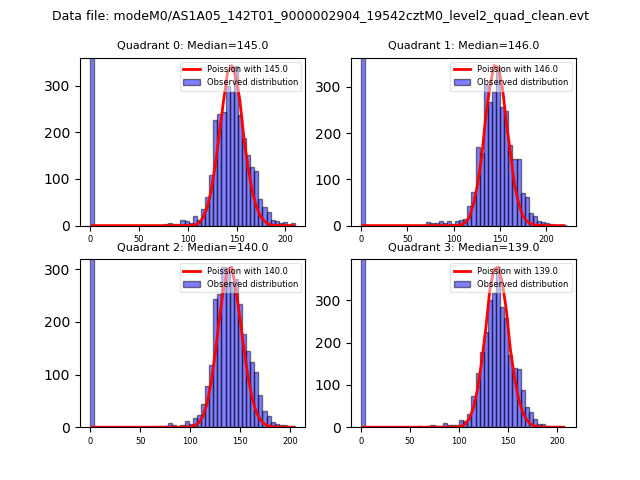 |
 |
| Quadrant-wise count rates Data is divided into 100 sec bins |
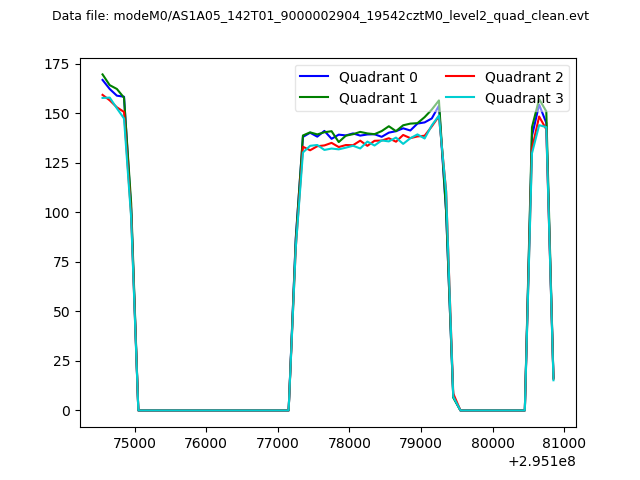 |
|
| Module-wise count rates for Quadrant A Data is divided into 100 sec bins |
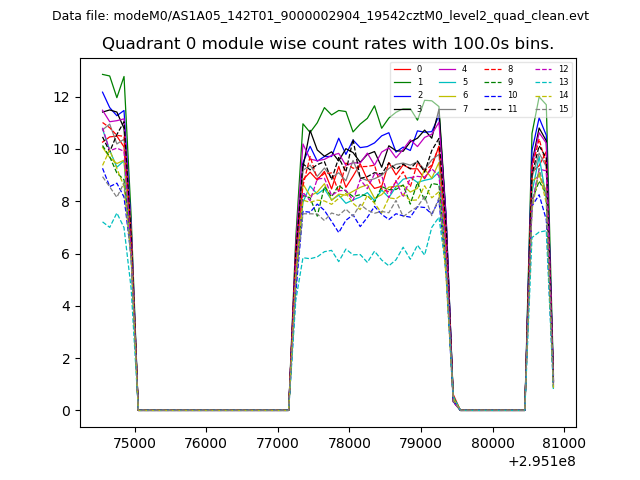 |
 |
| Module-wise count rates for Quadrant B Data is divided into 100 sec bins |
 |
 |
| Module-wise count rates for Quadrant C Data is divided into 100 sec bins |
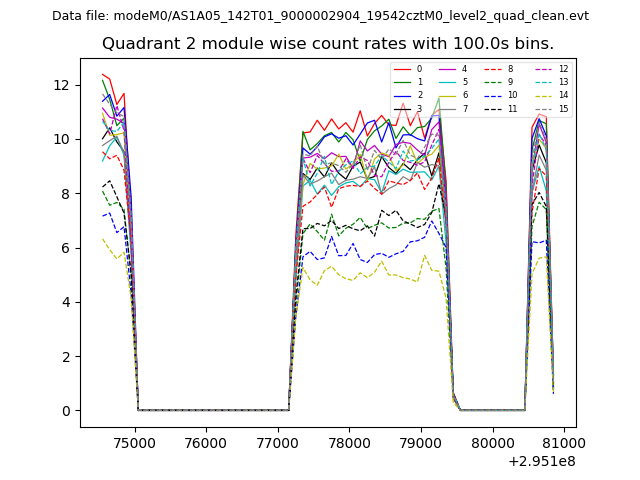 |
 |
| Module-wise count rates for Quadrant D Data is divided into 100 sec bins |
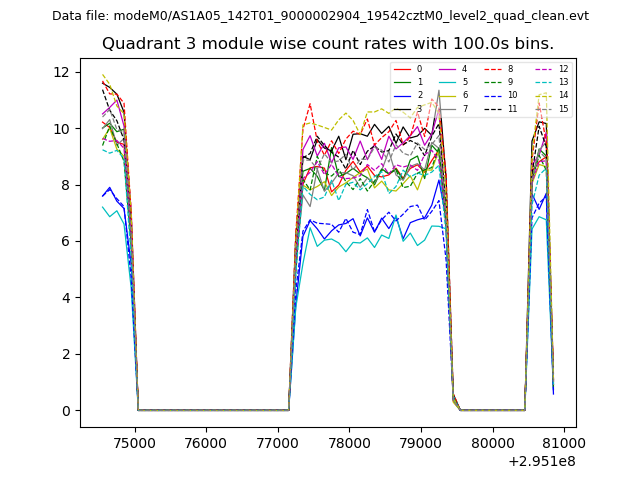 |
 |
| Parameter | Plot |
|---|---|
| CZT HV Monitor | 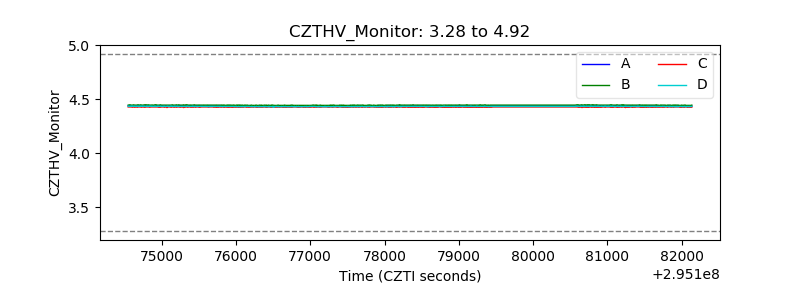 |
| D_VDD | 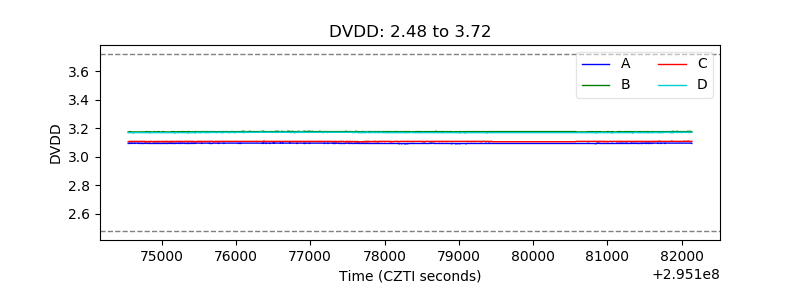 |
| Temperature 1 | 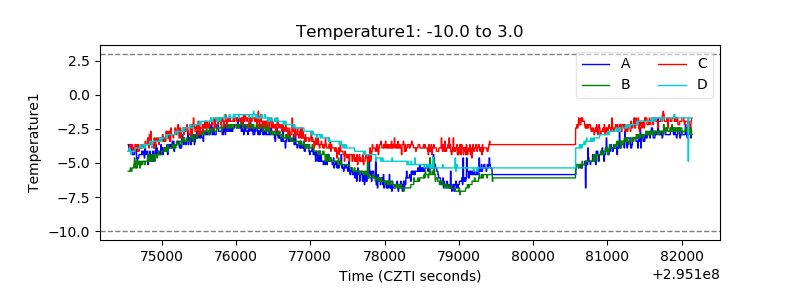 |
| Veto HV Monitor | 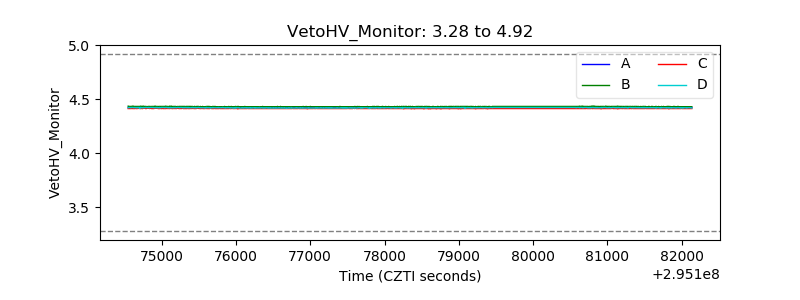 |
| Veto LLD | 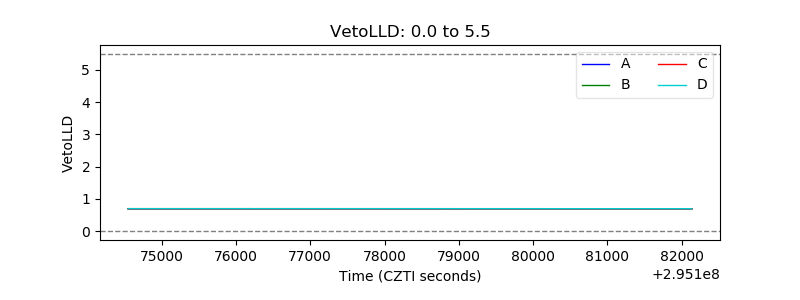 |
| Alpha Counter | 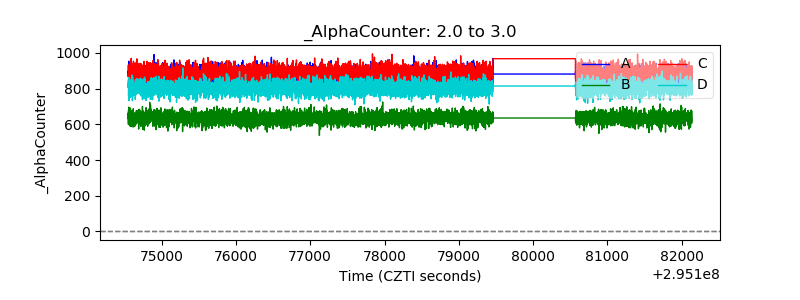 |
| _CPM_Rate | 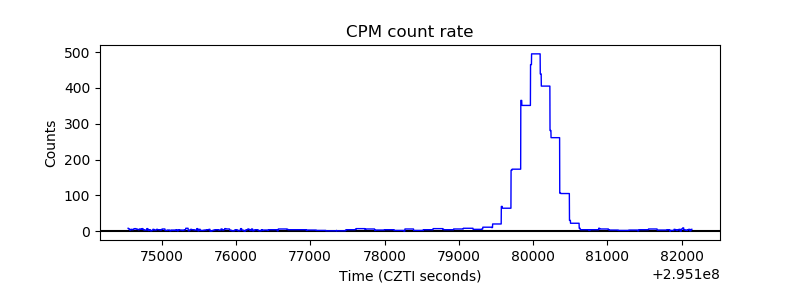 |
| CZT Counter | 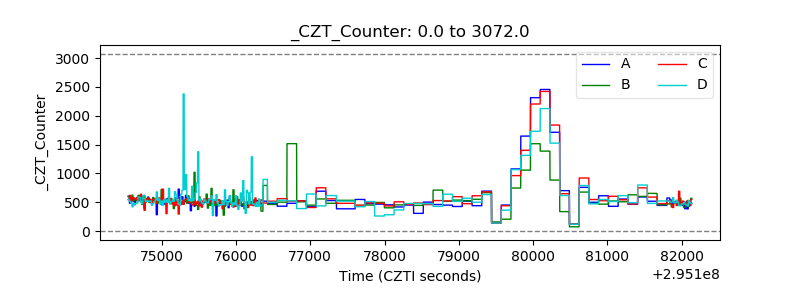 |
| +2.5 Volts monitor |  |
| +5 Volts monitor |  |
| _ROLL_ROT | 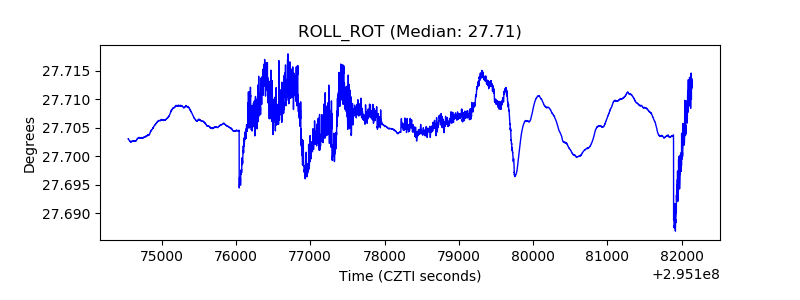 |
| _Roll_DEC | 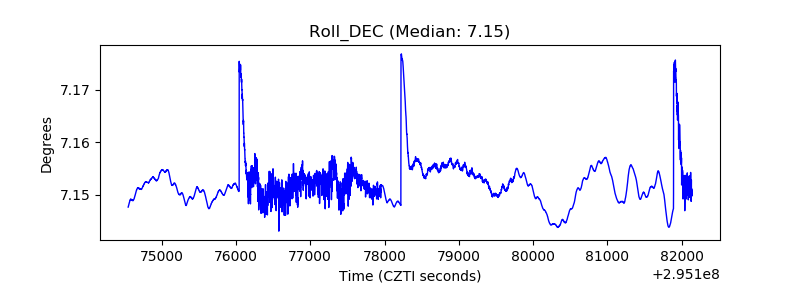 |
| _Roll_RA | 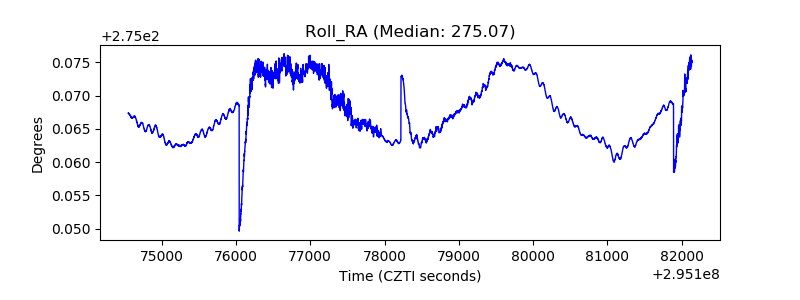 |
| Veto Counter | 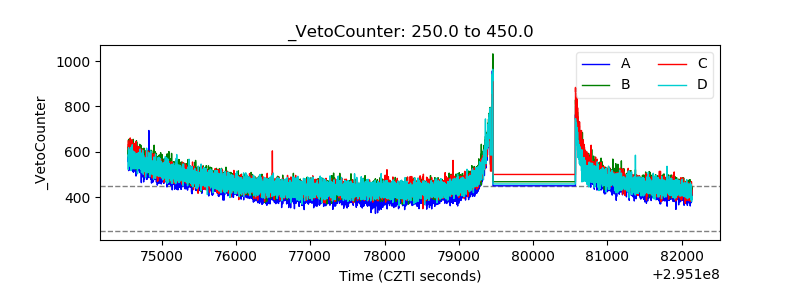 |