| Param | Original file | Final file |
|---|---|---|
| Filename | modeM0/AS1A05_142T01_9000002904_19544cztM0_level2.evt | modeM0/AS1A05_142T01_9000002904_19544cztM0_level2_quad_clean.evt |
| Size (bytes) | 505,566,720 | 77,155,200 |
| Size | 482.1 MB | 73.6 MB |
| Events in quadrant A | 3,576,340 | 463,912 |
| Events in quadrant B | 3,673,187 | 466,504 |
| Events in quadrant C | 3,836,132 | 448,110 |
| Events in quadrant D | 3,728,409 | 448,322 |
| Mode SS | |||
|---|---|---|---|
| Quadrant | BADHDUFLAG | Total packets | Discarded packets |
| A | 0 | 148 | 0 |
| B | 0 | 148 | 0 |
| C | 0 | 148 | 0 |
| D | 0 | 148 | 0 |
| Mode M0 | |||
|---|---|---|---|
| Quadrant | BADHDUFLAG | Total packets | Discarded packets |
| A | 0 | 15260 | 2 |
| B | 0 | 15433 | 2 |
| C | 0 | 15726 | 2 |
| D | 0 | 15831 | 2 |
| Mode M9 | |||
|---|---|---|---|
| Quadrant | BADHDUFLAG | Total packets | Discarded packets |
| A | 0 | 5 | 0 |
| B | 0 | 6 | 0 |
| C | 0 | 6 | 0 |
| D | 0 | 6 | 0 |
| Quadrant | Total seconds | Saturated seconds | Saturation percentage |
|---|---|---|---|
| A | 7318 | 155 | 2.118065% |
| B | 7318 | 178 | 2.432359% |
| C | 7318 | 204 | 2.787647% |
| D | 7318 | 139 | 1.899426% |
Noise dominated data is calculated using 1-second bins in cleaned event files. If a bin has >2000 counts, and if more than 50% of those come from <1% of pixels, then it is considered to be noise-dominated and hence unusable.
| Quadrant | # 1 sec bins | Bins with >0 counts | Bins with >2000 counts | High rate bins dominated by noise | Noise dominated (total time) | Noise dominated (detector-on time) | Marked lightcurve |
|---|---|---|---|---|---|---|---|
| A | 7768 | 7319 | 2 | 2 | 0.03% | 0.03% | 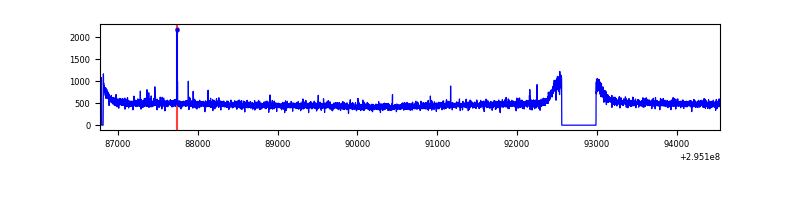 |
| B | 7768 | 7320 | 8 | 8 | 0.10% | 0.11% | 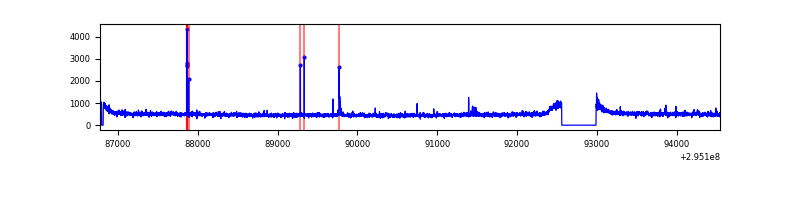 |
| C | 7768 | 7319 | 0 | 0 | 0.00% | 0.00% | 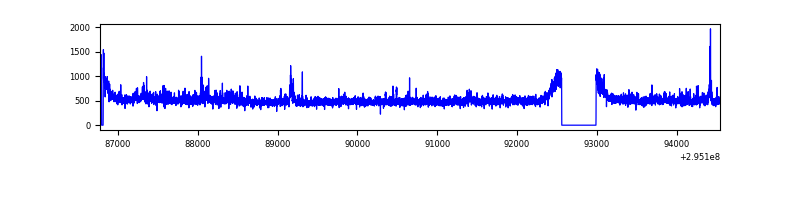 |
| D | 7768 | 7319 | 6 | 6 | 0.08% | 0.08% |  |
Top three noisy pixels from each quadrant. If the there are fewer than three noisy pixels in the level2.evt file, extra rows are filled as -1
| Pixel properties | Quadrant properties | ||||||
|---|---|---|---|---|---|---|---|
| Quadrant | DetID | PixID | Counts | Sigma | Mean | Median | Sigma |
| A | 5 | 16 | 12250 | 60.5 | 924 | 904 | 187.5 |
| A | 13 | 254 | 11418 | 56.06 | 924 | 904 | 187.5 |
| A | 0 | 226 | 8003 | 37.85 | 924 | 904 | 187.5 |
| B | 0 | 230 | 31376 | 172.01 | 912 | 886 | 177.3 |
| B | 0 | 198 | 29437 | 161.08 | 912 | 886 | 177.3 |
| B | 3 | 64 | 24117 | 131.06 | 912 | 886 | 177.3 |
| C | 3 | 233 | 251826 | 1215.77 | 875 | 882 | 206.4 |
| C | 14 | 238 | 135091 | 650.21 | 875 | 882 | 206.4 |
| C | 7 | 247 | 30487 | 143.43 | 875 | 882 | 206.4 |
| D | 1 | 52 | 208222 | 935.18 | 902 | 875 | 221.7 |
| D | 12 | 225 | 55512 | 246.42 | 902 | 875 | 221.7 |
| D | 7 | 96 | 52287 | 231.88 | 902 | 875 | 221.7 |
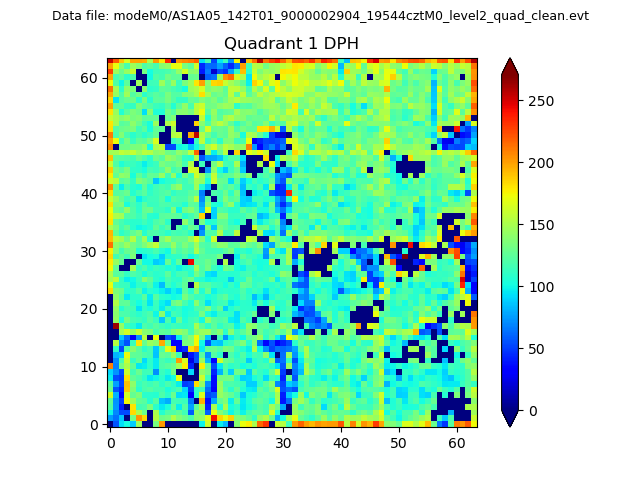
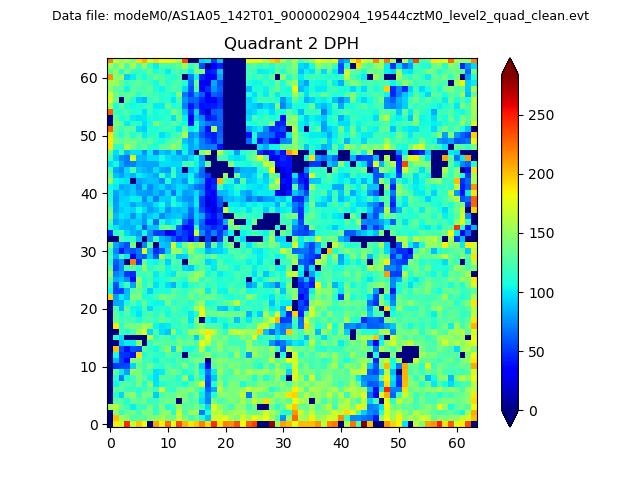
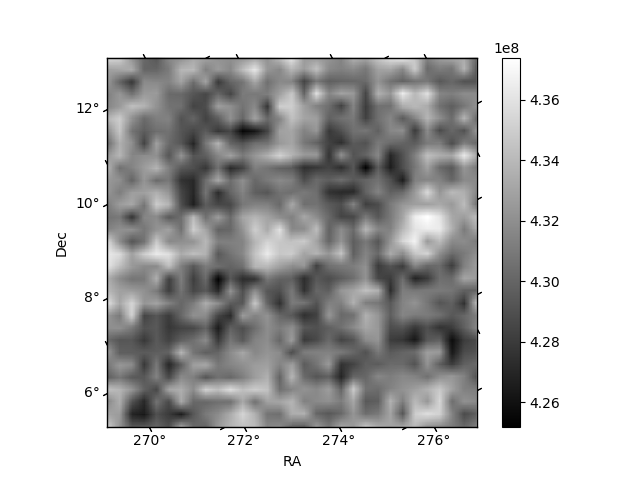
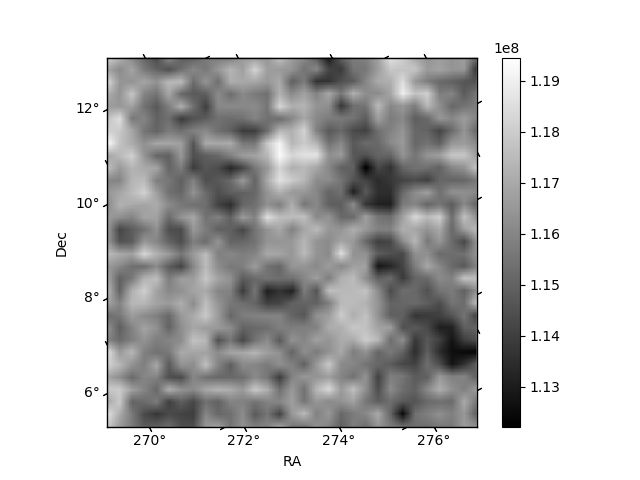
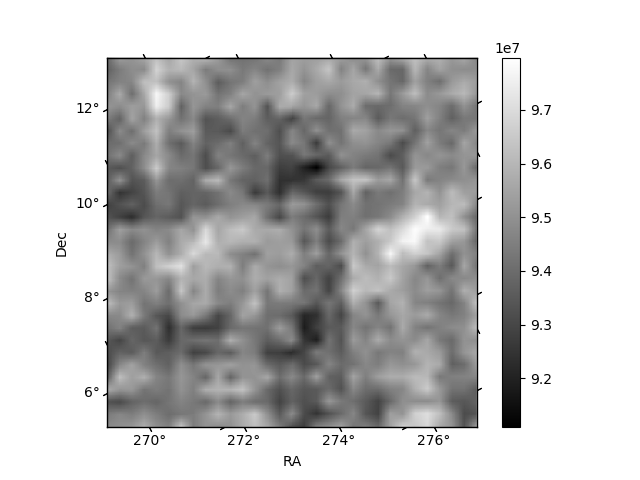
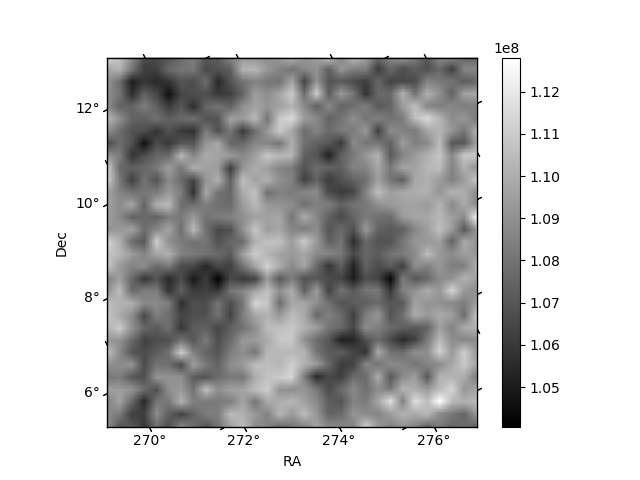
Histogram calculated using DETX and DETY for each event in the final _common_clean file
| Quadrant A | 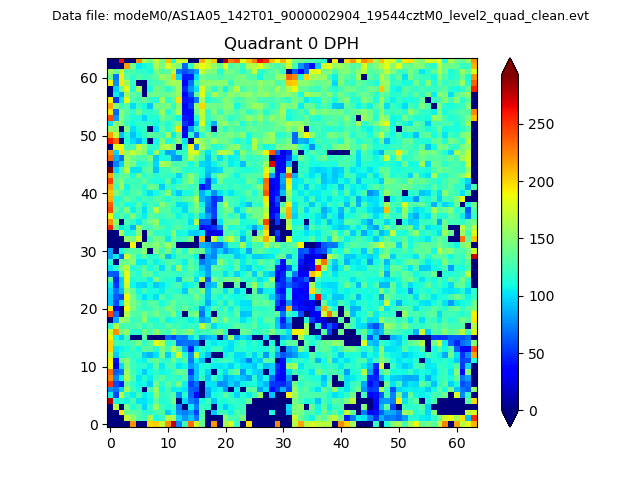 |
 |
Quadrant B |
|---|---|---|---|
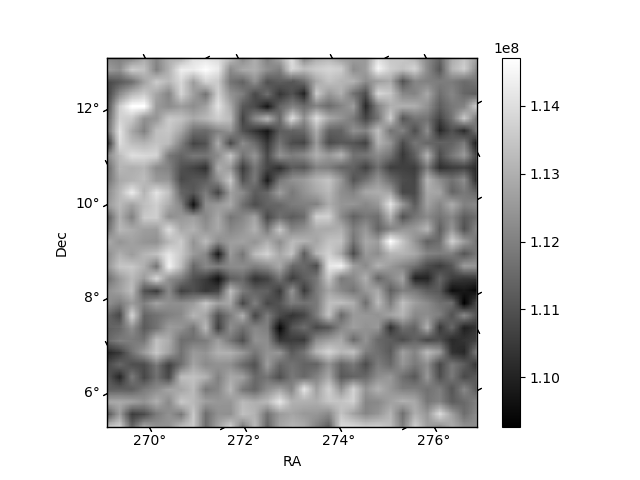
| Quadrant D | 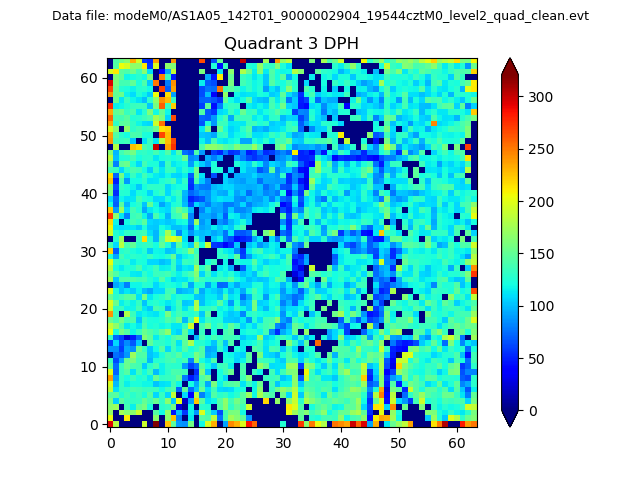 |
 |
Quadrant C |
| Plot type | Count rate plots | Images |
|---|---|---|
| Comparison with Poisson distribution Blue bars denote a histogram of data divided into 1 sec bins. Red curve is a Poisson curve with rate = median count rate of data. |
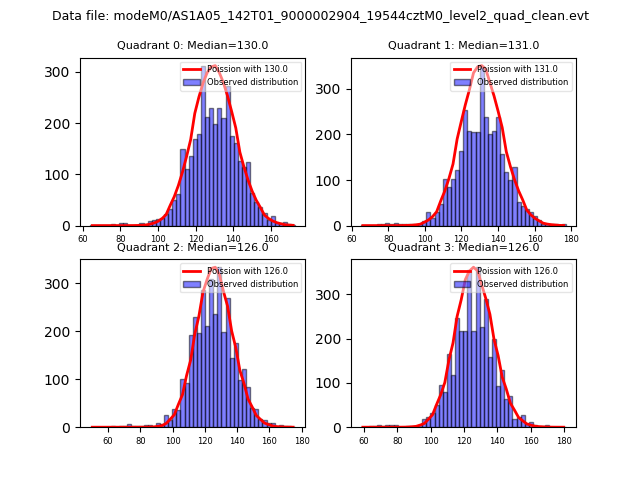 |
 |
| Quadrant-wise count rates Data is divided into 100 sec bins |
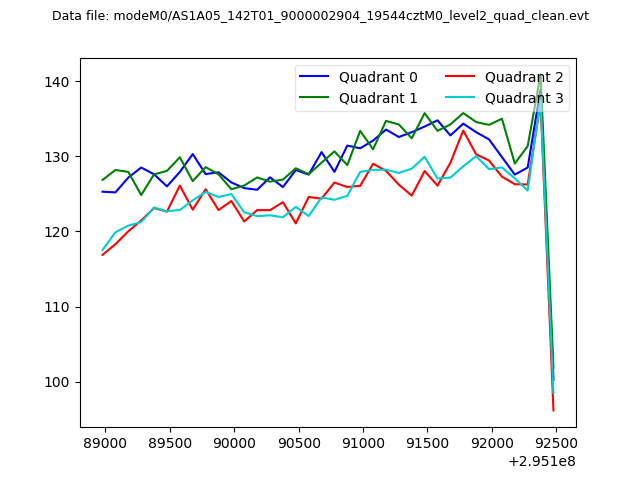 |
|
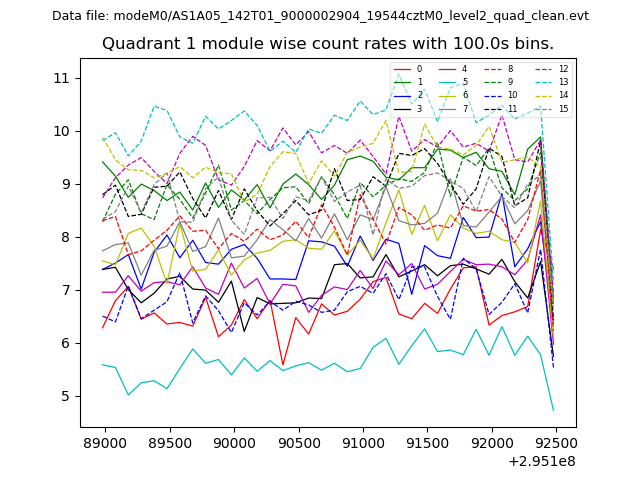
| Module-wise count rates for Quadrant A Data is divided into 100 sec bins |
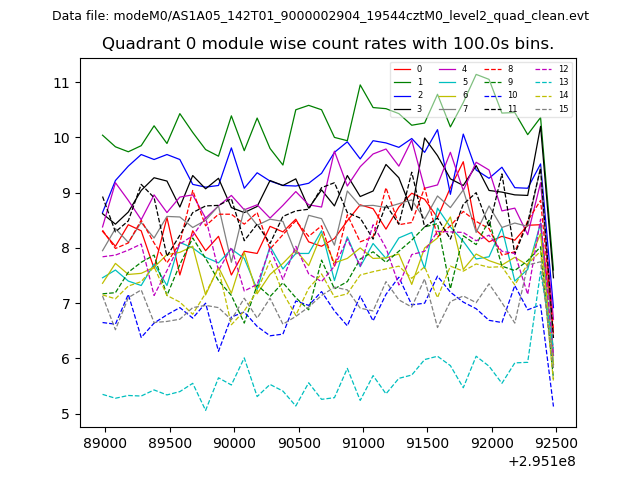 |
 |
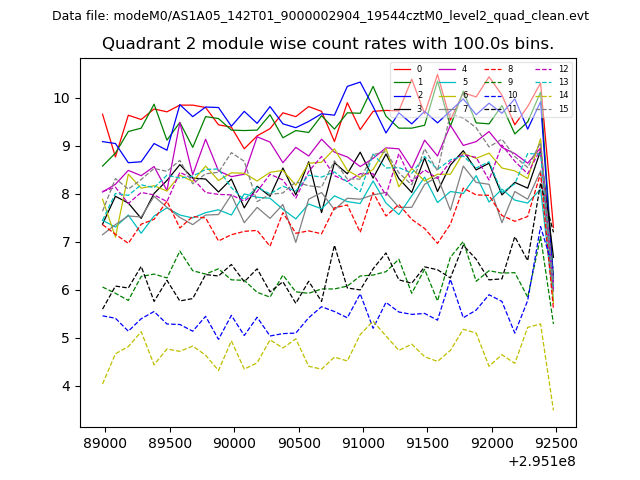
| Module-wise count rates for Quadrant B Data is divided into 100 sec bins |
 |
 |
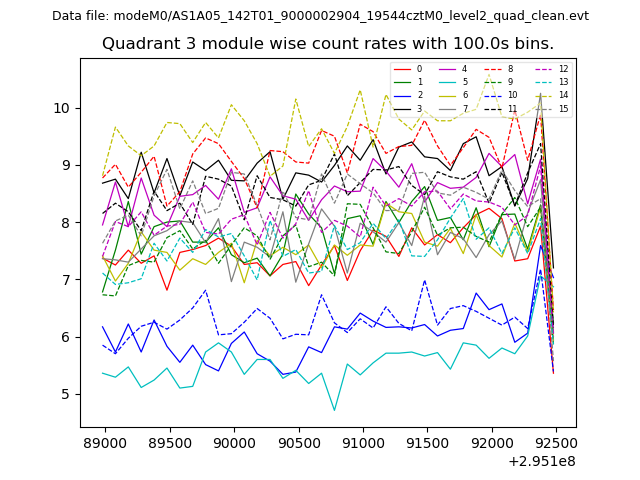
| Module-wise count rates for Quadrant C Data is divided into 100 sec bins |
 |
 |
| Module-wise count rates for Quadrant D Data is divided into 100 sec bins |
 |
 |
| Parameter | Plot |
|---|---|
| CZT HV Monitor | 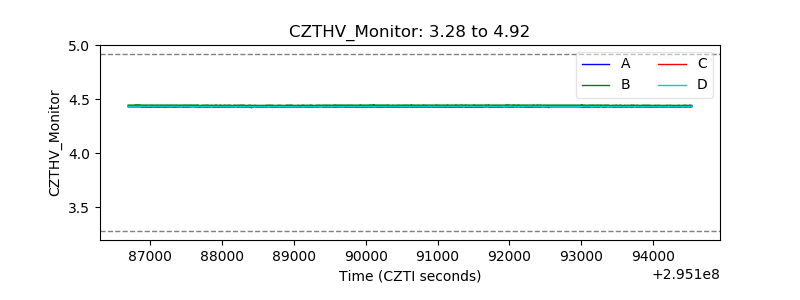 |
| D_VDD | 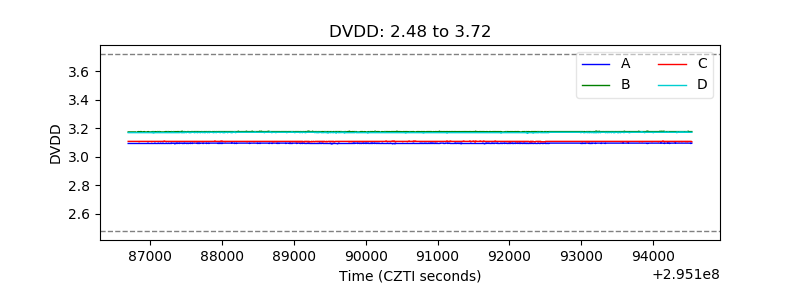 |
| Temperature 1 | 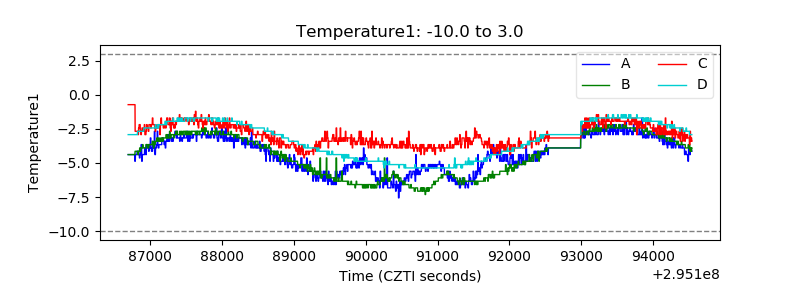 |
| Veto HV Monitor | 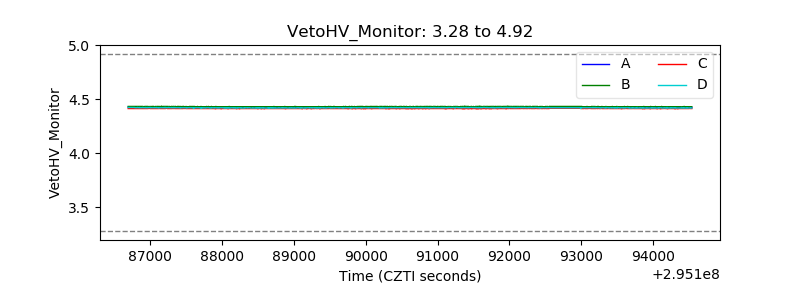 |
| Veto LLD | 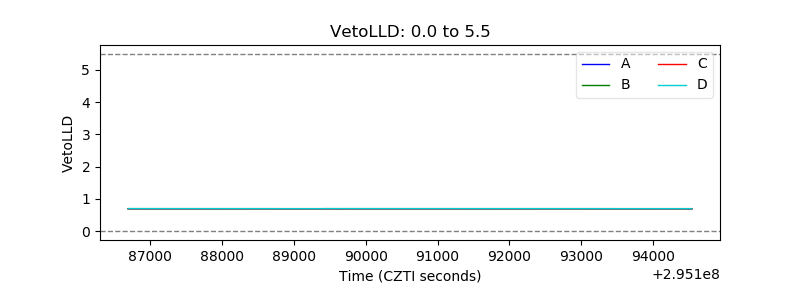 |
| Alpha Counter | 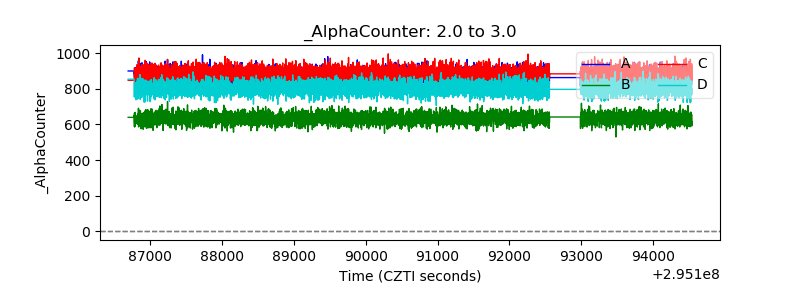 |
| _CPM_Rate | 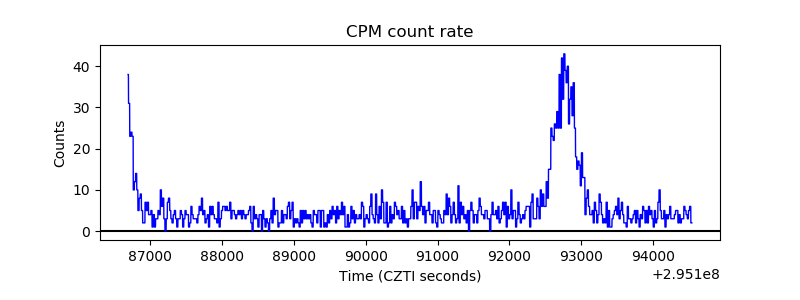 |
| CZT Counter | 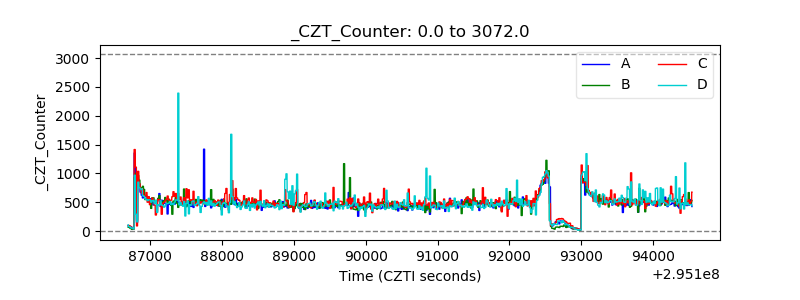 |
| +2.5 Volts monitor |  |
| +5 Volts monitor |  |
| _ROLL_ROT | 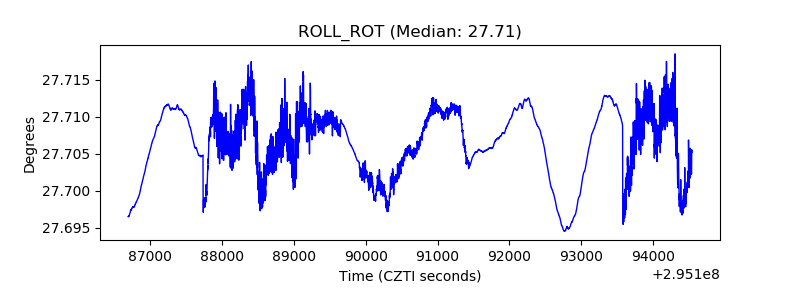 |
| _Roll_DEC | 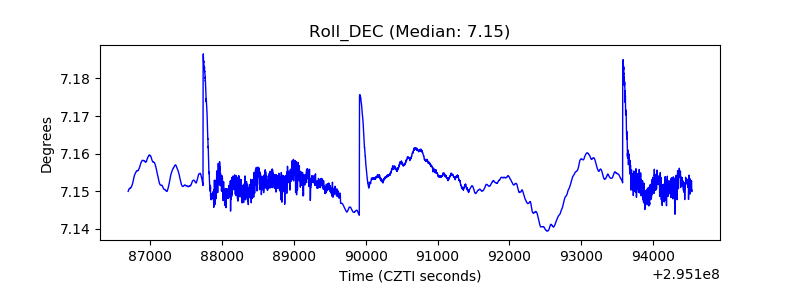 |
| _Roll_RA | 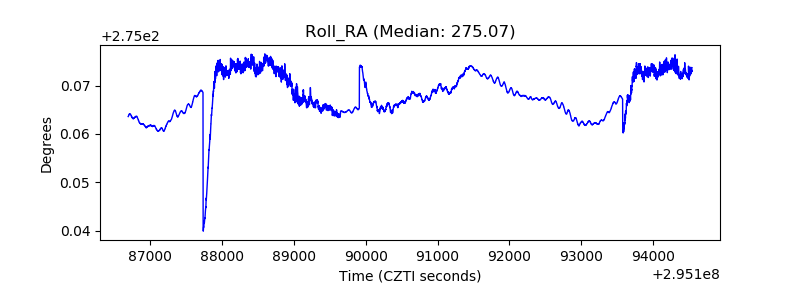 |
| Veto Counter | 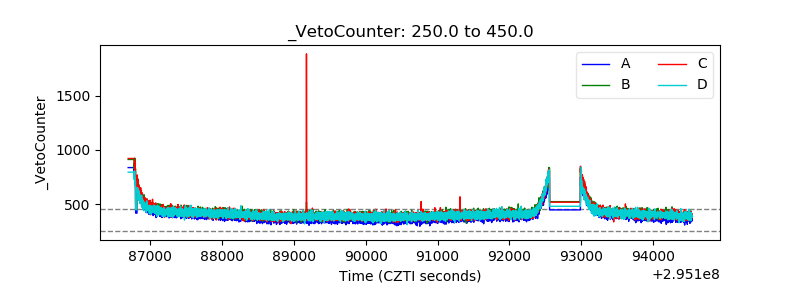 |