| Param | Original file | Final file |
|---|---|---|
| Filename | modeM0/AS1A05_142T01_9000002904_19545cztM0_level2.evt | modeM0/AS1A05_142T01_9000002904_19545cztM0_level2_quad_clean.evt |
| Size (bytes) | 566,464,320 | 88,666,560 |
| Size | 540.2 MB | 84.6 MB |
| Events in quadrant A | 3,969,362 | 538,717 |
| Events in quadrant B | 4,113,849 | 541,877 |
| Events in quadrant C | 4,206,209 | 523,438 |
| Events in quadrant D | 4,317,426 | 519,317 |
| Mode SS | |||
|---|---|---|---|
| Quadrant | BADHDUFLAG | Total packets | Discarded packets |
| A | 0 | 166 | 0 |
| B | 0 | 166 | 0 |
| C | 0 | 166 | 0 |
| D | 0 | 166 | 0 |
| Mode M0 | |||
|---|---|---|---|
| Quadrant | BADHDUFLAG | Total packets | Discarded packets |
| A | 0 | 16982 | 2 |
| B | 0 | 17300 | 1 |
| C | 0 | 17381 | 1 |
| D | 0 | 17987 | 1 |
| Mode M9 | |||
|---|---|---|---|
| Quadrant | BADHDUFLAG | Total packets | Discarded packets |
| A | 0 | 7 | 0 |
| B | 0 | 7 | 0 |
| C | 0 | 7 | 0 |
| D | 0 | 7 | 0 |
| Quadrant | Total seconds | Saturated seconds | Saturation percentage |
|---|---|---|---|
| A | 8079 | 203 | 2.512687% |
| B | 8079 | 256 | 3.168709% |
| C | 8079 | 292 | 3.614309% |
| D | 8079 | 197 | 2.438421% |
Noise dominated data is calculated using 1-second bins in cleaned event files. If a bin has >2000 counts, and if more than 50% of those come from <1% of pixels, then it is considered to be noise-dominated and hence unusable.
| Quadrant | # 1 sec bins | Bins with >0 counts | Bins with >2000 counts | High rate bins dominated by noise | Noise dominated (total time) | Noise dominated (detector-on time) | Marked lightcurve |
|---|---|---|---|---|---|---|---|
| A | 8794 | 8080 | 1 | 1 | 0.01% | 0.01% | 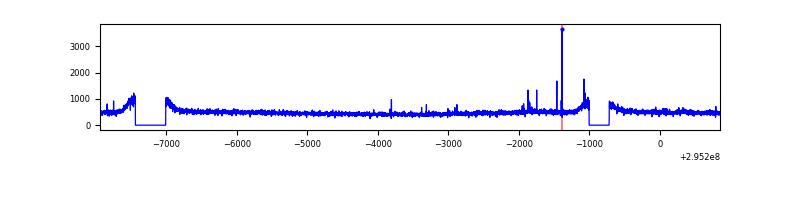 |
| B | 8794 | 8081 | 8 | 8 | 0.09% | 0.10% |  |
| C | 8794 | 8080 | 0 | 0 | 0.00% | 0.00% |  |
| D | 8794 | 8080 | 23 | 23 | 0.26% | 0.28% |  |
Top three noisy pixels from each quadrant. If the there are fewer than three noisy pixels in the level2.evt file, extra rows are filled as -1
| Pixel properties | Quadrant properties | ||||||
|---|---|---|---|---|---|---|---|
| Quadrant | DetID | PixID | Counts | Sigma | Mean | Median | Sigma |
| A | 5 | 16 | 23284 | 107.0 | 1023 | 1000 | 208.3 |
| A | 13 | 254 | 12126 | 53.43 | 1023 | 1000 | 208.3 |
| A | 0 | 226 | 8899 | 37.93 | 1023 | 1000 | 208.3 |
| B | 0 | 197 | 62506 | 311.54 | 1011 | 983 | 197.5 |
| B | 0 | 230 | 32287 | 158.52 | 1011 | 983 | 197.5 |
| B | 12 | 111 | 24295 | 118.05 | 1011 | 983 | 197.5 |
| C | 3 | 233 | 245035 | 1064.96 | 970 | 975 | 229.2 |
| C | 14 | 238 | 148832 | 645.17 | 970 | 975 | 229.2 |
| C | 7 | 247 | 26227 | 110.19 | 970 | 975 | 229.2 |
| D | 1 | 52 | 500835 | 2031.18 | 1000 | 970 | 246.1 |
| D | 2 | 234 | 31500 | 124.06 | 1000 | 970 | 246.1 |
| D | 7 | 96 | 28466 | 111.73 | 1000 | 970 | 246.1 |
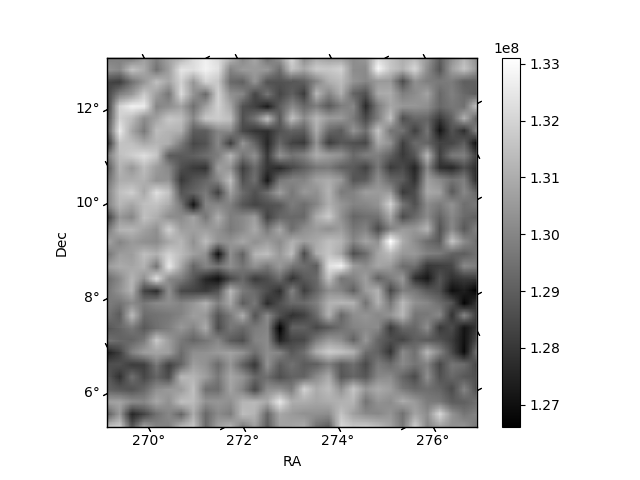
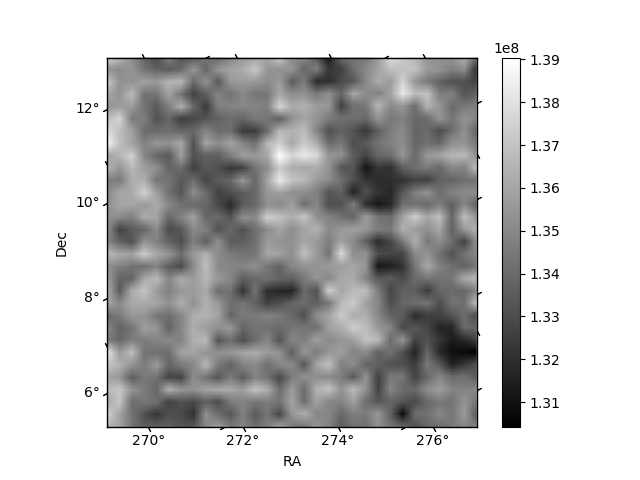
Histogram calculated using DETX and DETY for each event in the final _common_clean file
| Quadrant A | 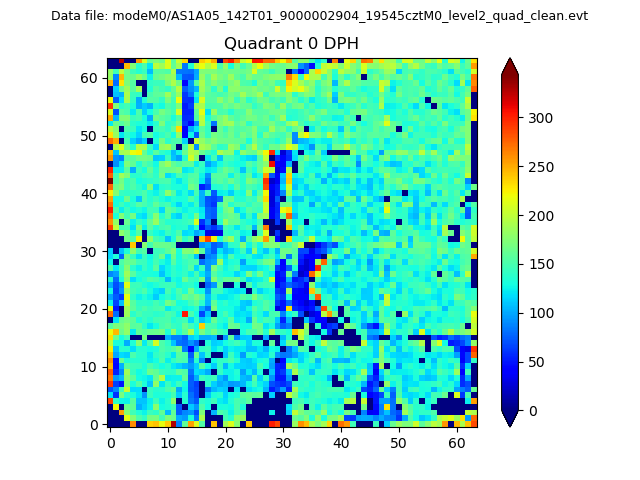 |
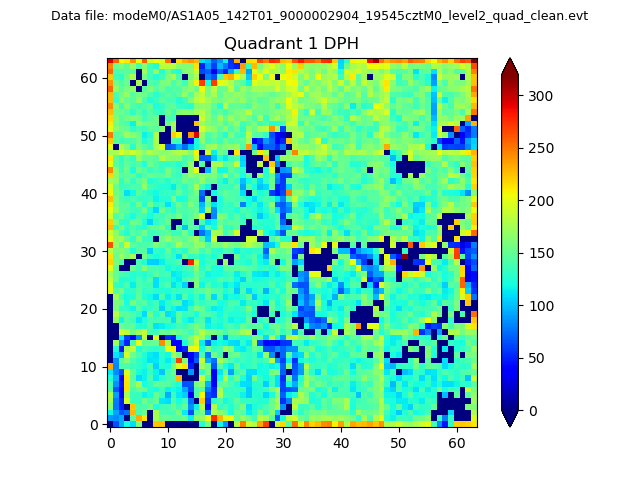 |
Quadrant B |
|---|---|---|---|
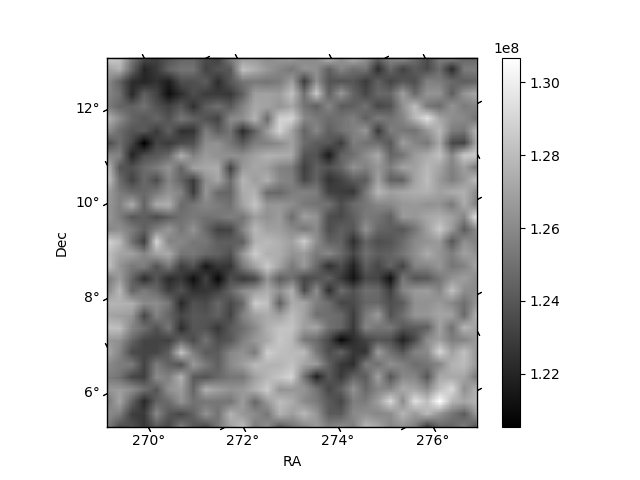
| Quadrant D | 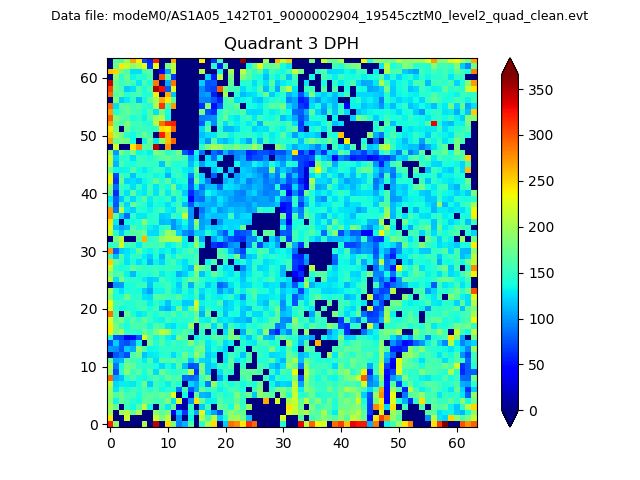 |
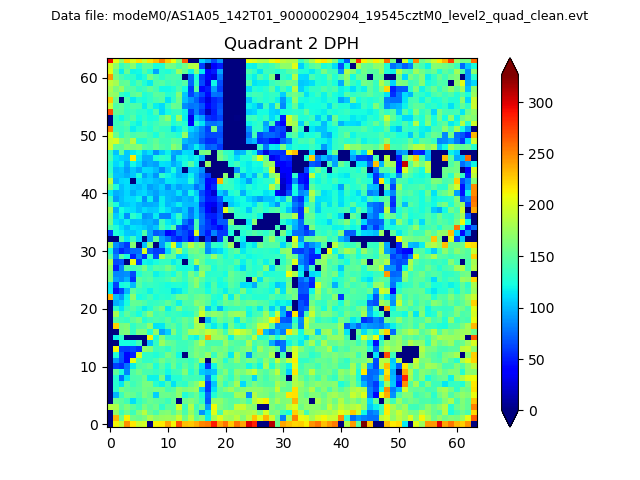 |
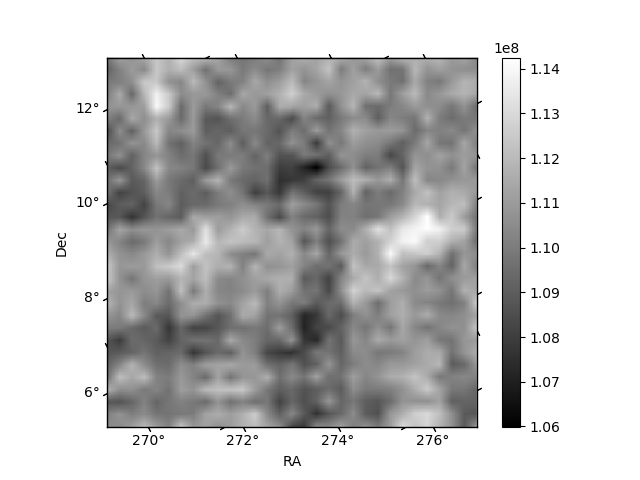
Quadrant C |
| Plot type | Count rate plots | Images |
|---|---|---|
| Comparison with Poisson distribution Blue bars denote a histogram of data divided into 1 sec bins. Red curve is a Poisson curve with rate = median count rate of data. |
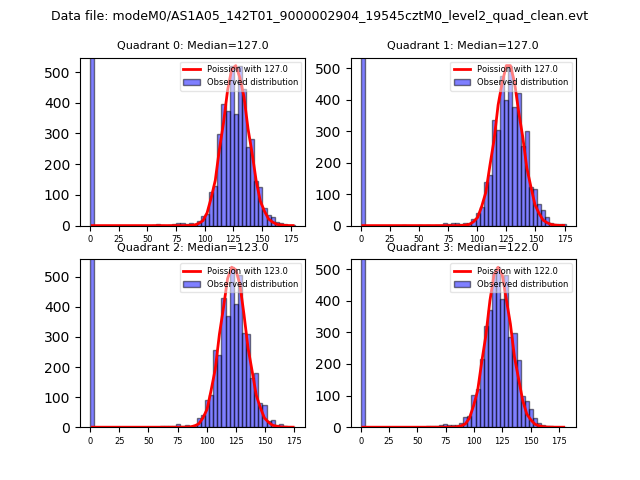 |
 |
| Quadrant-wise count rates Data is divided into 100 sec bins |
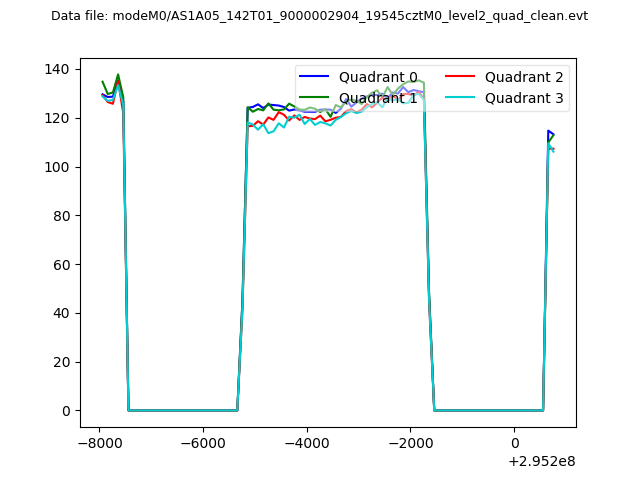 |
|
| Module-wise count rates for Quadrant A Data is divided into 100 sec bins |
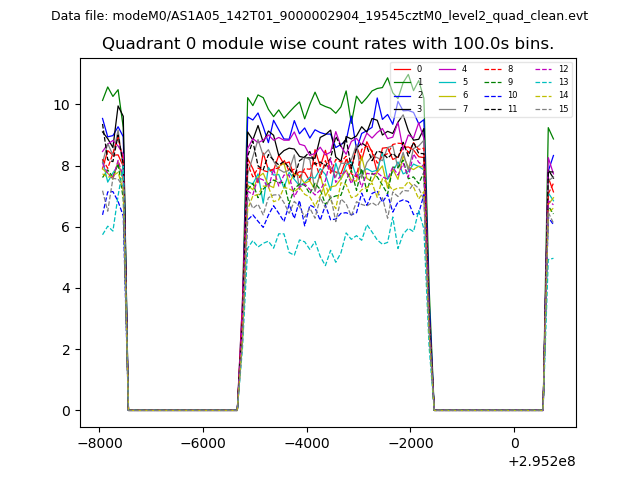 |
 |
| Module-wise count rates for Quadrant B Data is divided into 100 sec bins |
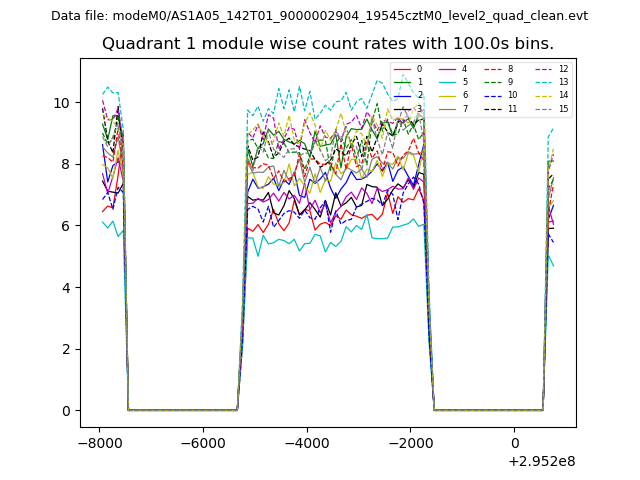 |
 |
| Module-wise count rates for Quadrant C Data is divided into 100 sec bins |
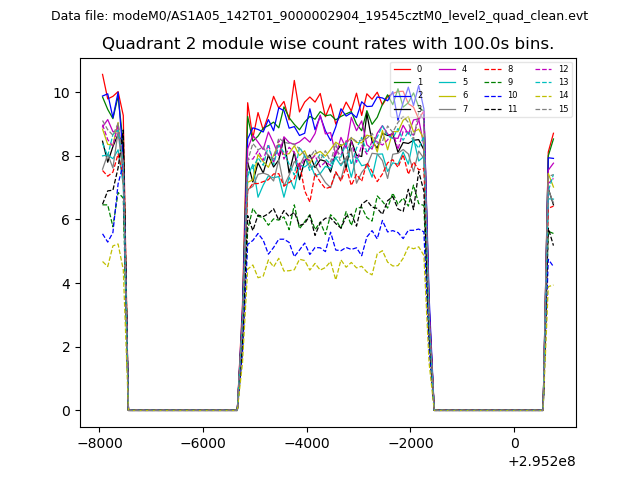 |
 |
| Module-wise count rates for Quadrant D Data is divided into 100 sec bins |
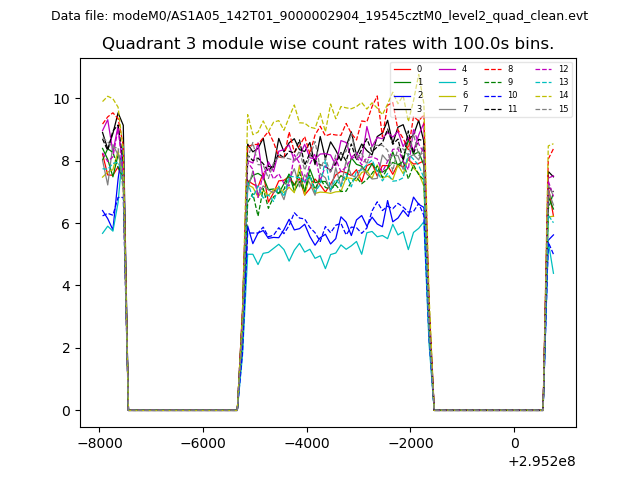 |
 |
| Parameter | Plot |
|---|---|
| CZT HV Monitor | 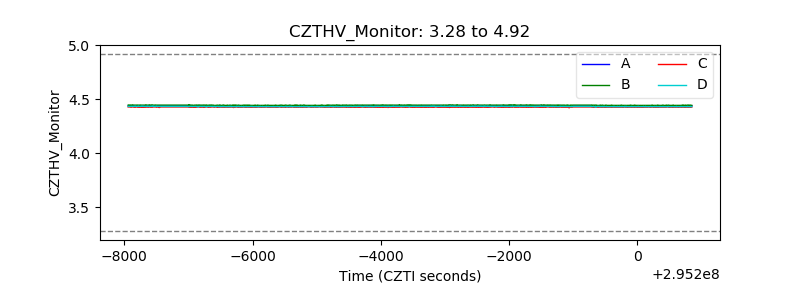 |
| D_VDD | 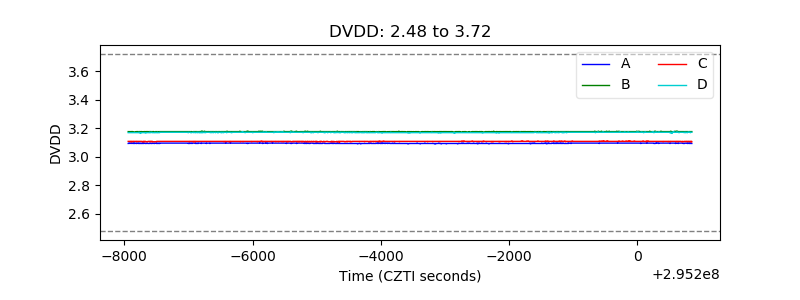 |
| Temperature 1 | 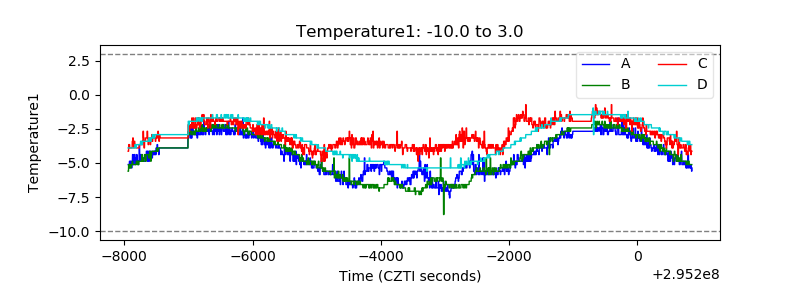 |
| Veto HV Monitor | 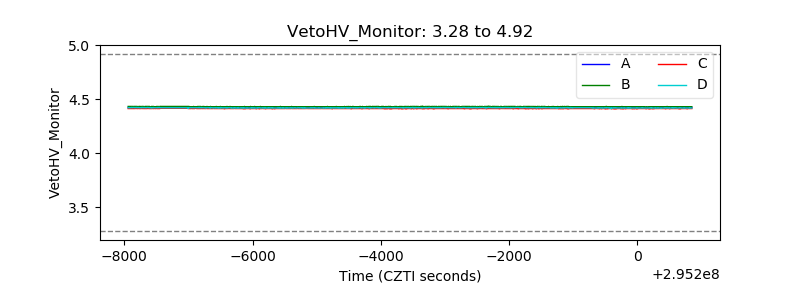 |
| Veto LLD |  |
| Alpha Counter | 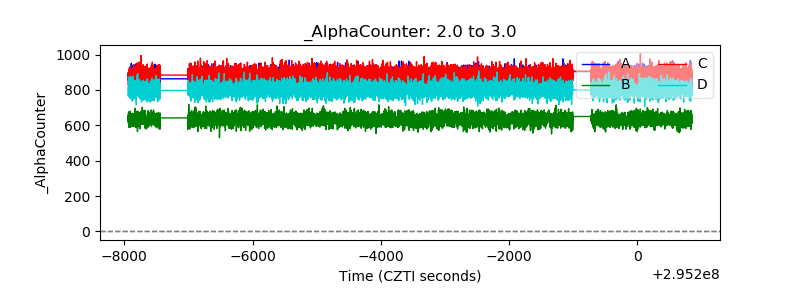 |
| _CPM_Rate | 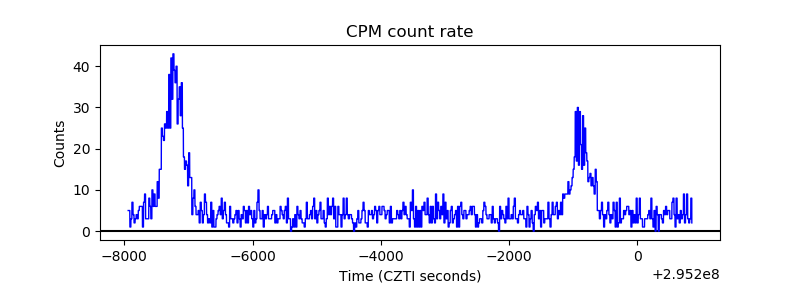 |
| CZT Counter | 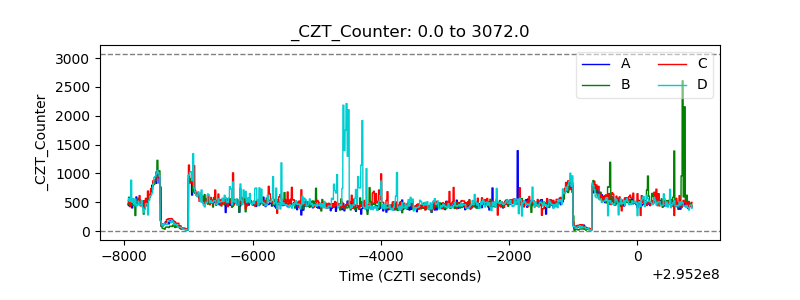 |
| +2.5 Volts monitor |  |
| +5 Volts monitor |  |
| _ROLL_ROT | 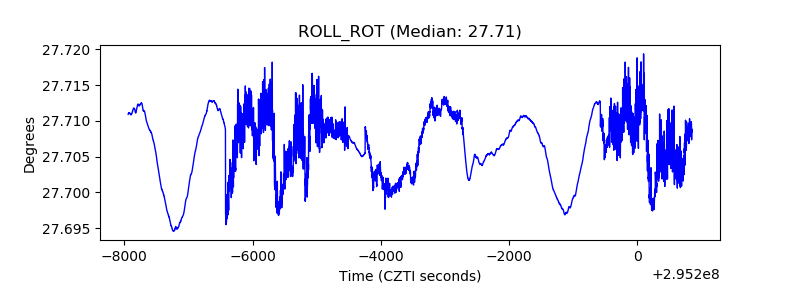 |
| _Roll_DEC | 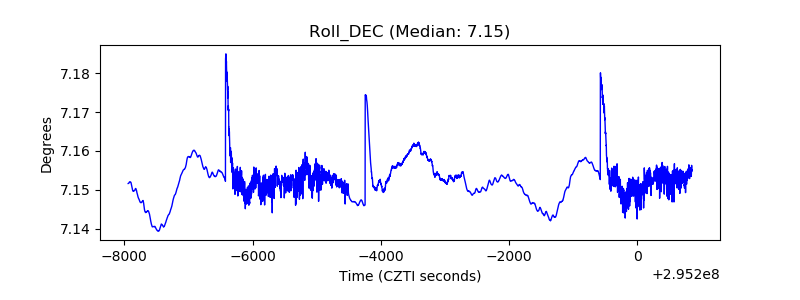 |
| _Roll_RA | 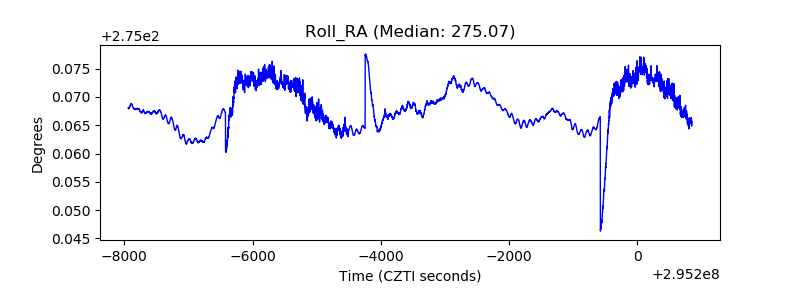 |
| Veto Counter | 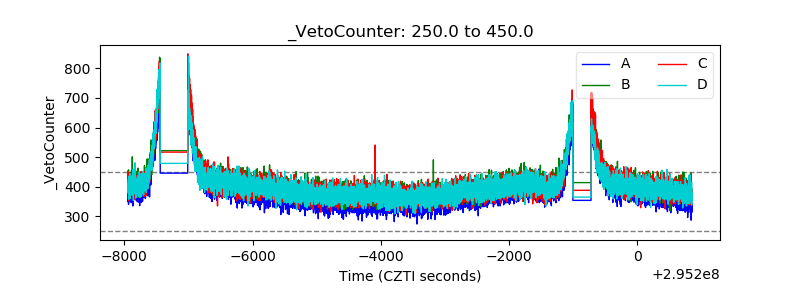 |