| Param | Original file | Final file |
|---|---|---|
| Filename | modeM0/AS1A05_142T01_9000002904_19546cztM0_level2.evt | modeM0/AS1A05_142T01_9000002904_19546cztM0_level2_quad_clean.evt |
| Size (bytes) | 562,167,360 | 84,712,320 |
| Size | 536.1 MB | 80.8 MB |
| Events in quadrant A | 3,830,680 | 512,576 |
| Events in quadrant B | 4,077,144 | 511,587 |
| Events in quadrant C | 4,082,075 | 497,437 |
| Events in quadrant D | 4,494,637 | 489,817 |
| Mode SS | |||
|---|---|---|---|
| Quadrant | BADHDUFLAG | Total packets | Discarded packets |
| A | 0 | 164 | 0 |
| B | 0 | 164 | 0 |
| C | 0 | 164 | 0 |
| D | 0 | 164 | 0 |
| Mode M0 | |||
|---|---|---|---|
| Quadrant | BADHDUFLAG | Total packets | Discarded packets |
| A | 0 | 16506 | 2 |
| B | 0 | 17106 | 2 |
| C | 0 | 17012 | 2 |
| D | 0 | 18597 | 2 |
| Mode M9 | |||
|---|---|---|---|
| Quadrant | BADHDUFLAG | Total packets | Discarded packets |
| A | 0 | 6 | 0 |
| B | 0 | 6 | 0 |
| C | 0 | 6 | 0 |
| D | 0 | 6 | 0 |
| Quadrant | Total seconds | Saturated seconds | Saturation percentage |
|---|---|---|---|
| A | 7964 | 108 | 1.356102% |
| B | 7964 | 174 | 2.184832% |
| C | 7965 | 218 | 2.736974% |
| D | 7965 | 125 | 1.569366% |
Noise dominated data is calculated using 1-second bins in cleaned event files. If a bin has >2000 counts, and if more than 50% of those come from <1% of pixels, then it is considered to be noise-dominated and hence unusable.
| Quadrant | # 1 sec bins | Bins with >0 counts | Bins with >2000 counts | High rate bins dominated by noise | Noise dominated (total time) | Noise dominated (detector-on time) | Marked lightcurve |
|---|---|---|---|---|---|---|---|
| A | 8669 | 7966 | 1 | 1 | 0.01% | 0.01% | 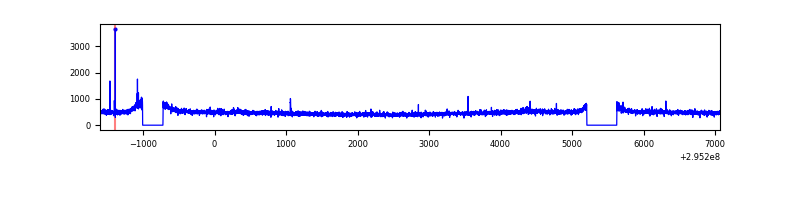 |
| B | 8669 | 7966 | 21 | 21 | 0.24% | 0.26% | 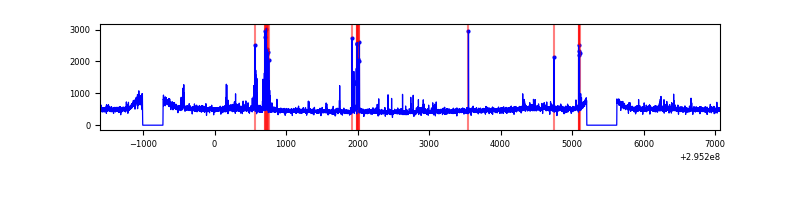 |
| C | 8670 | 7967 | 0 | 0 | 0.00% | 0.00% | 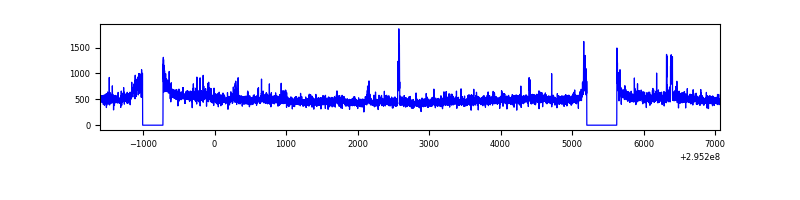 |
| D | 8670 | 7967 | 59 | 59 | 0.68% | 0.74% | 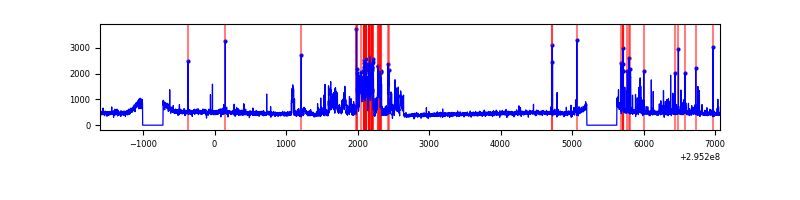 |
Top three noisy pixels from each quadrant. If the there are fewer than three noisy pixels in the level2.evt file, extra rows are filled as -1
| Pixel properties | Quadrant properties | ||||||
|---|---|---|---|---|---|---|---|
| Quadrant | DetID | PixID | Counts | Sigma | Mean | Median | Sigma |
| A | 5 | 16 | 14171 | 66.03 | 987 | 963 | 200.0 |
| A | 13 | 254 | 11556 | 52.96 | 987 | 963 | 200.0 |
| A | 0 | 226 | 8526 | 37.81 | 987 | 963 | 200.0 |
| B | 0 | 197 | 68158 | 356.7 | 978 | 952 | 188.4 |
| B | 3 | 64 | 60758 | 317.43 | 978 | 952 | 188.4 |
| B | 0 | 230 | 34722 | 179.24 | 978 | 952 | 188.4 |
| C | 3 | 233 | 188008 | 852.49 | 937 | 942 | 219.4 |
| C | 14 | 238 | 145905 | 660.62 | 937 | 942 | 219.4 |
| C | 7 | 247 | 81120 | 365.38 | 937 | 942 | 219.4 |
| D | 1 | 52 | 708467 | 3001.57 | 959 | 933 | 235.7 |
| D | 12 | 233 | 87890 | 368.9 | 959 | 933 | 235.7 |
| D | 12 | 225 | 43386 | 180.1 | 959 | 933 | 235.7 |
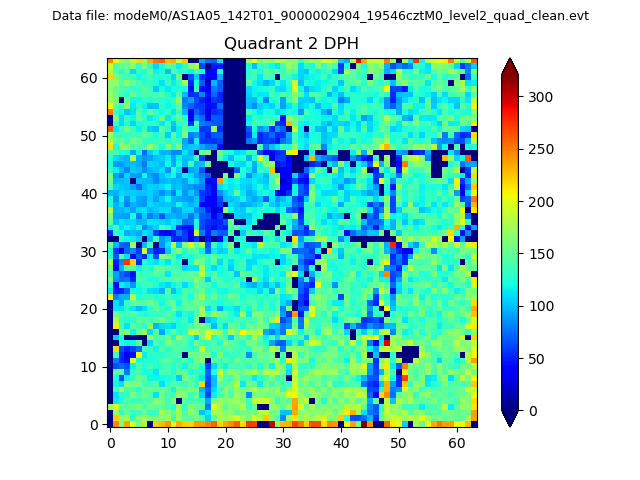
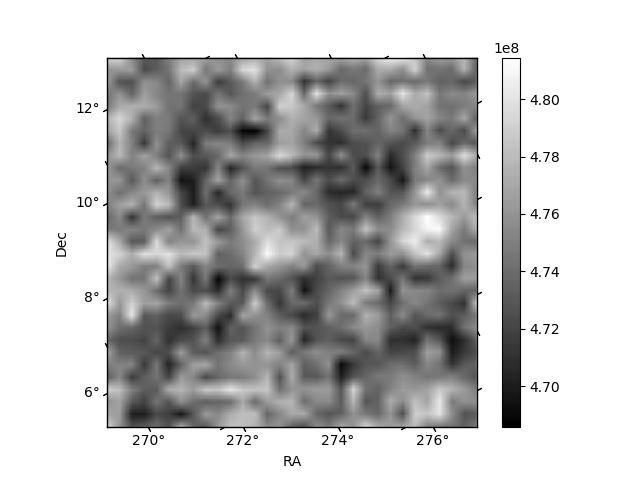
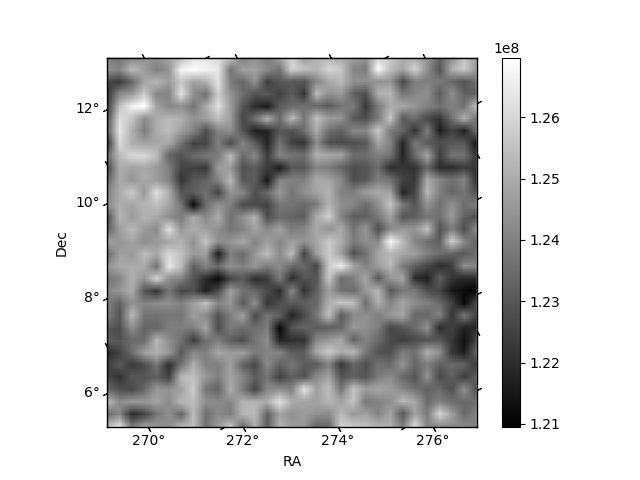
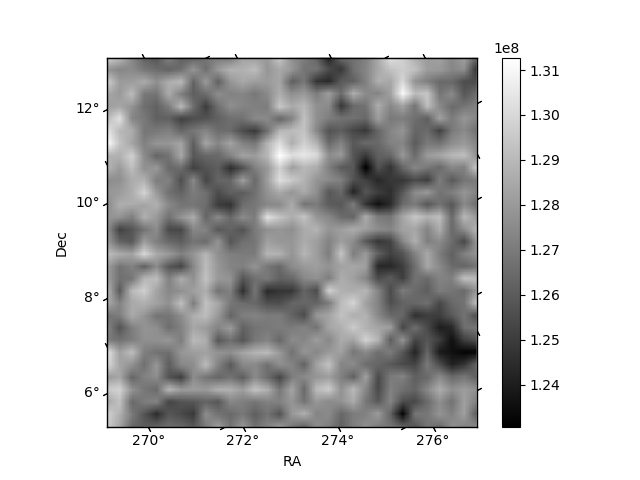
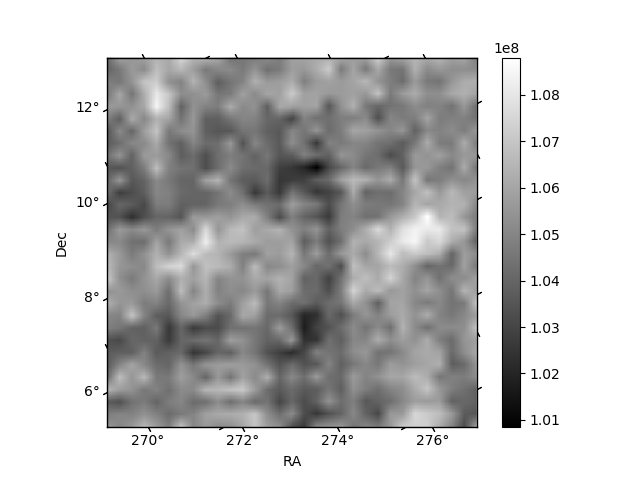
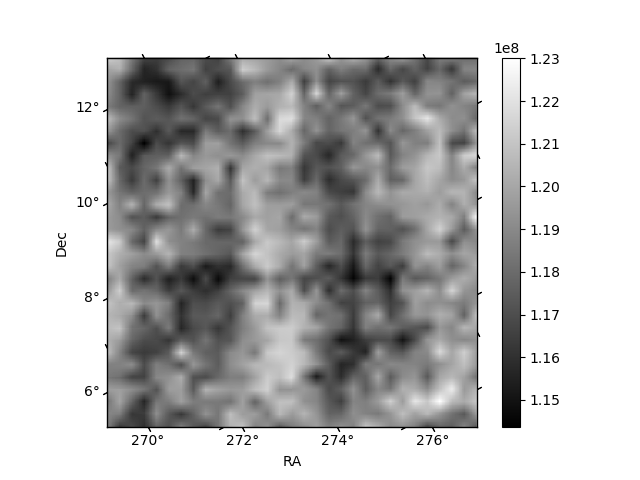
Histogram calculated using DETX and DETY for each event in the final _common_clean file
| Quadrant A | 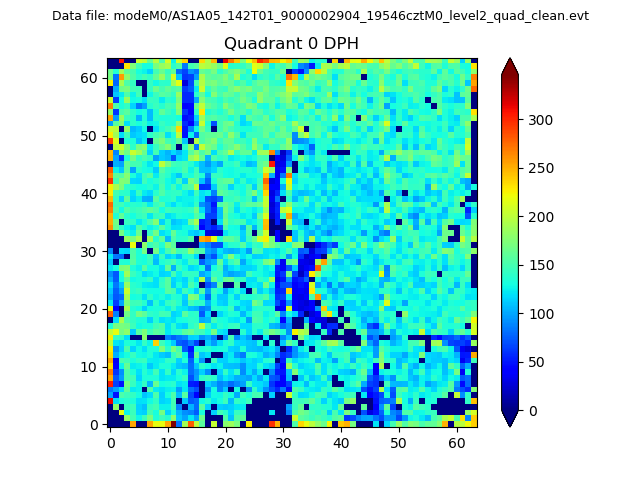 |
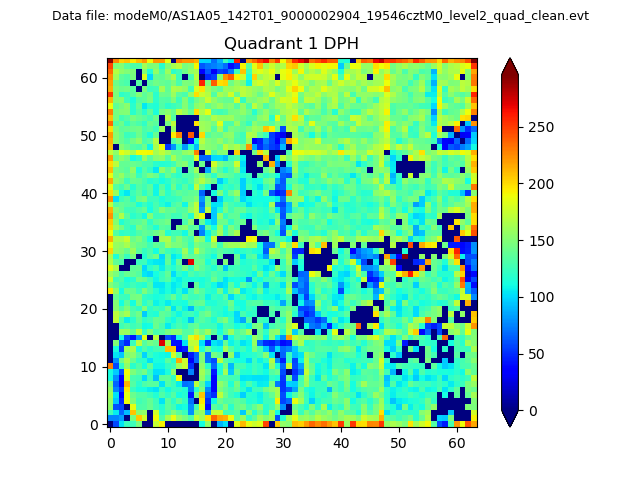 |
Quadrant B |
|---|---|---|---|
| Quadrant D | 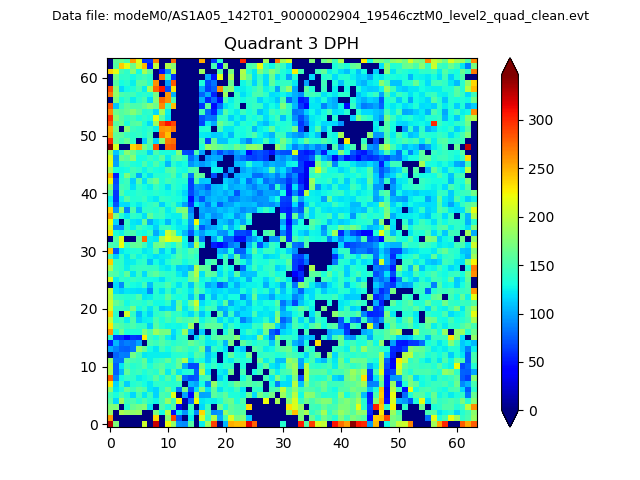 |
 |
Quadrant C |
| Plot type | Count rate plots | Images |
|---|---|---|
| Comparison with Poisson distribution Blue bars denote a histogram of data divided into 1 sec bins. Red curve is a Poisson curve with rate = median count rate of data. |
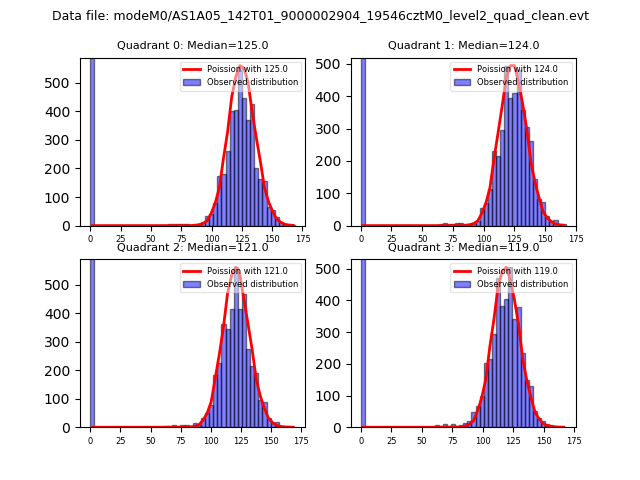 |
 |
| Quadrant-wise count rates Data is divided into 100 sec bins |
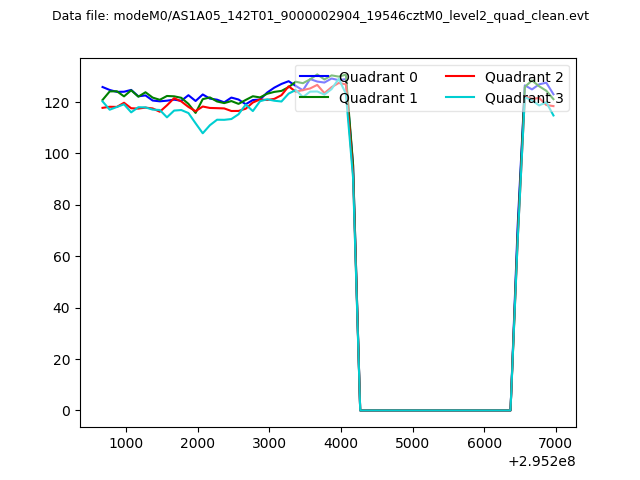 |
|
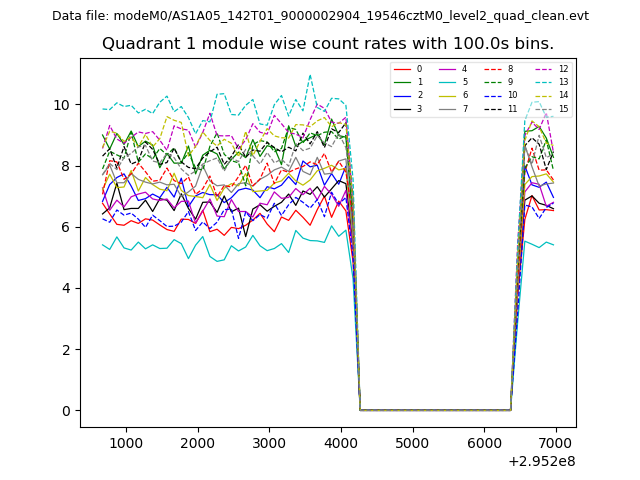
| Module-wise count rates for Quadrant A Data is divided into 100 sec bins |
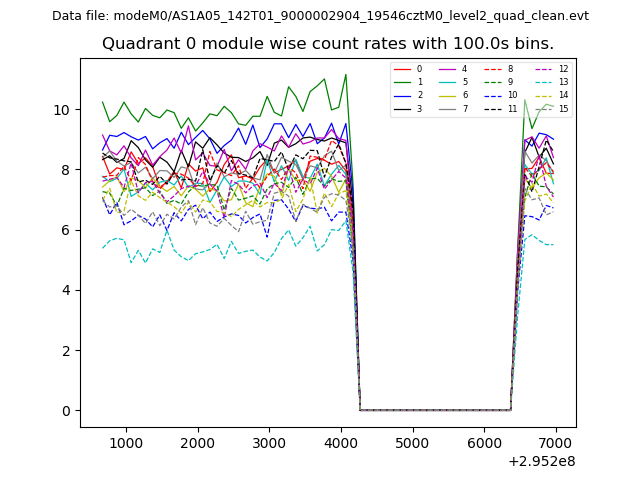 |
 |
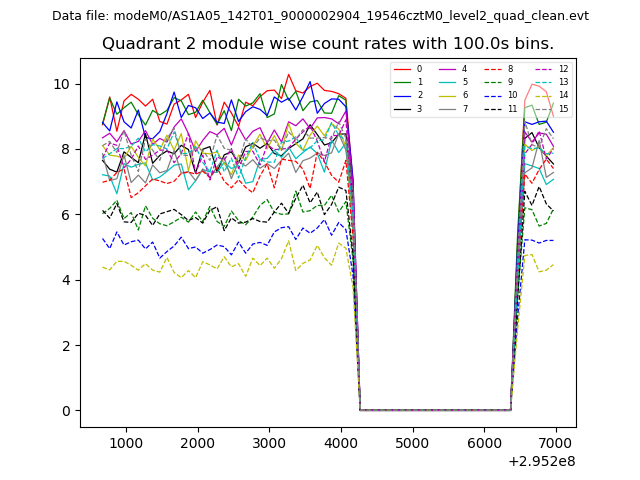
| Module-wise count rates for Quadrant B Data is divided into 100 sec bins |
 |
 |
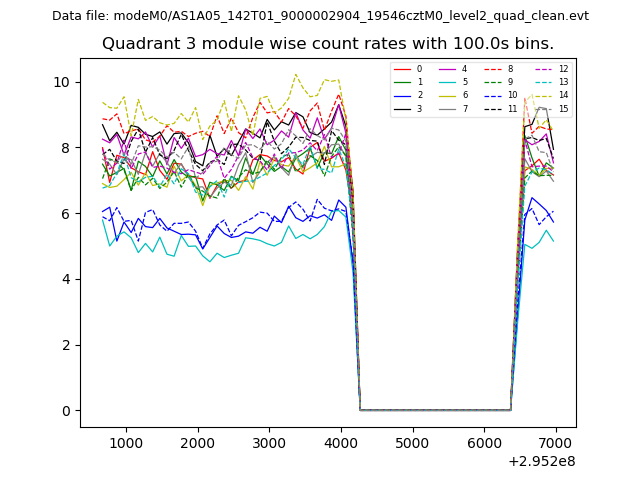
| Module-wise count rates for Quadrant C Data is divided into 100 sec bins |
 |
 |
| Module-wise count rates for Quadrant D Data is divided into 100 sec bins |
 |
 |
| Parameter | Plot |
|---|---|
| CZT HV Monitor | 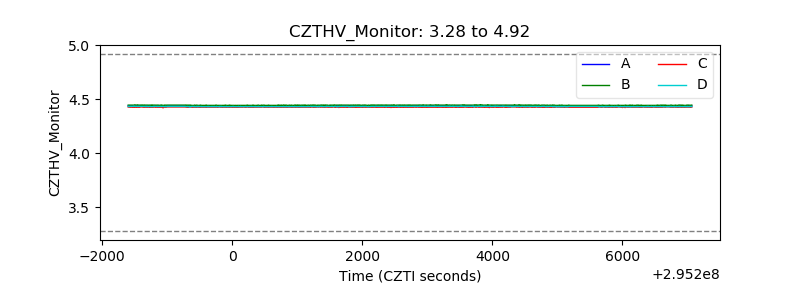 |
| D_VDD | 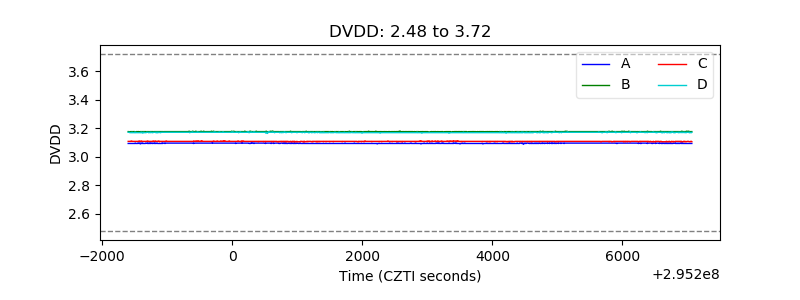 |
| Temperature 1 | 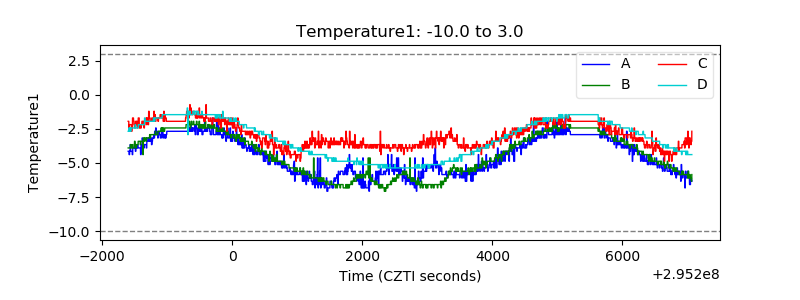 |
| Veto HV Monitor | 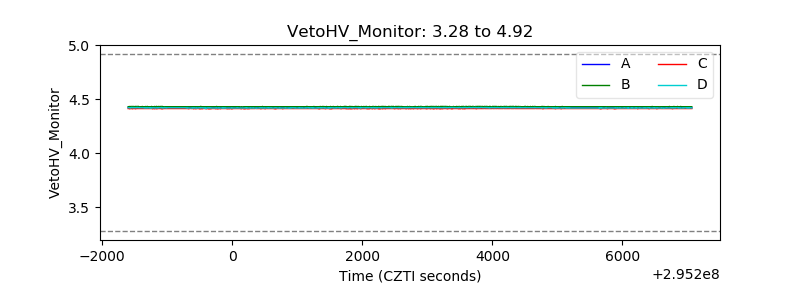 |
| Veto LLD | 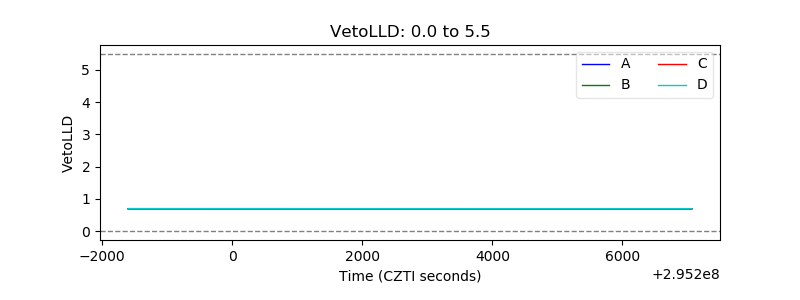 |
| Alpha Counter | 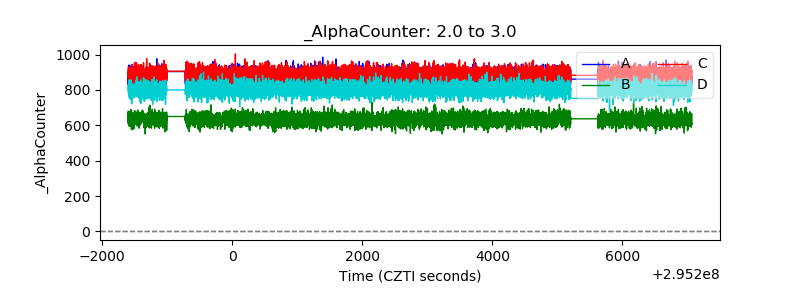 |
| _CPM_Rate | 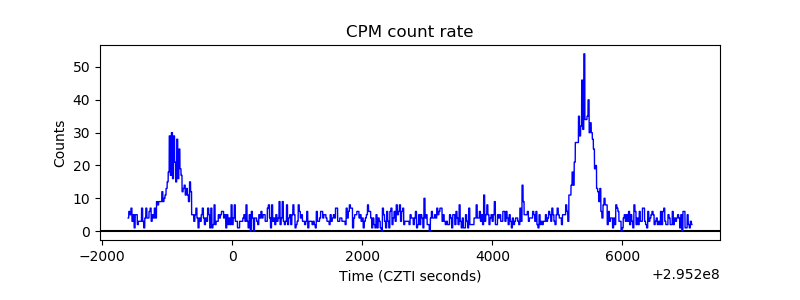 |
| CZT Counter | 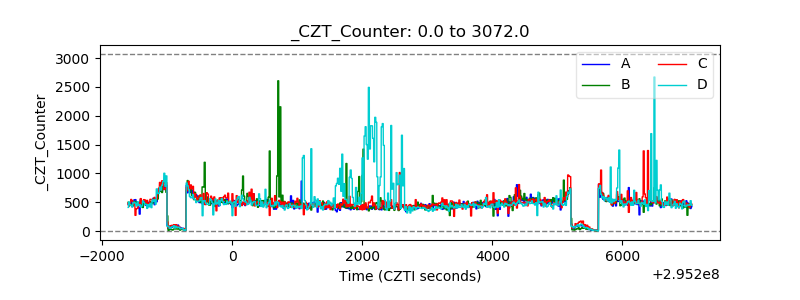 |
| +2.5 Volts monitor |  |
| +5 Volts monitor | 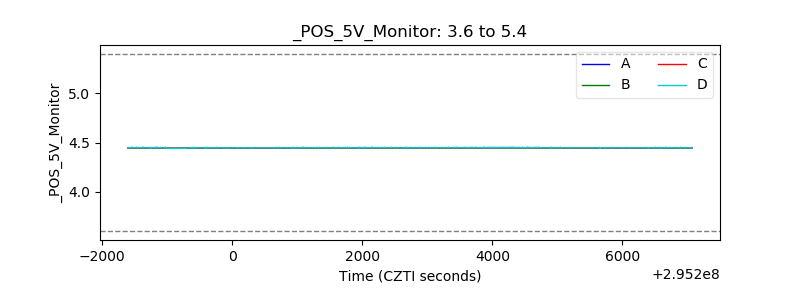 |
| _ROLL_ROT | 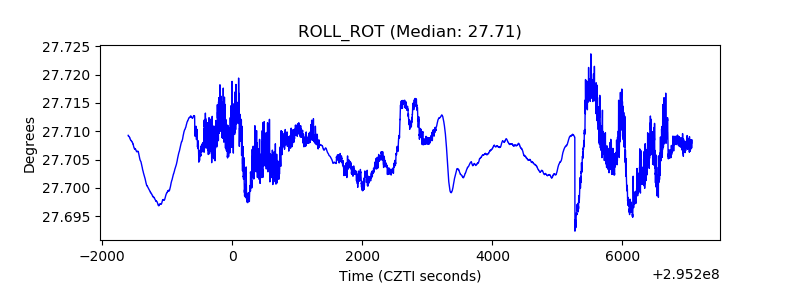 |
| _Roll_DEC | 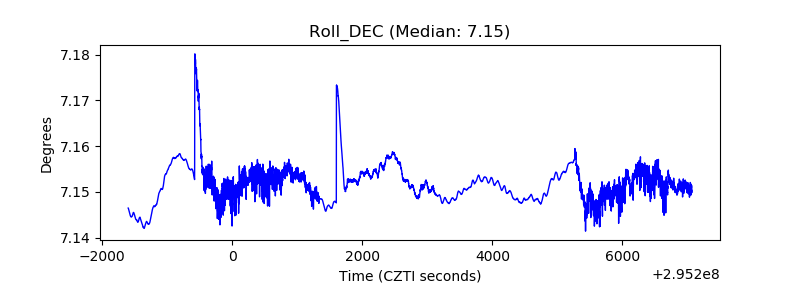 |
| _Roll_RA | 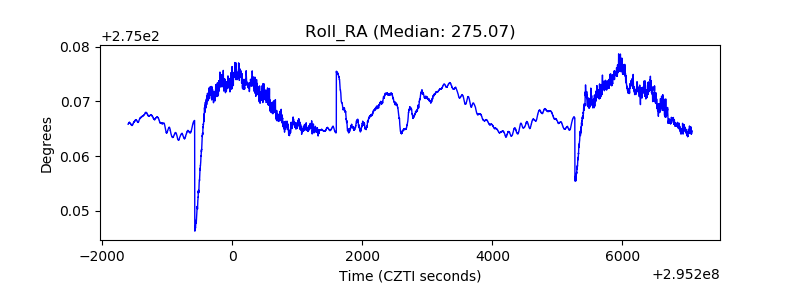 |
| Veto Counter | 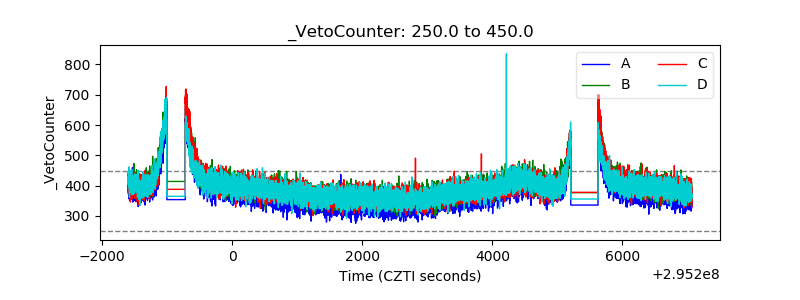 |