| Param | Original file | Final file |
|---|---|---|
| Filename | modeM0/AS1T03_005T01_9000002908cztM0_level2.fits | modeM0/AS1T03_005T01_9000002908cztM0_level2_quad_clean.evt |
| Size (bytes) | 727,833,600 | 669,150,720 |
| Size | 694.1 MB | 638.2 MB |
| Events in quadrant A | 4,561,716 | 4,135,019 |
| Events in quadrant B | 4,388,026 | 4,137,881 |
| Events in quadrant C | 4,379,662 | 3,852,401 |
| Events in quadrant D | 3,562,670 | 2,992,643 |
| Mode M9 | |||
|---|---|---|---|
| Quadrant | BADHDUFLAG | Total packets | Discarded packets |
| A | 0 | 114 | 0 |
| B | 0 | 114 | 0 |
| C | 0 | 114 | 0 |
| D | 0 | 114 | 0 |
| Mode SS | |||
|---|---|---|---|
| Quadrant | BADHDUFLAG | Total packets | Discarded packets |
| A | 0 | 1530 | 0 |
| B | 0 | 1530 | 0 |
| C | 0 | 1530 | 0 |
| D | 0 | 1530 | 0 |
| Mode M0 | |||
|---|---|---|---|
| Quadrant | BADHDUFLAG | Total packets | Discarded packets |
| A | 0 | 156769 | 0 |
| B | 0 | 158197 | 0 |
| C | 0 | 158906 | 0 |
| D | 0 | 249699 | 0 |
| Quadrant | Total seconds | Saturated seconds | Saturation percentage |
|---|---|---|---|
| A | 75044 | 1071 | 1.427163% |
| B | 75044 | 1242 | 1.655029% |
| C | 75044 | 1344 | 1.790949% |
| D | 75044 | 9336 | 12.440701% |
Noise dominated data is calculated using 1-second bins in cleaned event files. If a bin has >2000 counts, and if more than 50% of those come from <1% of pixels, then it is considered to be noise-dominated and hence unusable.
| Quadrant | # 1 sec bins | Bins with >0 counts | Bins with >2000 counts | High rate bins dominated by noise | Noise dominated (total time) | Noise dominated (detector-on time) | Marked lightcurve |
|---|---|---|---|---|---|---|---|
| A | 86614 | 75030 | 0 | 0 | 0.00% | 0.00% |  |
| B | 86614 | 75034 | 0 | 0 | 0.00% | 0.00% |  |
| C | 86614 | 75040 | 0 | 0 | 0.00% | 0.00% |  |
| D | 86614 | 74575 | 0 | 0 | 0.00% | 0.00% |  |
Top three noisy pixels from each quadrant. If the there are fewer than three noisy pixels in the level2.evt file, extra rows are filled as -1
| Pixel properties | Quadrant properties | ||||||
|---|---|---|---|---|---|---|---|
| Quadrant | DetID | PixID | Counts | Sigma | Mean | Median | Sigma |
| A | 0 | 29 | 4421 | 11.6 | 1186 | 1118 | 284.7 |
| A | 7 | 110 | 3745 | 9.23 | 1186 | 1118 | 284.7 |
| A | 9 | 19 | 3507 | 8.39 | 1186 | 1118 | 284.7 |
| B | 2 | 9 | 3540 | 10.79 | 1156 | 1100 | 226.1 |
| B | 2 | 8 | 2975 | 8.29 | 1156 | 1100 | 226.1 |
| B | 3 | 17 | 2926 | 8.08 | 1156 | 1100 | 226.1 |
| C | 1 | 80 | 3268 | 7.41 | 1156 | 1076 | 295.7 |
| C | 1 | 81 | 3191 | 7.15 | 1156 | 1076 | 295.7 |
| C | 12 | 241 | 3095 | 6.83 | 1156 | 1076 | 295.7 |
| D | 7 | 3 | 2537 | 6.04 | 1017 | 928 | 266.4 |
| D | 6 | 38 | 2490 | 5.86 | 1017 | 928 | 266.4 |
| D | 10 | 189 | 2476 | 5.81 | 1017 | 928 | 266.4 |
Histogram calculated using DETX and DETY for each event in the final _common_clean file
| Quadrant A |  |
 |
Quadrant B |
|---|---|---|---|
| Quadrant D |  |
 |
Quadrant C |
| Plot type | Count rate plots | Images |
|---|---|---|
| Comparison with Poisson distribution Blue bars denote a histogram of data divided into 1 sec bins. Red curve is a Poisson curve with rate = median count rate of data. |
 |
 |
| Quadrant-wise count rates Data is divided into 100 sec bins |
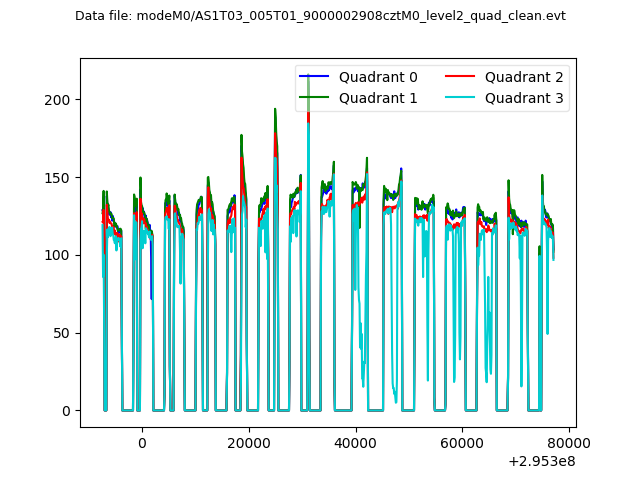 |
|
| Module-wise count rates for Quadrant A Data is divided into 100 sec bins |
 |
 |
| Module-wise count rates for Quadrant B Data is divided into 100 sec bins |
 |
 |
| Module-wise count rates for Quadrant C Data is divided into 100 sec bins |
 |
 |
| Module-wise count rates for Quadrant D Data is divided into 100 sec bins |
 |
 |
| Parameter | Plot |
|---|---|
| CZT HV Monitor |  |
| D_VDD |  |
| Temperature 1 |  |
| Veto HV Monitor |  |
| Veto LLD | 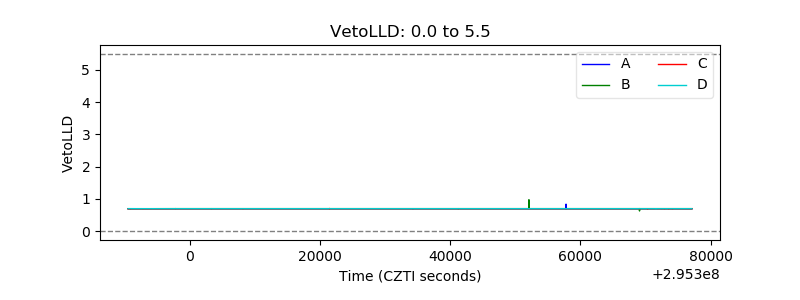 |
| Alpha Counter |  |
| _CPM_Rate |  |
| CZT Counter |  |
| +2.5 Volts monitor |  |
| +5 Volts monitor |  |
| _ROLL_ROT |  |
| _Roll_DEC |  |
| _Roll_RA |  |
| Veto Counter |  |