| Param | Original file | Final file |
|---|---|---|
| Filename | modeM0/AS1T03_005T01_9000002908_19564cztM0_level2.evt | modeM0/AS1T03_005T01_9000002908_19564cztM0_level2_quad_clean.evt |
| Size (bytes) | 527,083,200 | 92,096,640 |
| Size | 502.7 MB | 87.8 MB |
| Events in quadrant A | 3,090,692 | 596,645 |
| Events in quadrant B | 3,264,343 | 604,805 |
| Events in quadrant C | 3,283,893 | 572,680 |
| Events in quadrant D | 5,864,274 | 542,444 |
| Mode M9 | |||
|---|---|---|---|
| Quadrant | BADHDUFLAG | Total packets | Discarded packets |
| A | 0 | 15 | 0 |
| B | 0 | 16 | 0 |
| C | 0 | 16 | 0 |
| D | 0 | 16 | 0 |
| Mode SS | |||
|---|---|---|---|
| Quadrant | BADHDUFLAG | Total packets | Discarded packets |
| A | 0 | 138 | 0 |
| B | 0 | 138 | 0 |
| C | 0 | 138 | 0 |
| D | 0 | 138 | 0 |
| Mode M0 | |||
|---|---|---|---|
| Quadrant | BADHDUFLAG | Total packets | Discarded packets |
| A | 0 | 13782 | 2 |
| B | 0 | 14156 | 2 |
| C | 0 | 14100 | 2 |
| D | 0 | 22223 | 3 |
| Quadrant | Total seconds | Saturated seconds | Saturation percentage |
|---|---|---|---|
| A | 6776 | 23 | 0.339433% |
| B | 6776 | 41 | 0.605077% |
| C | 6776 | 57 | 0.841204% |
| D | 6775 | 343 | 5.062731% |
Noise dominated data is calculated using 1-second bins in cleaned event files. If a bin has >2000 counts, and if more than 50% of those come from <1% of pixels, then it is considered to be noise-dominated and hence unusable.
| Quadrant | # 1 sec bins | Bins with >0 counts | Bins with >2000 counts | High rate bins dominated by noise | Noise dominated (total time) | Noise dominated (detector-on time) | Marked lightcurve |
|---|---|---|---|---|---|---|---|
| A | 7721 | 6777 | 0 | 0 | 0.00% | 0.00% | 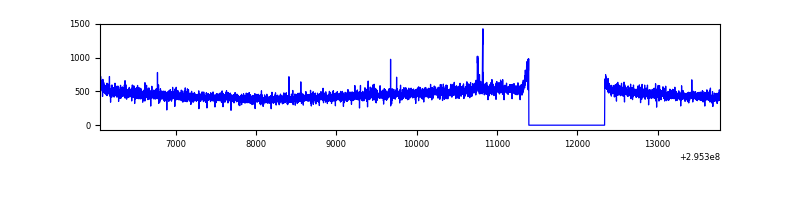 |
| B | 7721 | 6777 | 14 | 14 | 0.18% | 0.21% | 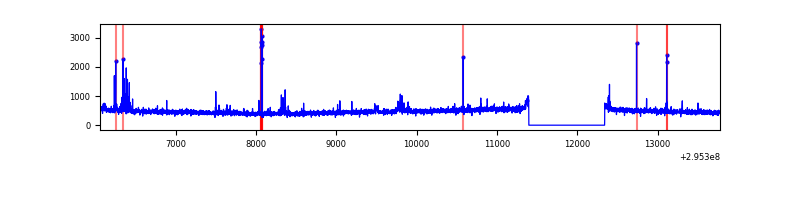 |
| C | 7721 | 6777 | 1 | 1 | 0.01% | 0.01% | 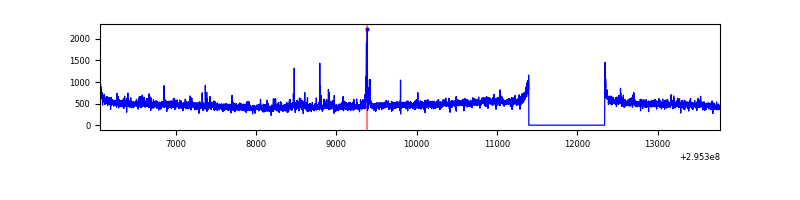 |
| D | 7720 | 6776 | 277 | 277 | 3.59% | 4.09% | 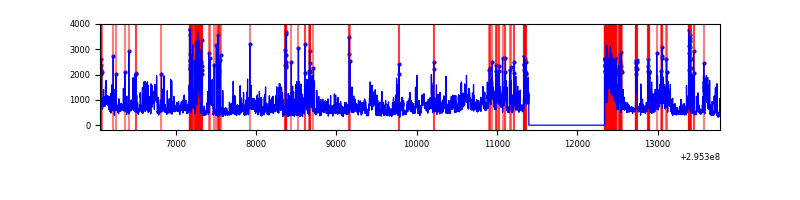 |
Top three noisy pixels from each quadrant. If the there are fewer than three noisy pixels in the level2.evt file, extra rows are filled as -1
| Pixel properties | Quadrant properties | ||||||
|---|---|---|---|---|---|---|---|
| Quadrant | DetID | PixID | Counts | Sigma | Mean | Median | Sigma |
| A | 15 | 174 | 11055 | 63.04 | 799 | 781 | 163.0 |
| A | 13 | 254 | 8612 | 48.05 | 799 | 781 | 163.0 |
| A | 0 | 226 | 6899 | 37.54 | 799 | 781 | 163.0 |
| B | 3 | 64 | 54842 | 352.37 | 799 | 778 | 153.4 |
| B | 0 | 197 | 24661 | 155.66 | 799 | 778 | 153.4 |
| B | 0 | 230 | 23355 | 147.15 | 799 | 778 | 153.4 |
| C | 14 | 238 | 118952 | 652.17 | 768 | 774 | 181.2 |
| C | 3 | 233 | 68410 | 373.25 | 768 | 774 | 181.2 |
| C | 7 | 247 | 39103 | 211.52 | 768 | 774 | 181.2 |
| D | 7 | 238 | 1160806 | 6257.1 | 760 | 737 | 185.4 |
| D | 1 | 52 | 888957 | 4790.82 | 760 | 737 | 185.4 |
| D | 12 | 218 | 632539 | 3407.77 | 760 | 737 | 185.4 |
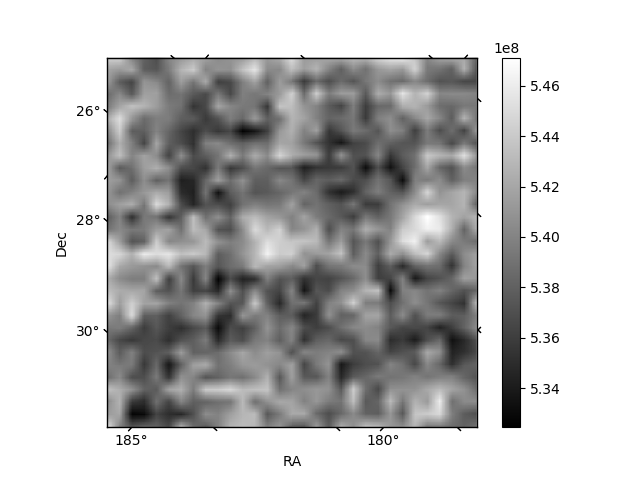
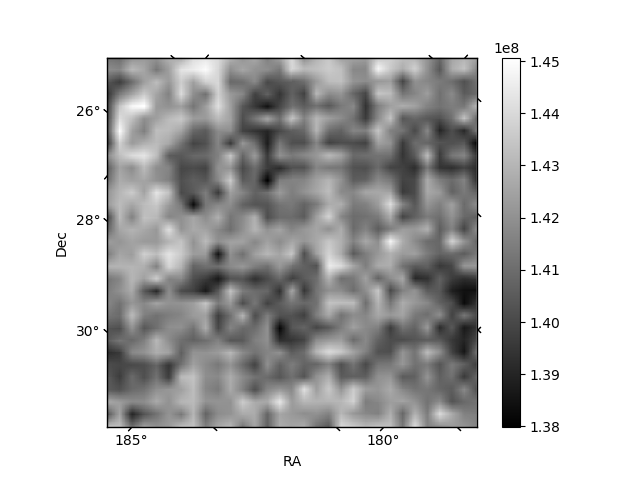
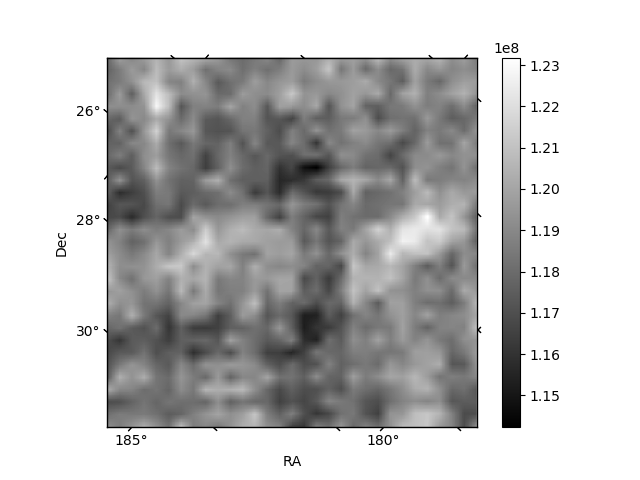
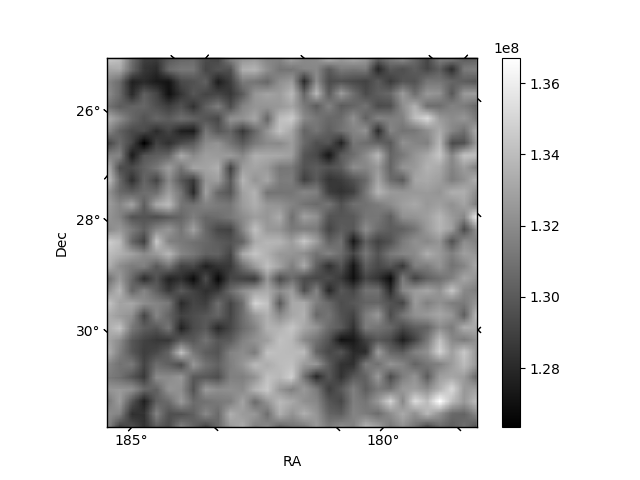
Histogram calculated using DETX and DETY for each event in the final _common_clean file
| Quadrant A | 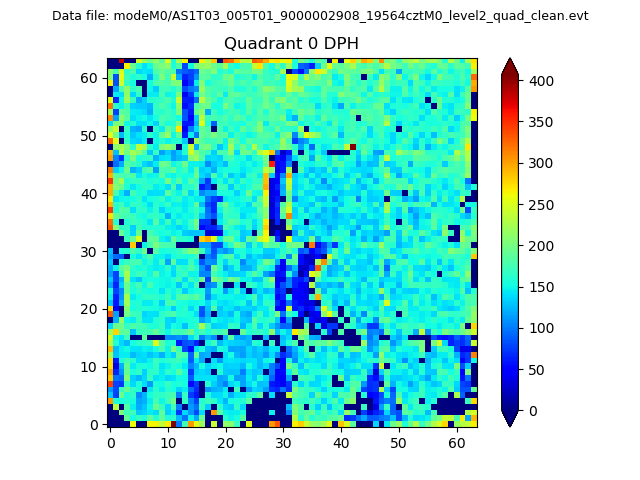 |
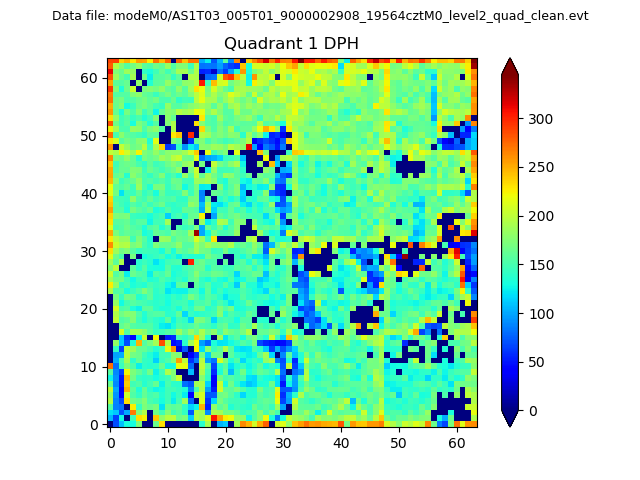 |
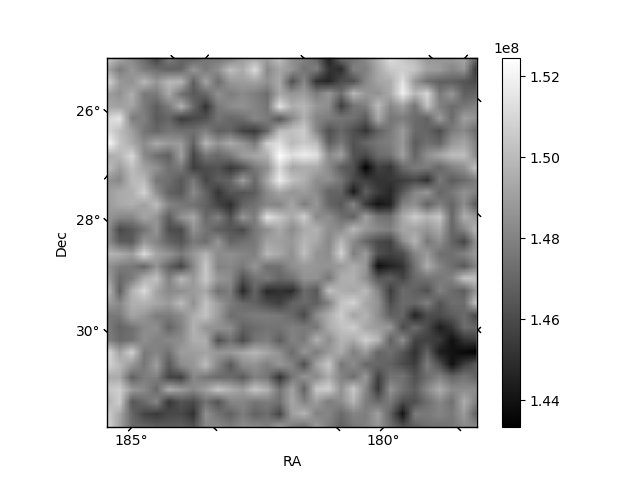
Quadrant B |
|---|---|---|---|
| Quadrant D | 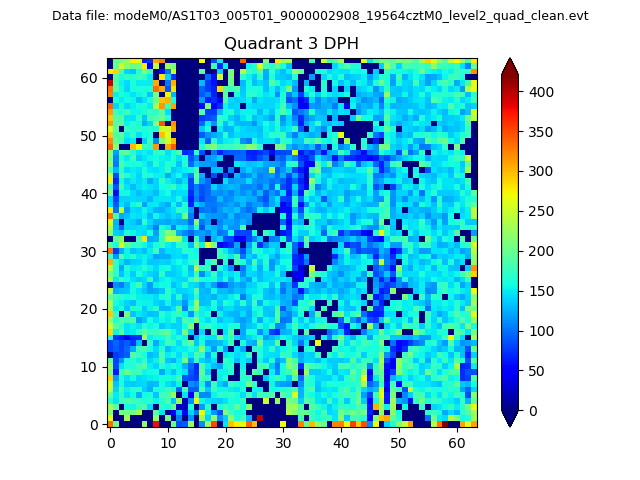 |
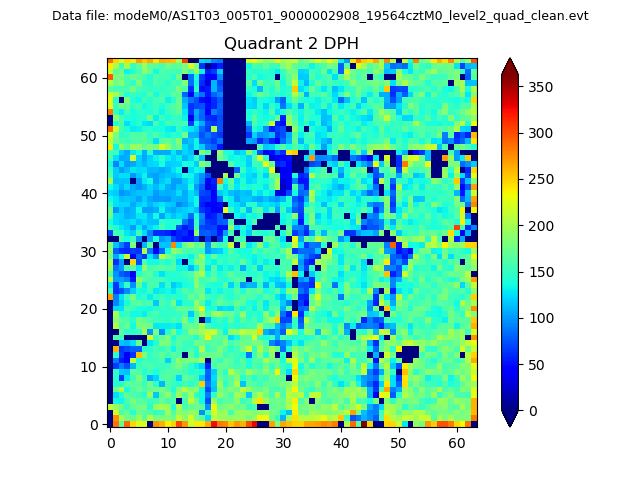 |
Quadrant C |
| Plot type | Count rate plots | Images |
|---|---|---|
| Comparison with Poisson distribution Blue bars denote a histogram of data divided into 1 sec bins. Red curve is a Poisson curve with rate = median count rate of data. |
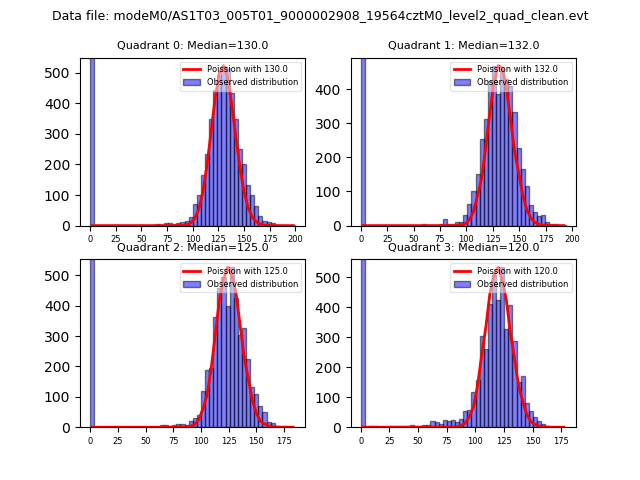 |
 |
| Quadrant-wise count rates Data is divided into 100 sec bins |
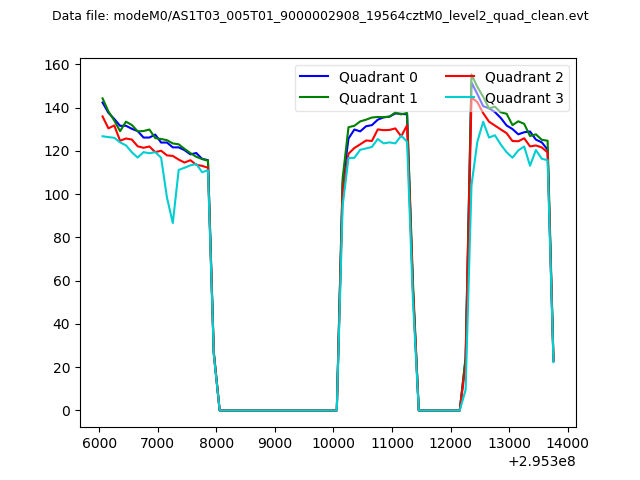 |
|
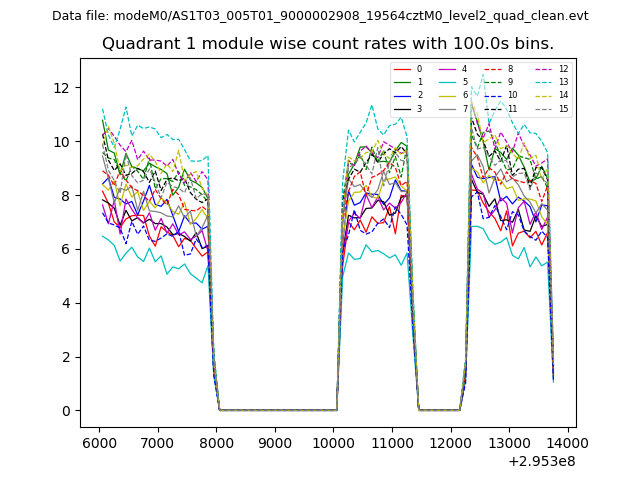
| Module-wise count rates for Quadrant A Data is divided into 100 sec bins |
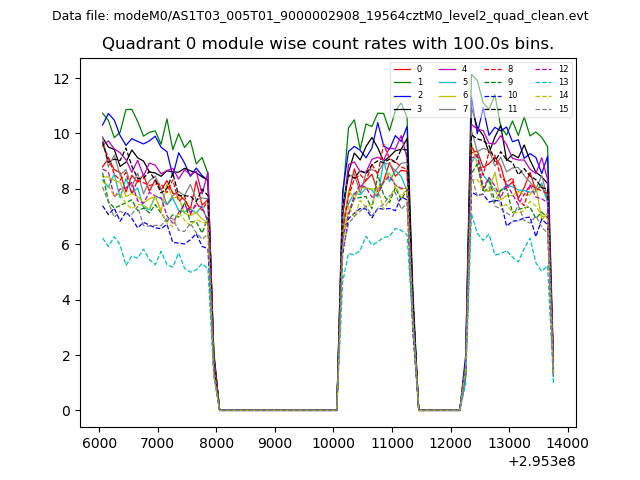 |
 |
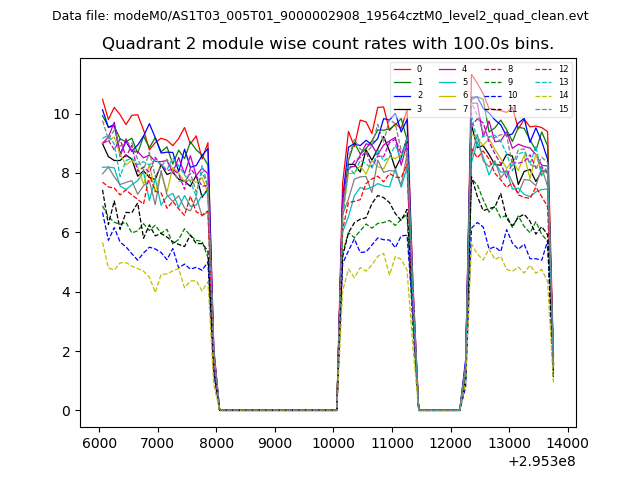
| Module-wise count rates for Quadrant B Data is divided into 100 sec bins |
 |
 |
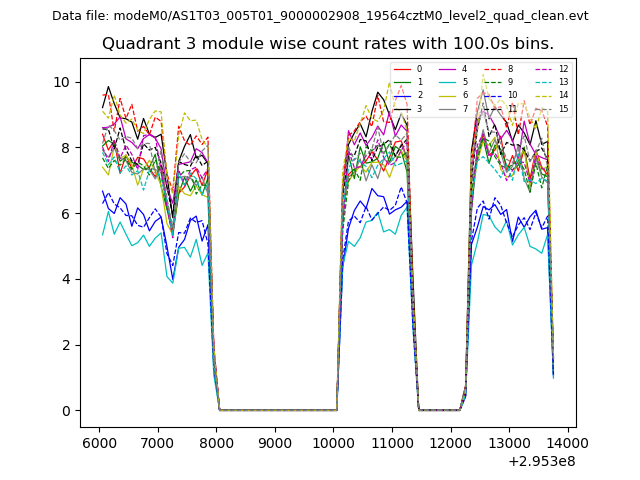
| Module-wise count rates for Quadrant C Data is divided into 100 sec bins |
 |
 |
| Module-wise count rates for Quadrant D Data is divided into 100 sec bins |
 |
 |
| Parameter | Plot |
|---|---|
| CZT HV Monitor | 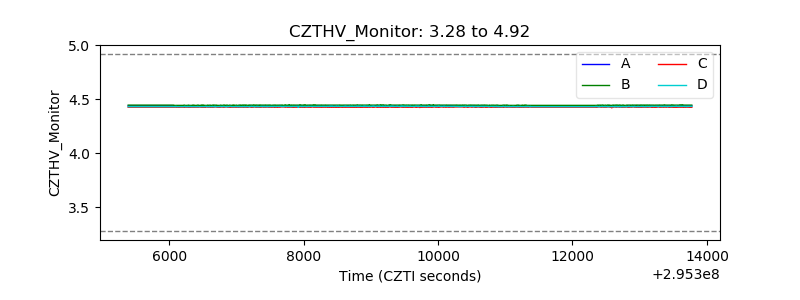 |
| D_VDD | 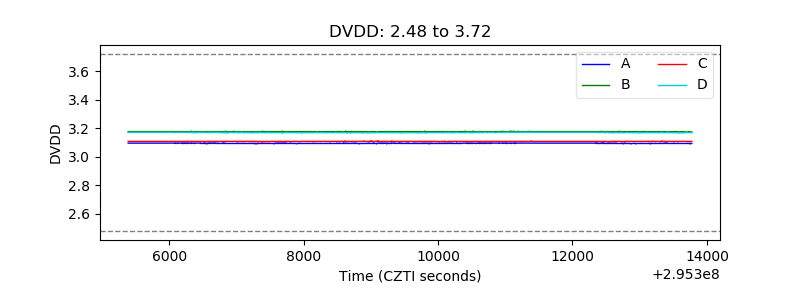 |
| Temperature 1 | 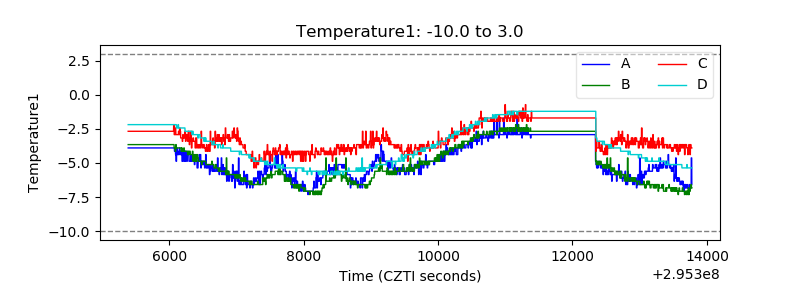 |
| Veto HV Monitor | 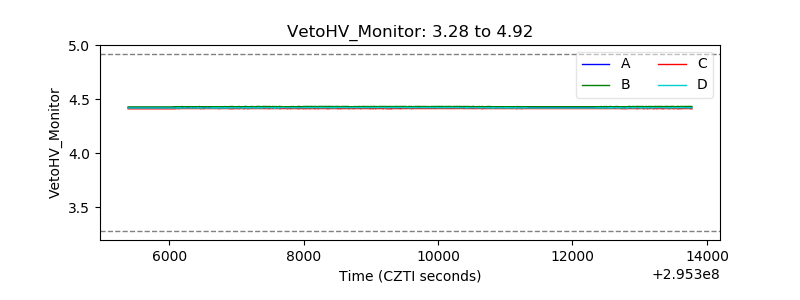 |
| Veto LLD | 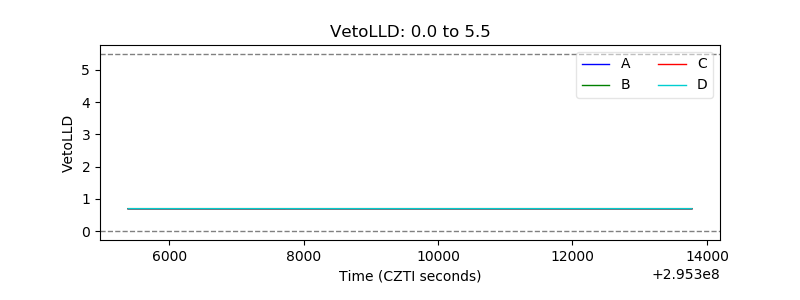 |
| Alpha Counter | 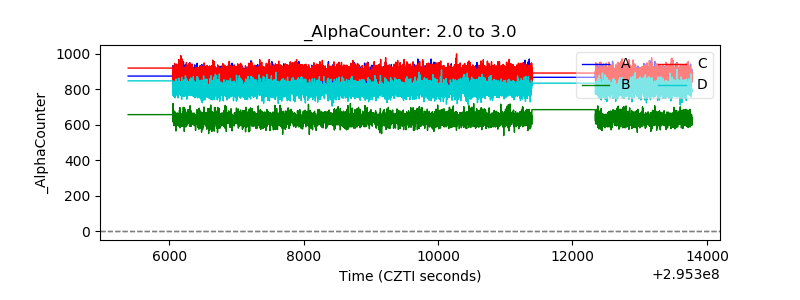 |
| _CPM_Rate | 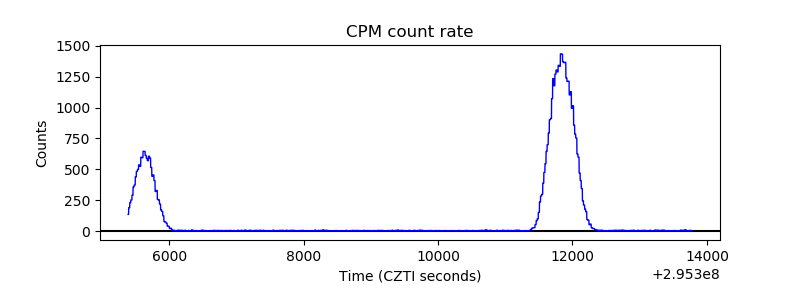 |
| CZT Counter | 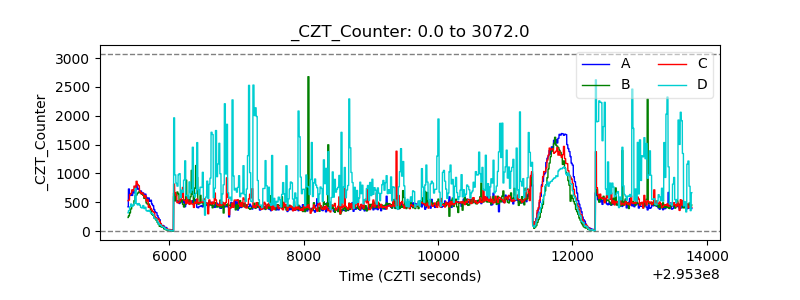 |
| +2.5 Volts monitor | 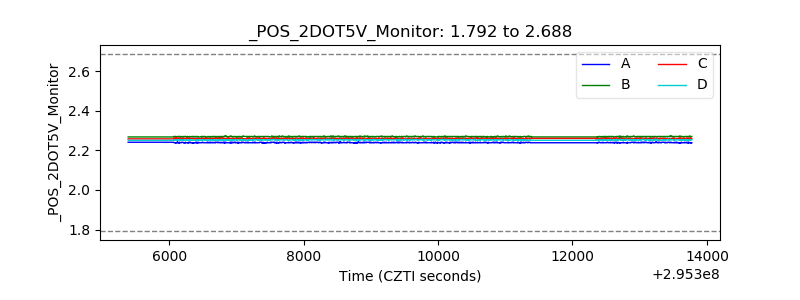 |
| +5 Volts monitor | 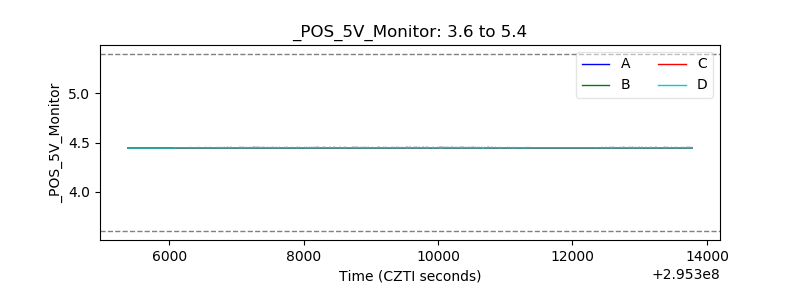 |
| _ROLL_ROT | 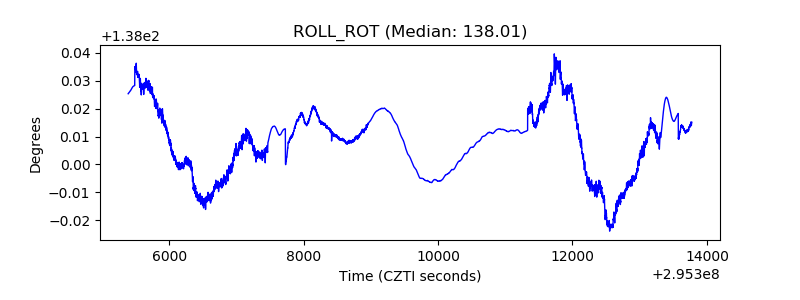 |
| _Roll_DEC | 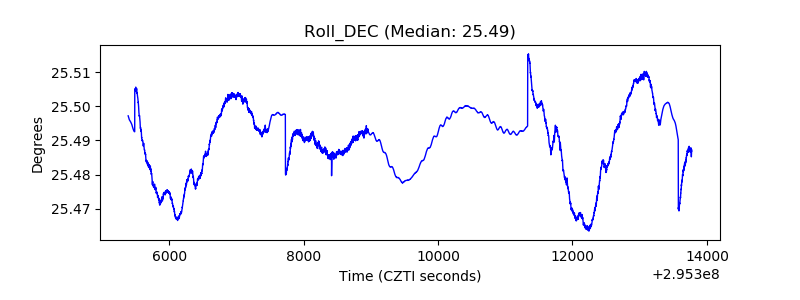 |
| _Roll_RA | 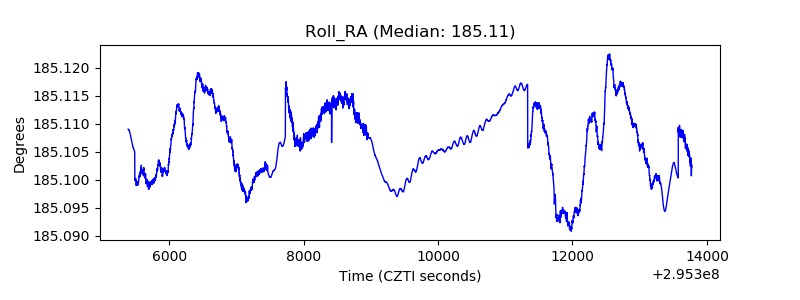 |
| Veto Counter | 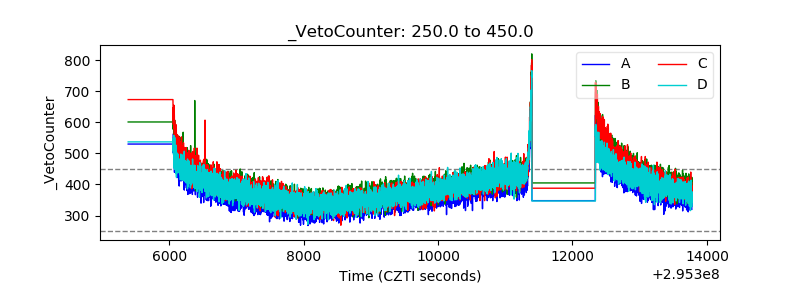 |