| Param | Original file | Final file |
|---|---|---|
| Filename | modeM0/AS1T03_005T01_9000002908_19565cztM0_level2.evt | modeM0/AS1T03_005T01_9000002908_19565cztM0_level2_quad_clean.evt |
| Size (bytes) | 523,094,400 | 85,694,400 |
| Size | 498.9 MB | 81.7 MB |
| Events in quadrant A | 3,017,971 | 556,044 |
| Events in quadrant B | 3,138,375 | 566,374 |
| Events in quadrant C | 3,177,240 | 533,589 |
| Events in quadrant D | 6,067,864 | 485,722 |
| Mode M9 | |||
|---|---|---|---|
| Quadrant | BADHDUFLAG | Total packets | Discarded packets |
| A | 0 | 17 | 0 |
| B | 0 | 18 | 0 |
| C | 0 | 18 | 0 |
| D | 0 | 18 | 0 |
| Mode SS | |||
|---|---|---|---|
| Quadrant | BADHDUFLAG | Total packets | Discarded packets |
| A | 0 | 132 | 0 |
| B | 0 | 132 | 0 |
| C | 0 | 132 | 0 |
| D | 0 | 132 | 0 |
| Mode M0 | |||
|---|---|---|---|
| Quadrant | BADHDUFLAG | Total packets | Discarded packets |
| A | 0 | 13206 | 2 |
| B | 0 | 13462 | 2 |
| C | 0 | 13577 | 2 |
| D | 0 | 22617 | 2 |
| Quadrant | Total seconds | Saturated seconds | Saturation percentage |
|---|---|---|---|
| A | 6496 | 9 | 0.138547% |
| B | 6496 | 18 | 0.277094% |
| C | 6496 | 37 | 0.569581% |
| D | 6496 | 511 | 7.866379% |
Noise dominated data is calculated using 1-second bins in cleaned event files. If a bin has >2000 counts, and if more than 50% of those come from <1% of pixels, then it is considered to be noise-dominated and hence unusable.
| Quadrant | # 1 sec bins | Bins with >0 counts | Bins with >2000 counts | High rate bins dominated by noise | Noise dominated (total time) | Noise dominated (detector-on time) | Marked lightcurve |
|---|---|---|---|---|---|---|---|
| A | 7586 | 6497 | 0 | 0 | 0.00% | 0.00% | 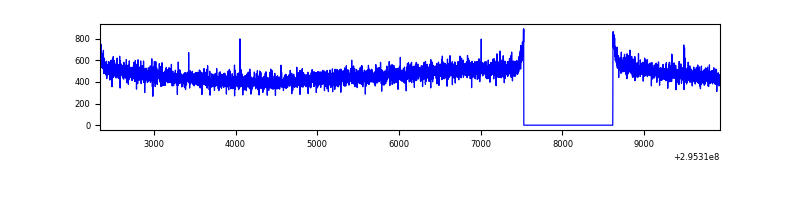 |
| B | 7586 | 6497 | 6 | 6 | 0.08% | 0.09% |  |
| C | 7586 | 6497 | 0 | 0 | 0.00% | 0.00% | 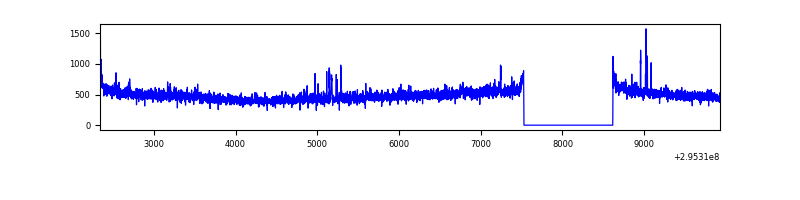 |
| D | 7586 | 6497 | 461 | 461 | 6.08% | 7.10% | 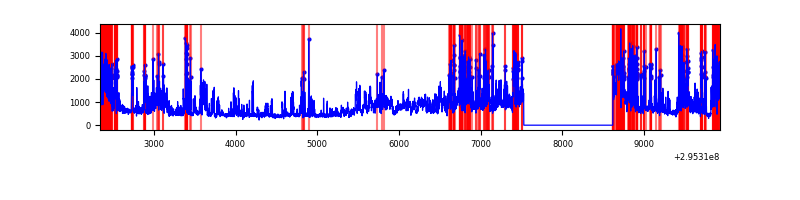 |
Top three noisy pixels from each quadrant. If the there are fewer than three noisy pixels in the level2.evt file, extra rows are filled as -1
| Pixel properties | Quadrant properties | ||||||
|---|---|---|---|---|---|---|---|
| Quadrant | DetID | PixID | Counts | Sigma | Mean | Median | Sigma |
| A | 13 | 254 | 8343 | 47.9 | 783 | 767 | 158.2 |
| A | 0 | 226 | 6662 | 37.27 | 783 | 767 | 158.2 |
| A | 3 | 137 | 6361 | 35.37 | 783 | 767 | 158.2 |
| B | 3 | 64 | 45858 | 299.06 | 785 | 764 | 150.8 |
| B | 12 | 111 | 18286 | 116.2 | 785 | 764 | 150.8 |
| B | 11 | 111 | 16206 | 102.41 | 785 | 764 | 150.8 |
| C | 14 | 238 | 118044 | 668.21 | 750 | 756 | 175.5 |
| C | 3 | 233 | 75564 | 426.19 | 750 | 756 | 175.5 |
| C | 7 | 247 | 41208 | 230.46 | 750 | 756 | 175.5 |
| D | 12 | 218 | 1468513 | 8181.58 | 728 | 706 | 179.4 |
| D | 1 | 52 | 931572 | 5188.66 | 728 | 706 | 179.4 |
| D | 7 | 238 | 773744 | 4308.93 | 728 | 706 | 179.4 |
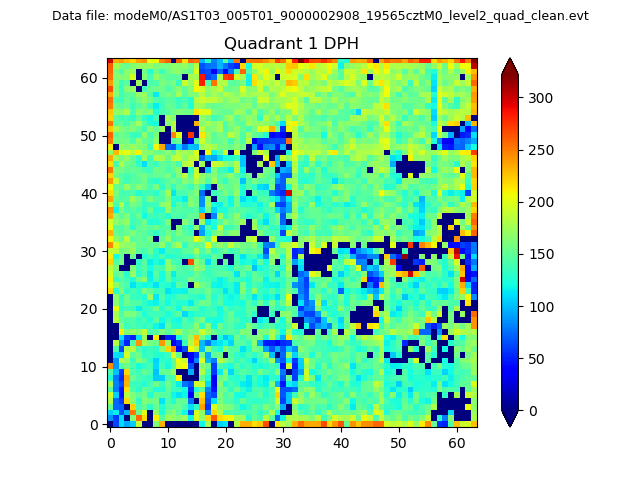
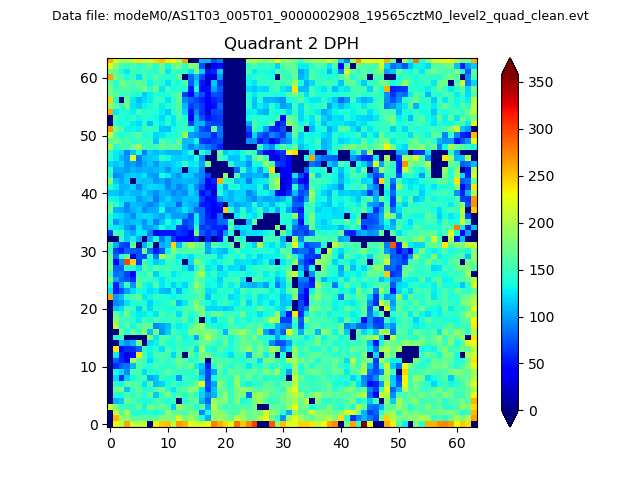
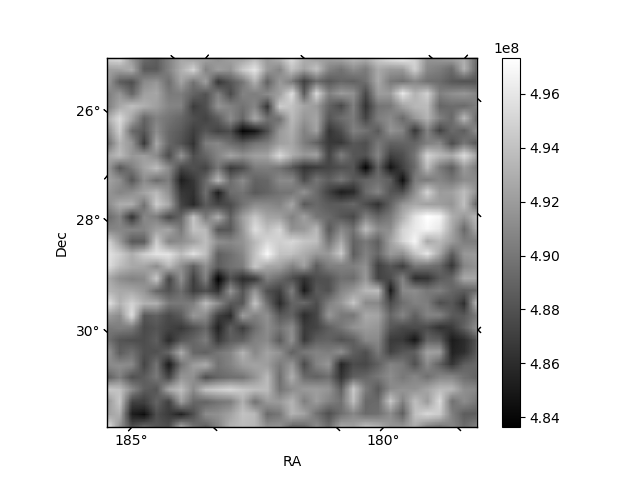
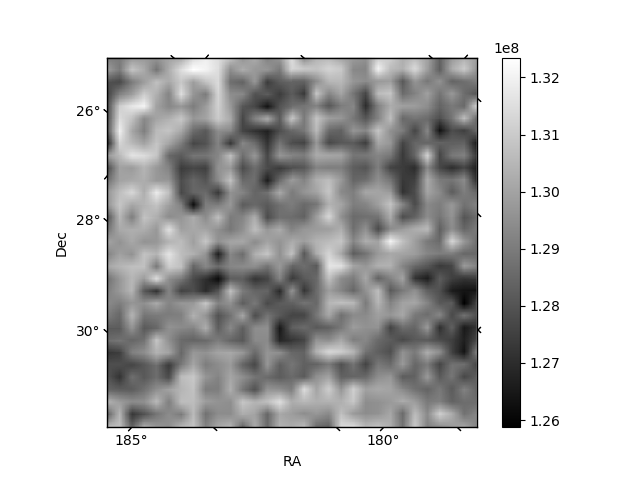
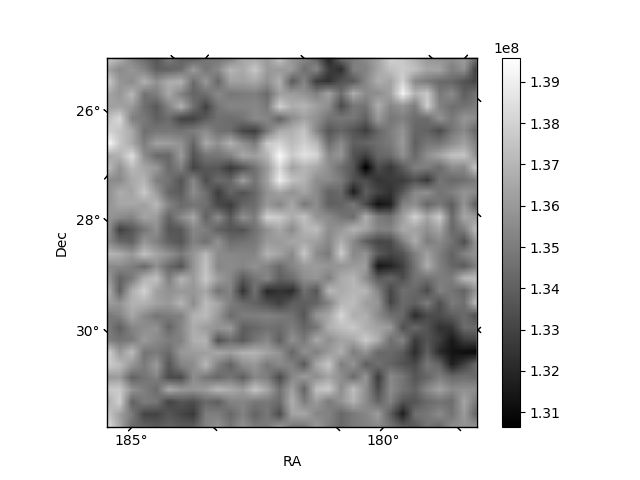
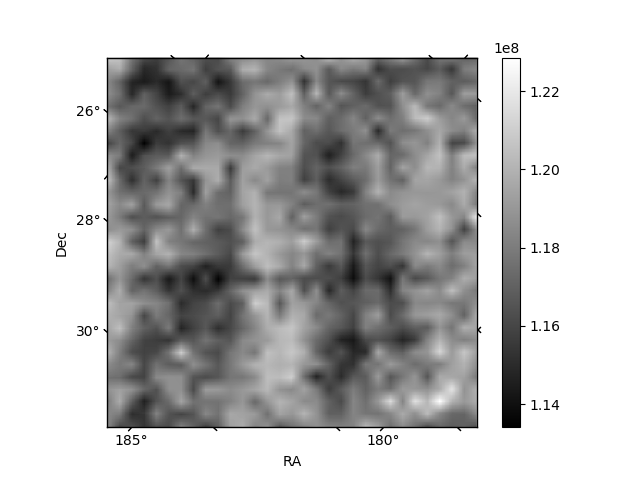
Histogram calculated using DETX and DETY for each event in the final _common_clean file
| Quadrant A | 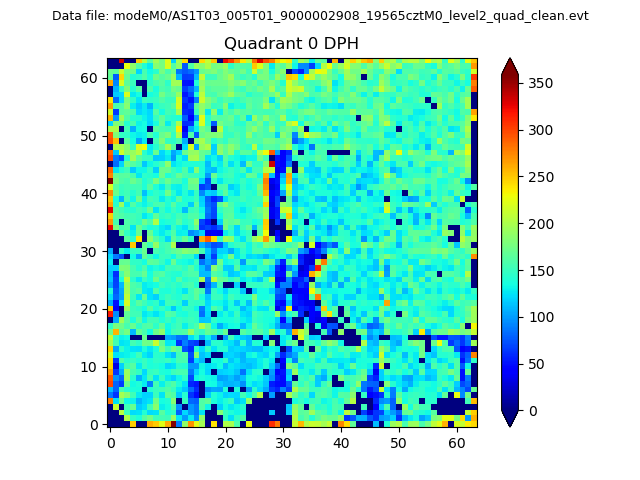 |
 |
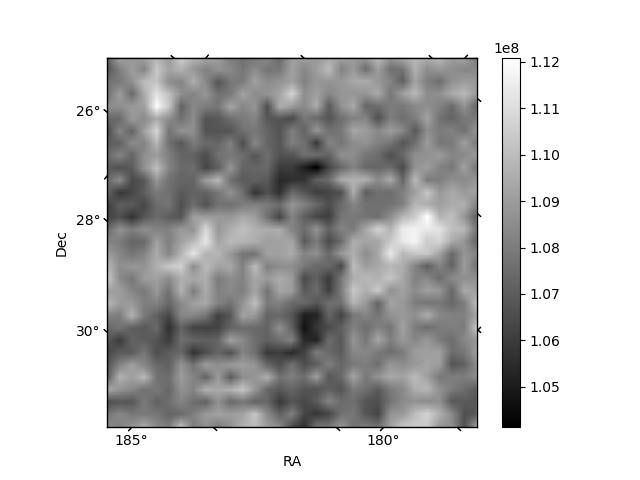
Quadrant B |
|---|---|---|---|
| Quadrant D | 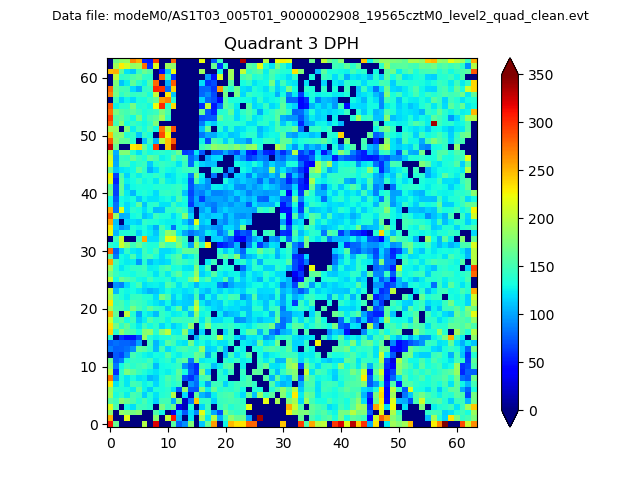 |
 |
Quadrant C |
| Plot type | Count rate plots | Images |
|---|---|---|
| Comparison with Poisson distribution Blue bars denote a histogram of data divided into 1 sec bins. Red curve is a Poisson curve with rate = median count rate of data. |
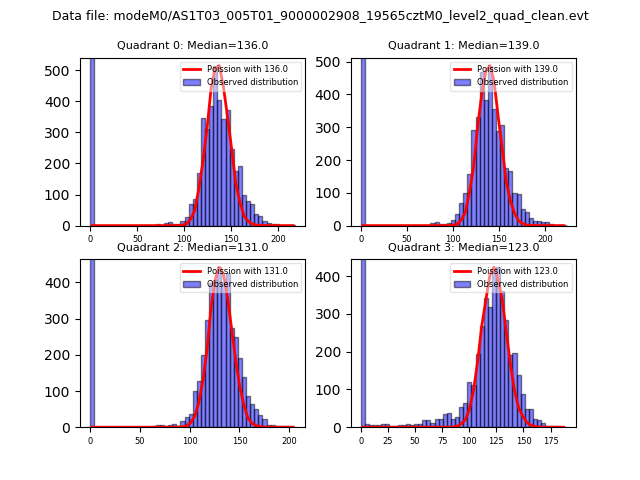 |
 |
| Quadrant-wise count rates Data is divided into 100 sec bins |
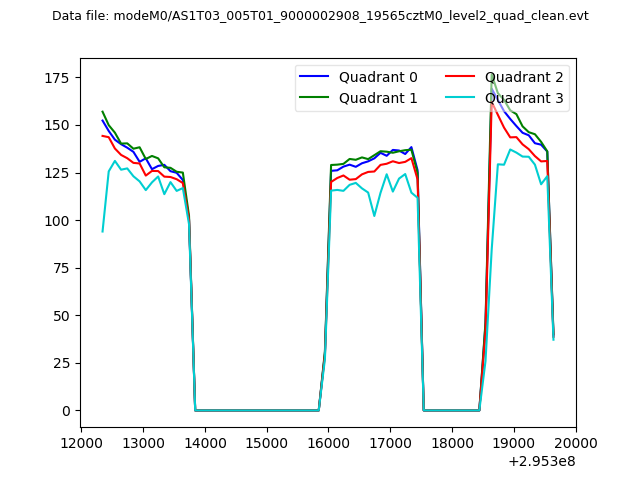 |
|
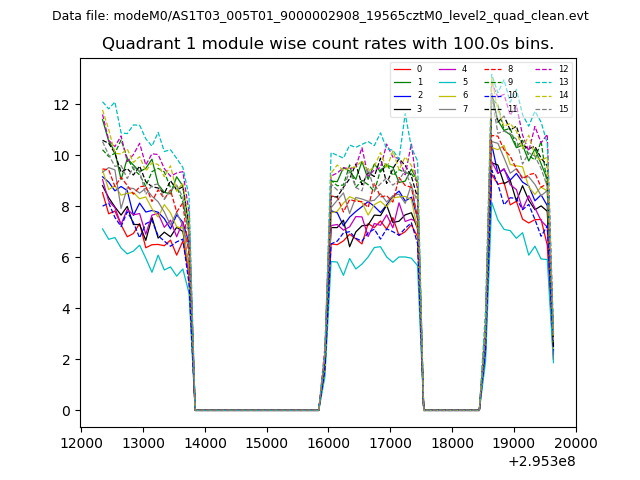
| Module-wise count rates for Quadrant A Data is divided into 100 sec bins |
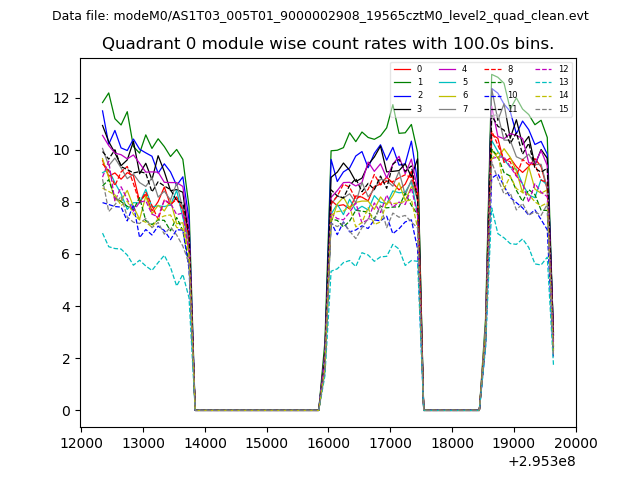 |
 |
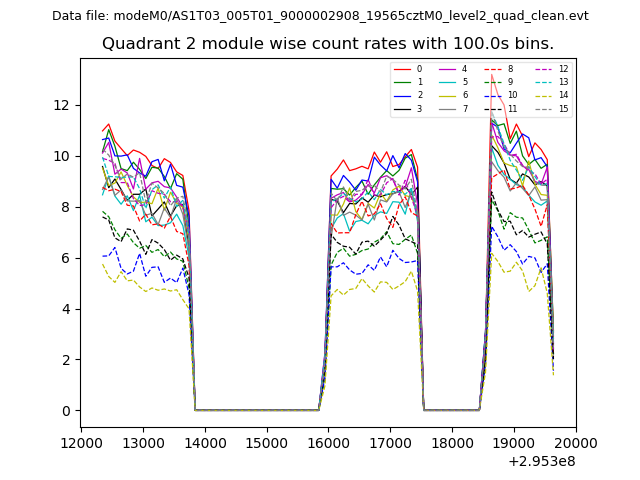
| Module-wise count rates for Quadrant B Data is divided into 100 sec bins |
 |
 |
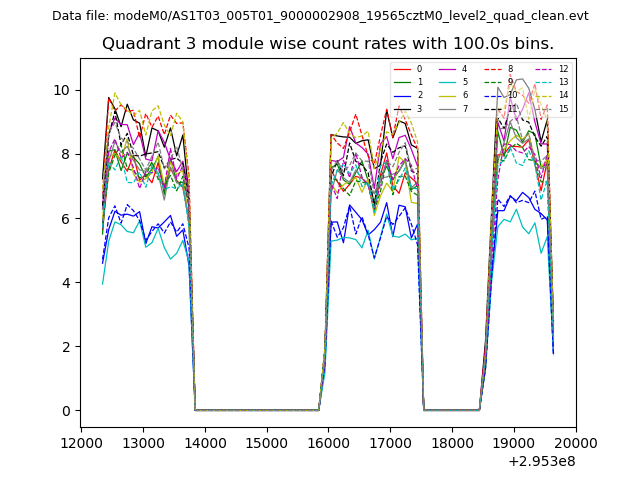
| Module-wise count rates for Quadrant C Data is divided into 100 sec bins |
 |
 |
| Module-wise count rates for Quadrant D Data is divided into 100 sec bins |
 |
 |
| Parameter | Plot |
|---|---|
| CZT HV Monitor | 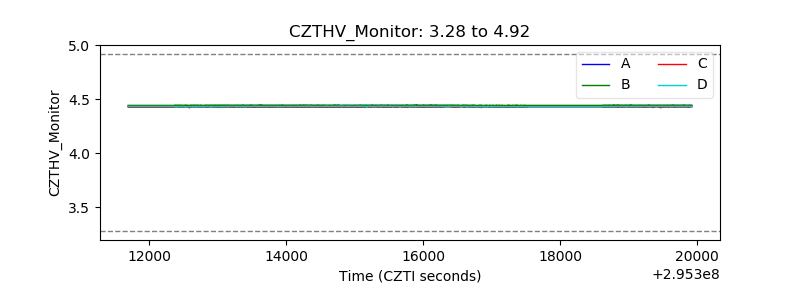 |
| D_VDD |  |
| Temperature 1 | 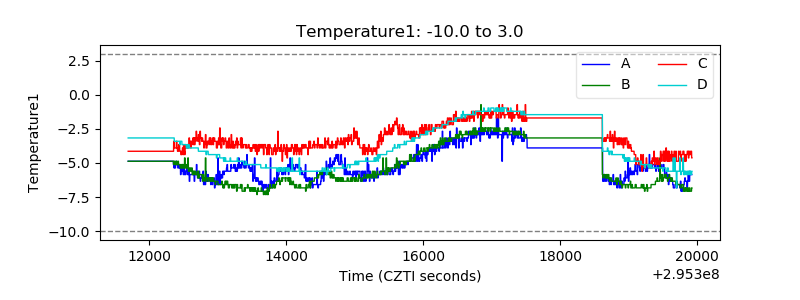 |
| Veto HV Monitor | 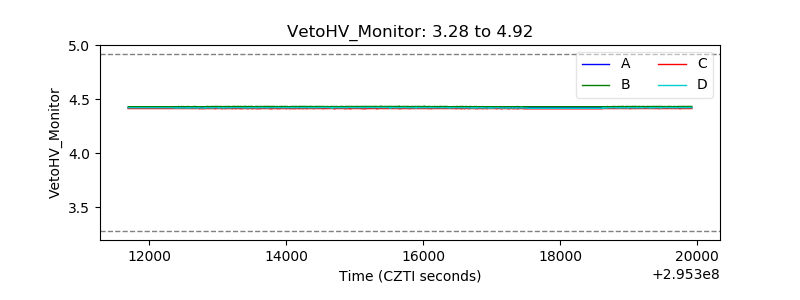 |
| Veto LLD | 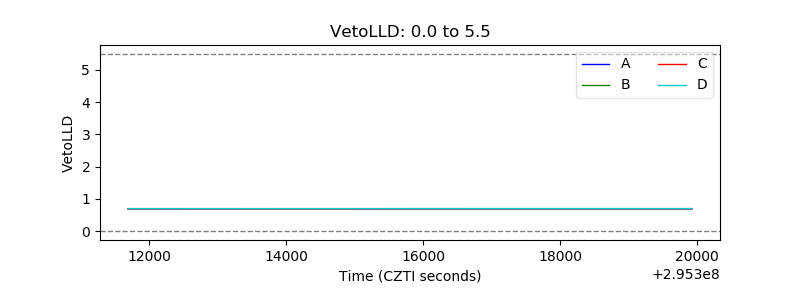 |
| Alpha Counter | 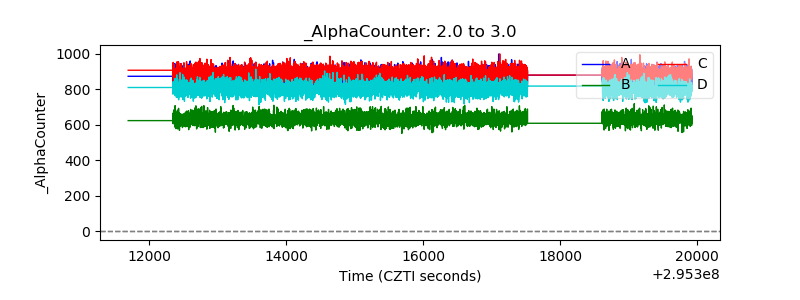 |
| _CPM_Rate | 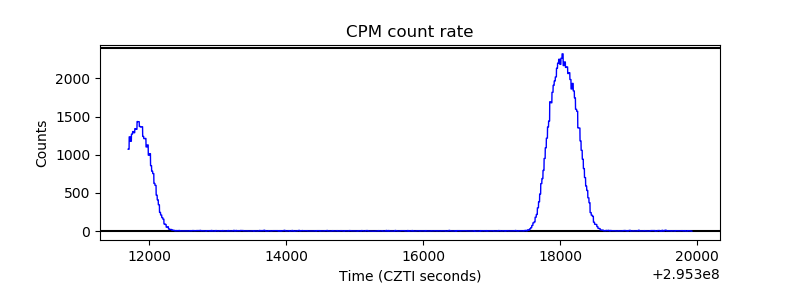 |
| CZT Counter | 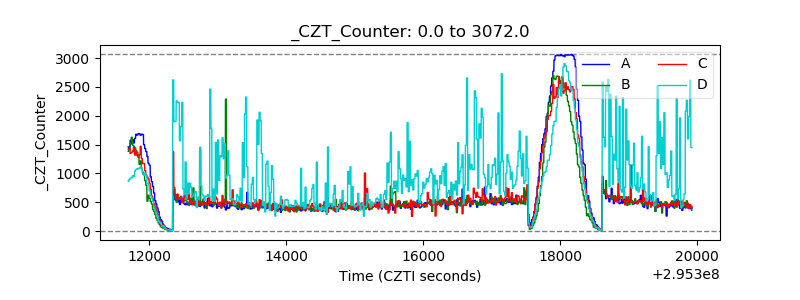 |
| +2.5 Volts monitor |  |
| +5 Volts monitor | 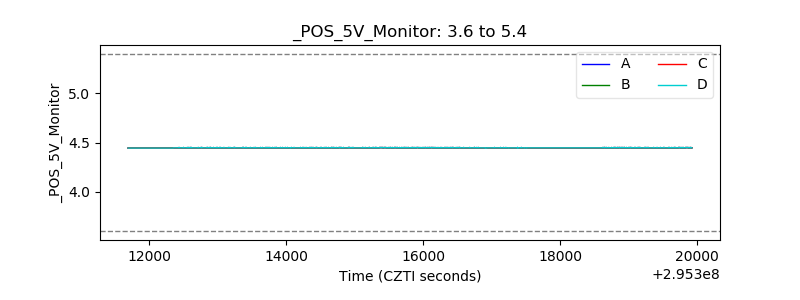 |
| _ROLL_ROT | 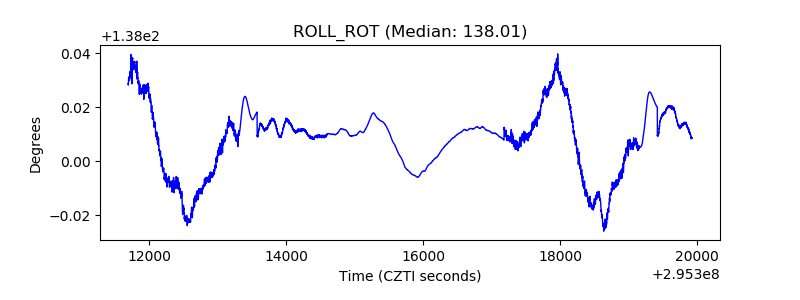 |
| _Roll_DEC |  |
| _Roll_RA | 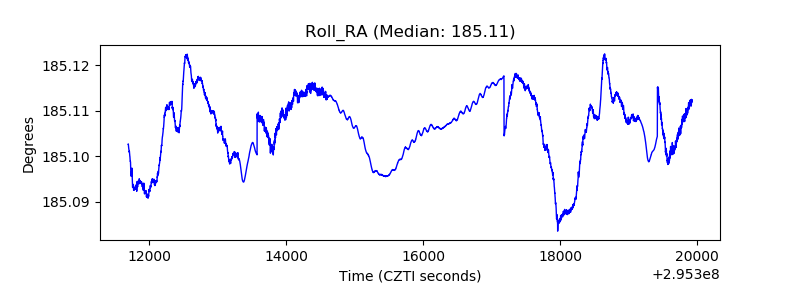 |
| Veto Counter | 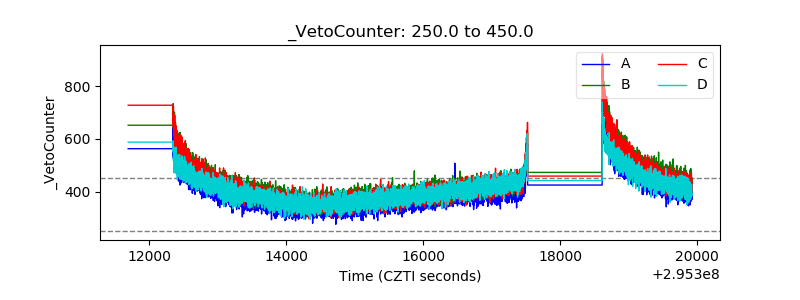 |