| Param | Original file | Final file |
|---|---|---|
| Filename | modeM0/AS1T03_005T01_9000002908_19567cztM0_level2.evt | modeM0/AS1T03_005T01_9000002908_19567cztM0_level2_quad_clean.evt |
| Size (bytes) | 548,006,400 | 79,943,040 |
| Size | 522.6 MB | 76.2 MB |
| Events in quadrant A | 3,062,741 | 518,311 |
| Events in quadrant B | 3,145,499 | 530,681 |
| Events in quadrant C | 3,158,428 | 494,050 |
| Events in quadrant D | 6,805,433 | 440,601 |
| Mode M9 | |||
|---|---|---|---|
| Quadrant | BADHDUFLAG | Total packets | Discarded packets |
| A | 0 | 17 | 0 |
| B | 0 | 18 | 0 |
| C | 0 | 18 | 0 |
| D | 0 | 18 | 0 |
| Mode SS | |||
|---|---|---|---|
| Quadrant | BADHDUFLAG | Total packets | Discarded packets |
| A | 0 | 128 | 0 |
| B | 0 | 128 | 0 |
| C | 0 | 128 | 0 |
| D | 0 | 128 | 0 |
| Mode M0 | |||
|---|---|---|---|
| Quadrant | BADHDUFLAG | Total packets | Discarded packets |
| A | 0 | 12976 | 2 |
| B | 0 | 13147 | 2 |
| C | 0 | 13205 | 2 |
| D | 0 | 24600 | 2 |
| Quadrant | Total seconds | Saturated seconds | Saturation percentage |
|---|---|---|---|
| A | 6258 | 44 | 0.703100% |
| B | 6258 | 52 | 0.830936% |
| C | 6258 | 65 | 1.038671% |
| D | 6258 | 928 | 14.829019% |
Noise dominated data is calculated using 1-second bins in cleaned event files. If a bin has >2000 counts, and if more than 50% of those come from <1% of pixels, then it is considered to be noise-dominated and hence unusable.
| Quadrant | # 1 sec bins | Bins with >0 counts | Bins with >2000 counts | High rate bins dominated by noise | Noise dominated (total time) | Noise dominated (detector-on time) | Marked lightcurve |
|---|---|---|---|---|---|---|---|
| A | 7423 | 6258 | 0 | 0 | 0.00% | 0.00% | 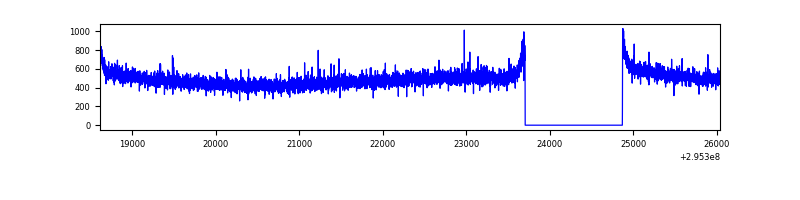 |
| B | 7423 | 6258 | 1 | 1 | 0.01% | 0.02% | 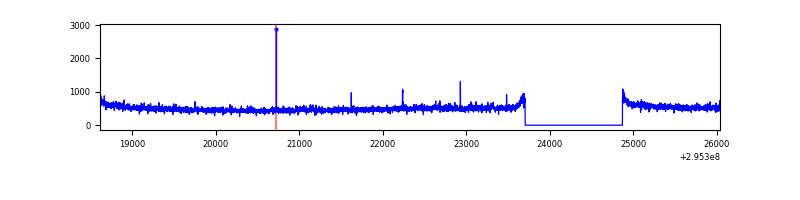 |
| C | 7423 | 6259 | 0 | 0 | 0.00% | 0.00% | 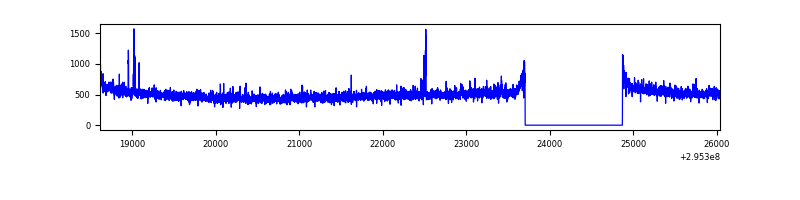 |
| D | 7423 | 6258 | 856 | 856 | 11.53% | 13.68% | 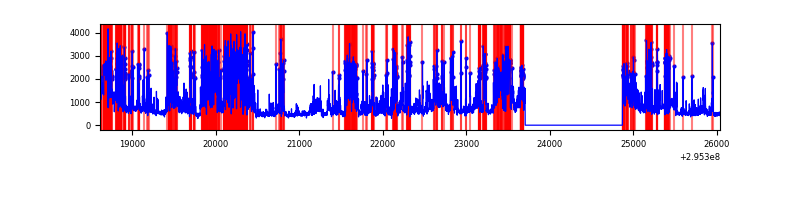 |
Top three noisy pixels from each quadrant. If the there are fewer than three noisy pixels in the level2.evt file, extra rows are filled as -1
| Pixel properties | Quadrant properties | ||||||
|---|---|---|---|---|---|---|---|
| Quadrant | DetID | PixID | Counts | Sigma | Mean | Median | Sigma |
| A | 13 | 254 | 8676 | 49.67 | 792 | 776 | 159.1 |
| A | 13 | 210 | 6883 | 38.4 | 792 | 776 | 159.1 |
| A | 0 | 226 | 6874 | 38.34 | 792 | 776 | 159.1 |
| B | 0 | 198 | 42020 | 277.41 | 791 | 773 | 148.7 |
| B | 12 | 111 | 18042 | 116.14 | 791 | 773 | 148.7 |
| B | 11 | 111 | 16247 | 104.07 | 791 | 773 | 148.7 |
| C | 14 | 238 | 120845 | 681.41 | 753 | 758 | 176.2 |
| C | 3 | 233 | 44482 | 248.1 | 753 | 758 | 176.2 |
| C | 7 | 247 | 41632 | 231.93 | 753 | 758 | 176.2 |
| D | 12 | 218 | 2982664 | 17100.03 | 714 | 694 | 174.4 |
| D | 1 | 52 | 615477 | 3525.46 | 714 | 694 | 174.4 |
| D | 7 | 238 | 344736 | 1972.9 | 714 | 694 | 174.4 |
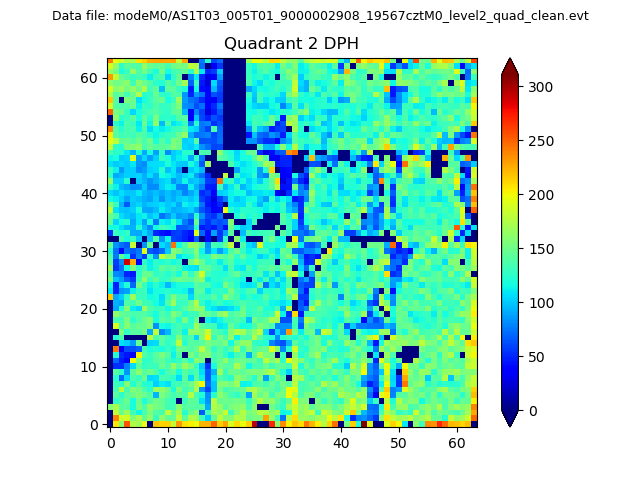
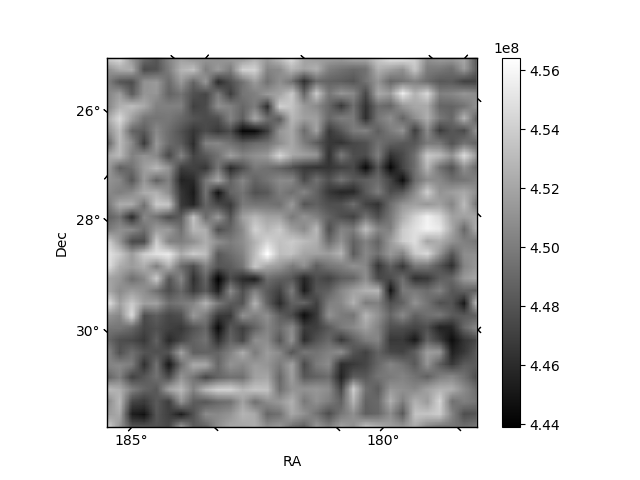
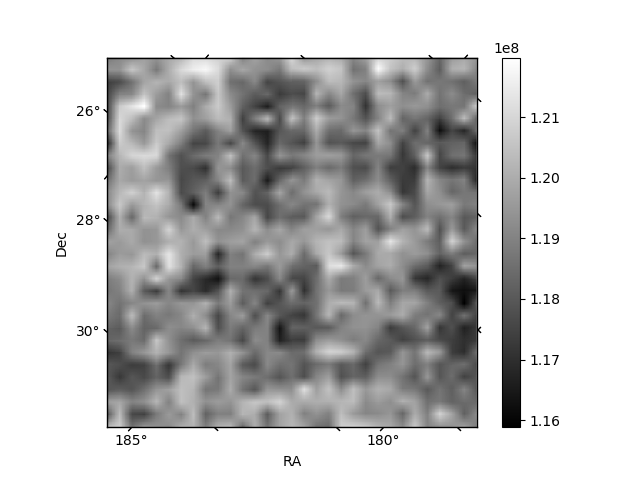
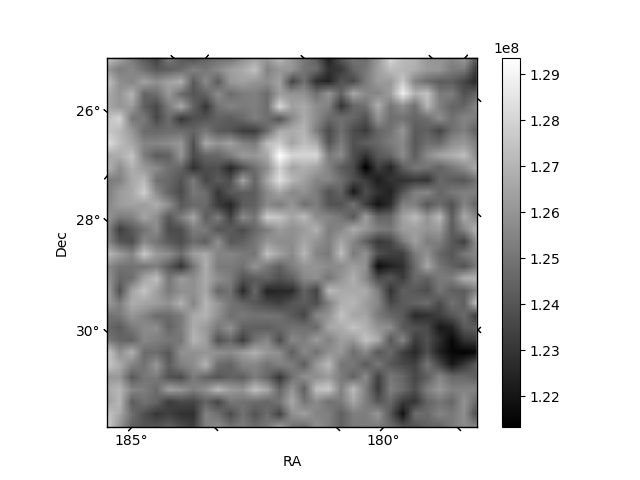
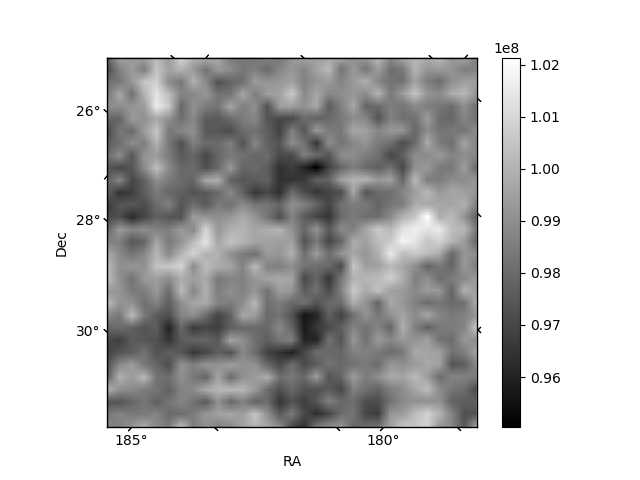
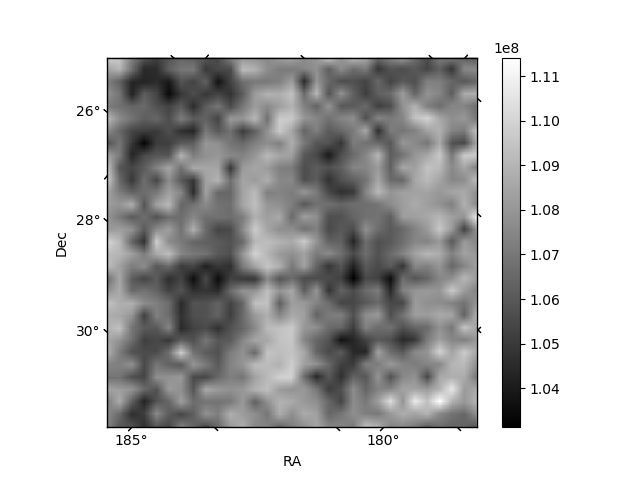
Histogram calculated using DETX and DETY for each event in the final _common_clean file
| Quadrant A | 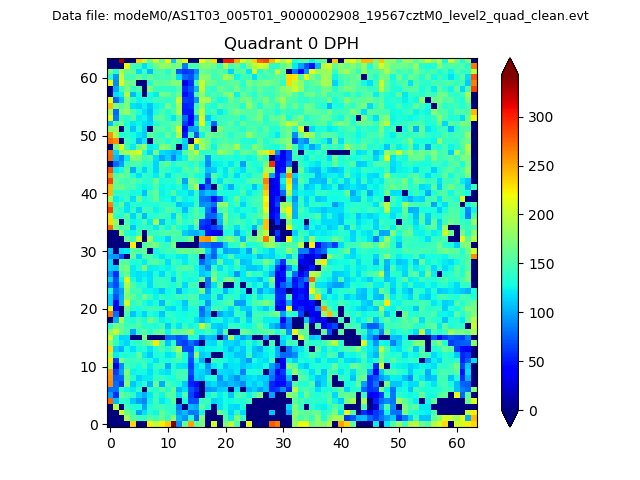 |
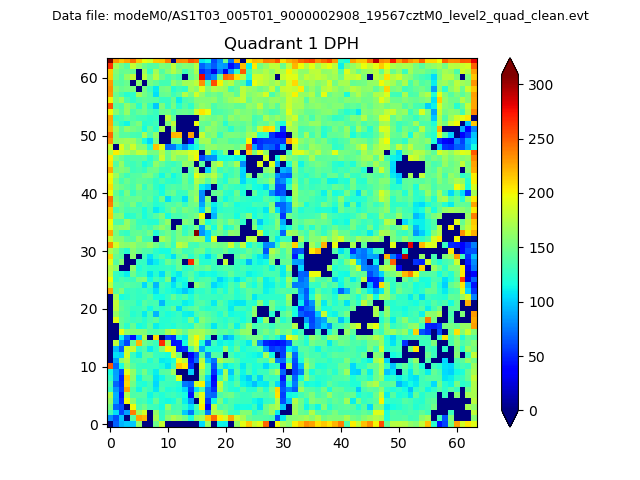 |
Quadrant B |
|---|---|---|---|
| Quadrant D | 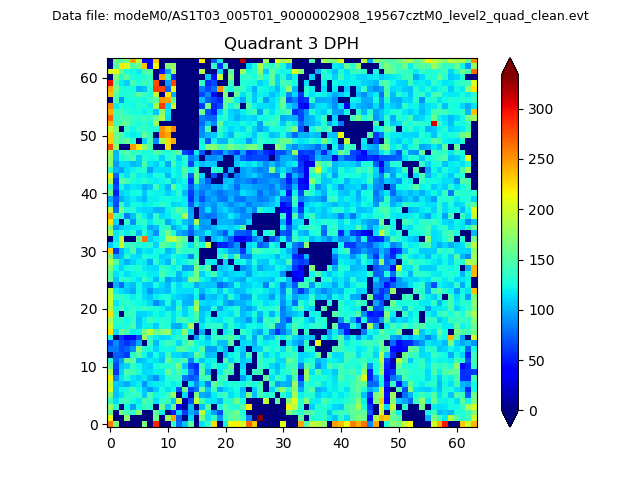 |
 |
Quadrant C |
| Plot type | Count rate plots | Images |
|---|---|---|
| Comparison with Poisson distribution Blue bars denote a histogram of data divided into 1 sec bins. Red curve is a Poisson curve with rate = median count rate of data. |
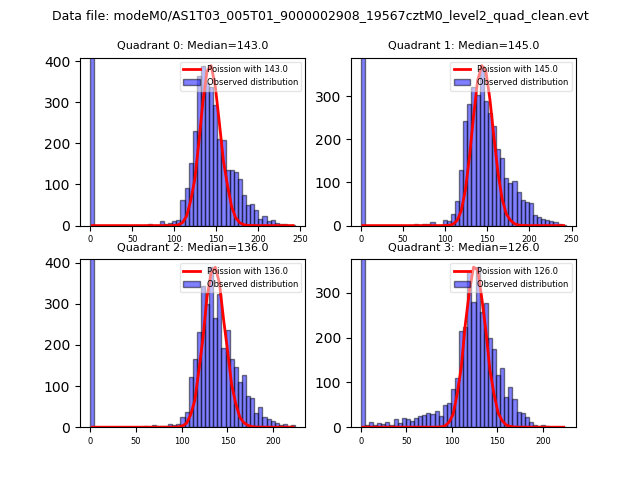 |
 |
| Quadrant-wise count rates Data is divided into 100 sec bins |
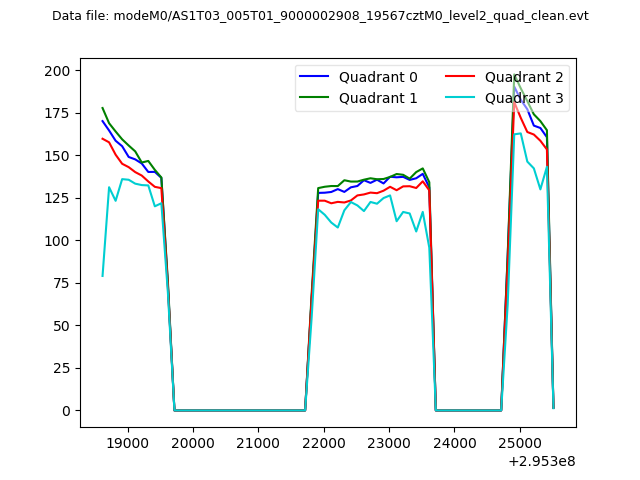 |
|
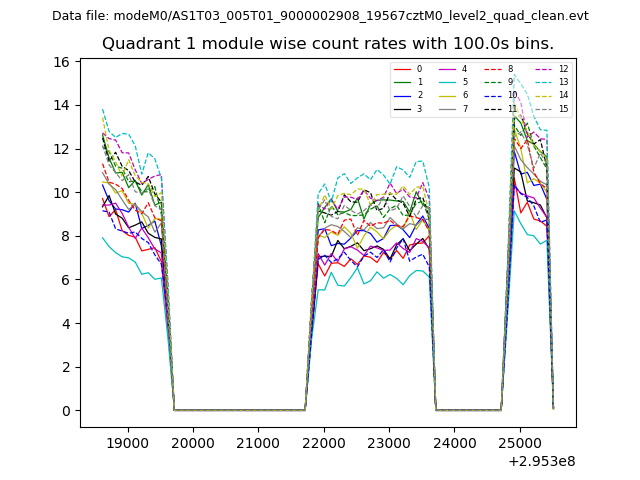
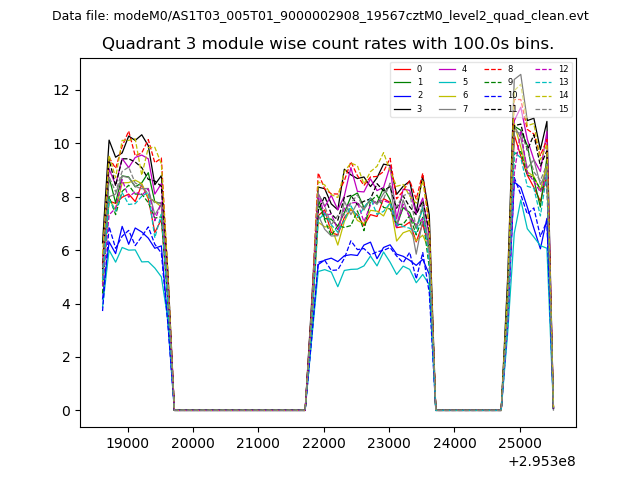
| Module-wise count rates for Quadrant A Data is divided into 100 sec bins |
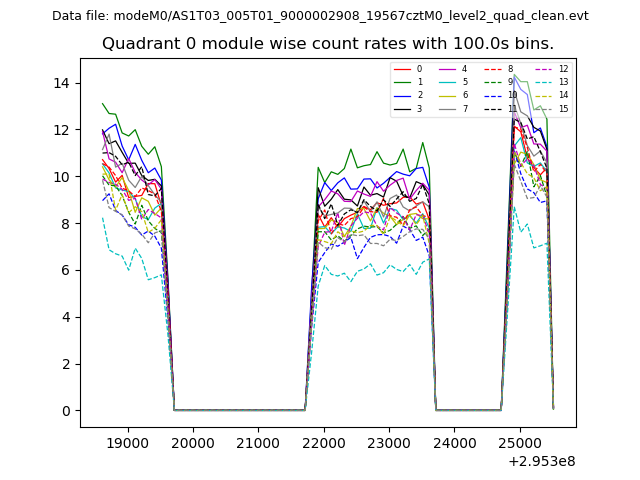 |
 |
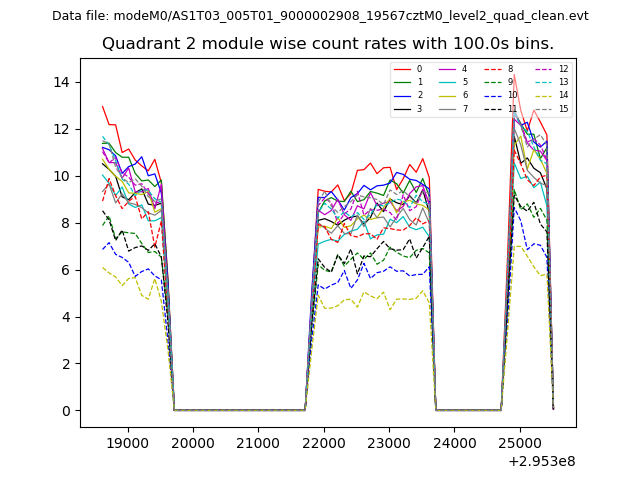
| Module-wise count rates for Quadrant B Data is divided into 100 sec bins |
 |
 |
| Module-wise count rates for Quadrant C Data is divided into 100 sec bins |
 |
 |
| Module-wise count rates for Quadrant D Data is divided into 100 sec bins |
 |
 |
| Parameter | Plot |
|---|---|
| CZT HV Monitor | 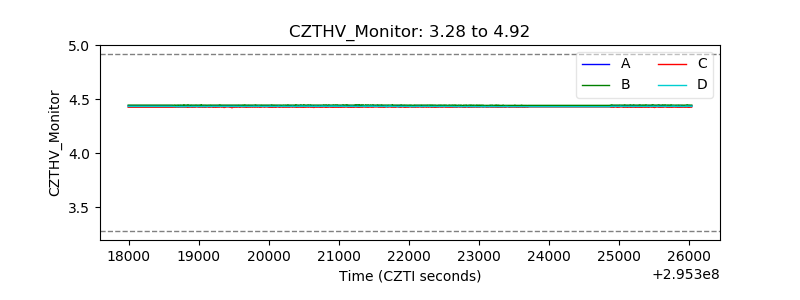 |
| D_VDD | 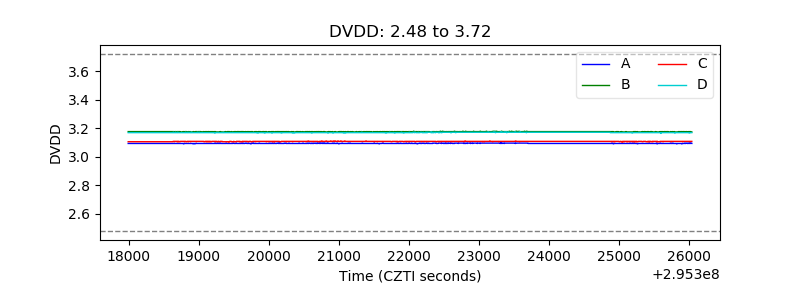 |
| Temperature 1 | 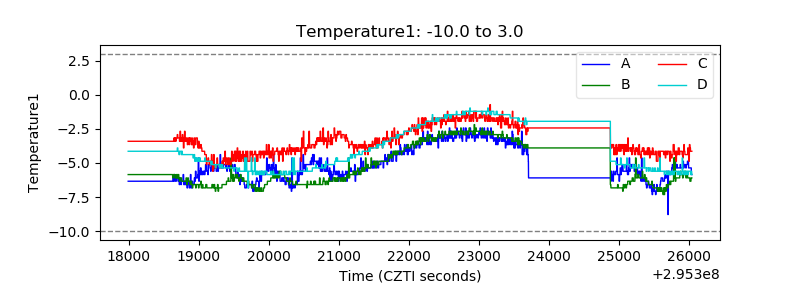 |
| Veto HV Monitor | 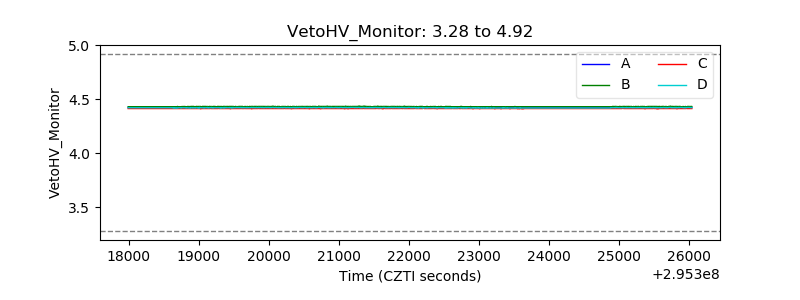 |
| Veto LLD | 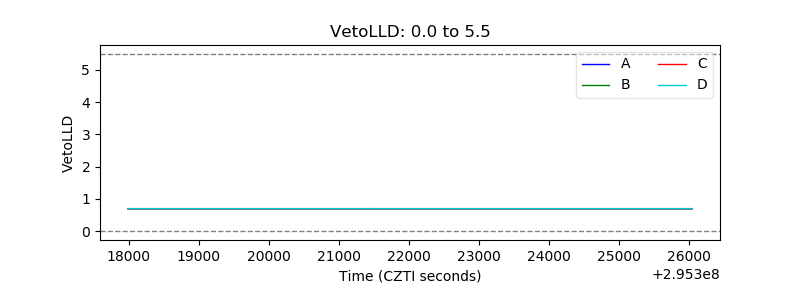 |
| Alpha Counter | 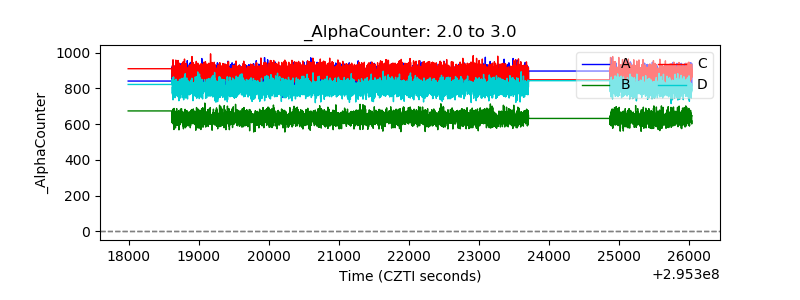 |
| _CPM_Rate | 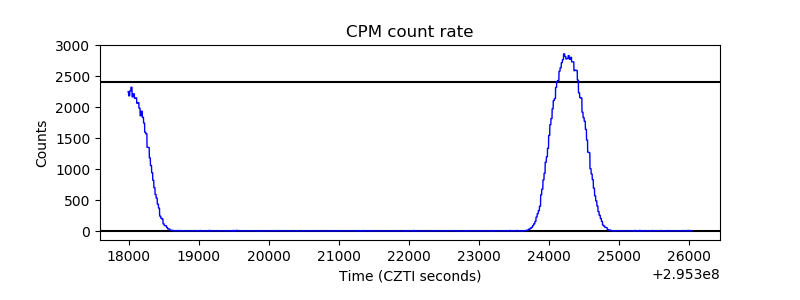 |
| CZT Counter | 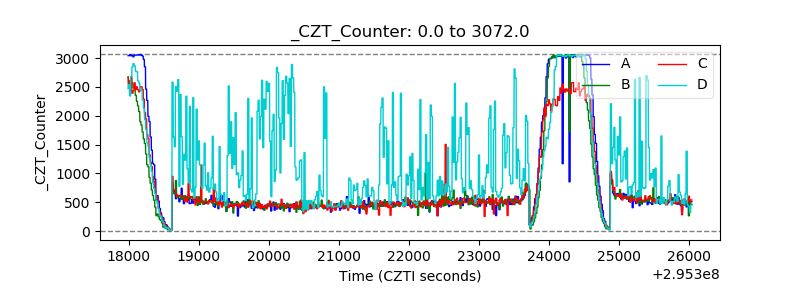 |
| +2.5 Volts monitor | 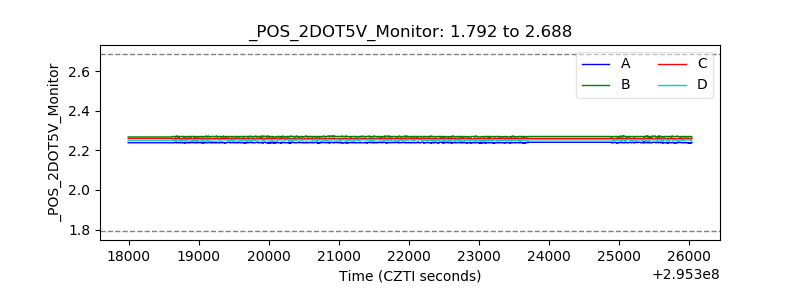 |
| +5 Volts monitor | 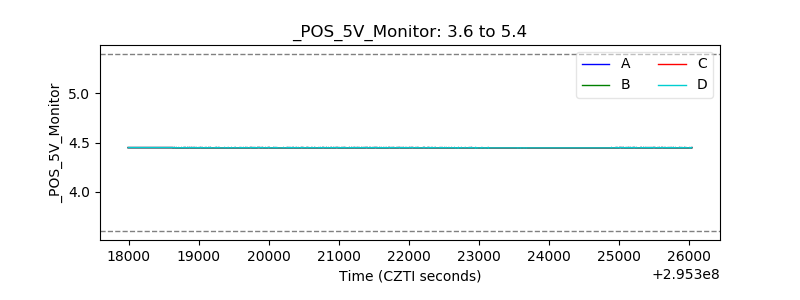 |
| _ROLL_ROT | 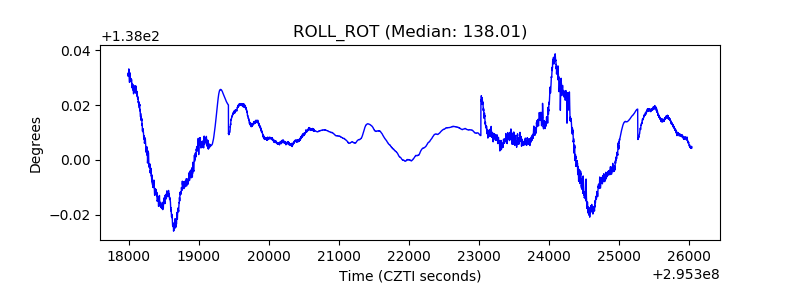 |
| _Roll_DEC | 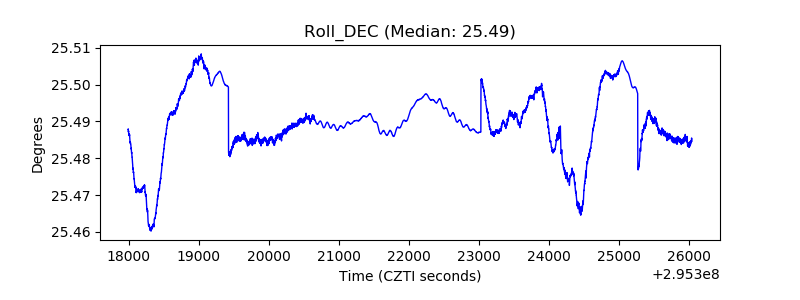 |
| _Roll_RA | 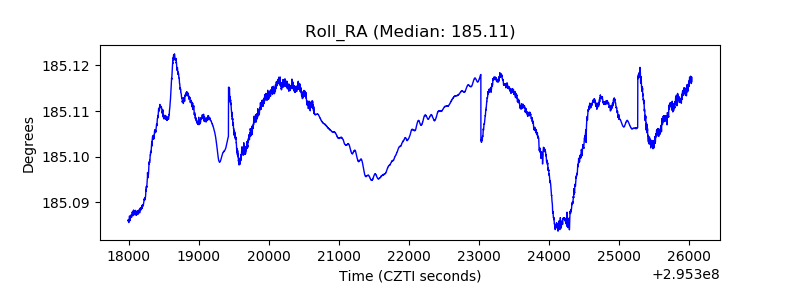 |
| Veto Counter | 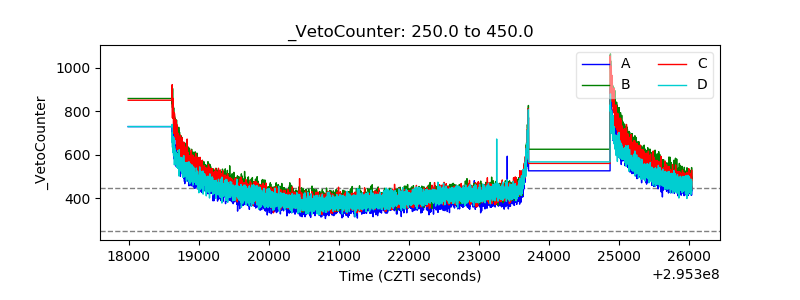 |