| Param | Original file | Final file |
|---|---|---|
| Filename | modeM0/AS1T03_005T01_9000002908_19568cztM0_level2.evt | modeM0/AS1T03_005T01_9000002908_19568cztM0_level2_quad_clean.evt |
| Size (bytes) | 493,171,200 | 72,679,680 |
| Size | 470.3 MB | 69.3 MB |
| Events in quadrant A | 3,180,611 | 460,366 |
| Events in quadrant B | 3,254,037 | 469,191 |
| Events in quadrant C | 3,240,195 | 435,645 |
| Events in quadrant D | 4,842,532 | 404,701 |
| Mode M9 | |||
|---|---|---|---|
| Quadrant | BADHDUFLAG | Total packets | Discarded packets |
| A | 0 | 20 | 0 |
| B | 0 | 21 | 0 |
| C | 0 | 21 | 0 |
| D | 0 | 21 | 0 |
| Mode SS | |||
|---|---|---|---|
| Quadrant | BADHDUFLAG | Total packets | Discarded packets |
| A | 0 | 126 | 0 |
| B | 0 | 126 | 0 |
| C | 0 | 126 | 0 |
| D | 0 | 126 | 0 |
| Mode M0 | |||
|---|---|---|---|
| Quadrant | BADHDUFLAG | Total packets | Discarded packets |
| A | 0 | 13105 | 2 |
| B | 0 | 13344 | 2 |
| C | 0 | 13212 | 2 |
| D | 0 | 18610 | 2 |
| Quadrant | Total seconds | Saturated seconds | Saturation percentage |
|---|---|---|---|
| A | 6166 | 34 | 0.551411% |
| B | 6166 | 51 | 0.827116% |
| C | 6166 | 46 | 0.746027% |
| D | 6166 | 286 | 4.638339% |
Noise dominated data is calculated using 1-second bins in cleaned event files. If a bin has >2000 counts, and if more than 50% of those come from <1% of pixels, then it is considered to be noise-dominated and hence unusable.
| Quadrant | # 1 sec bins | Bins with >0 counts | Bins with >2000 counts | High rate bins dominated by noise | Noise dominated (total time) | Noise dominated (detector-on time) | Marked lightcurve |
|---|---|---|---|---|---|---|---|
| A | 7441 | 6167 | 0 | 0 | 0.00% | 0.00% | 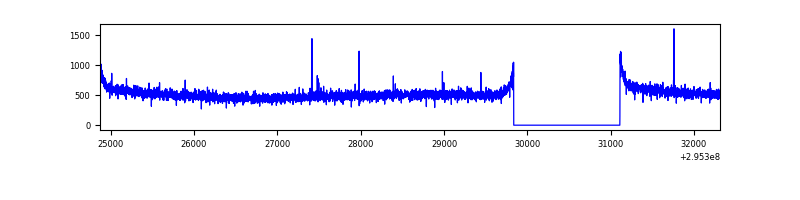 |
| B | 7441 | 6167 | 1 | 1 | 0.01% | 0.02% | 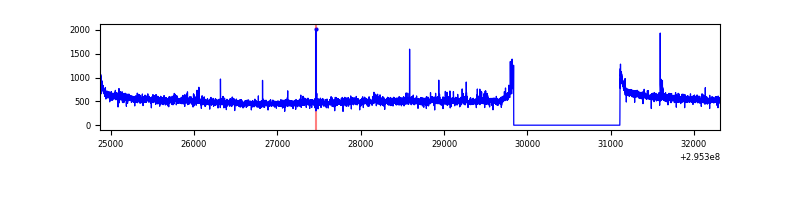 |
| C | 7441 | 6167 | 0 | 0 | 0.00% | 0.00% | 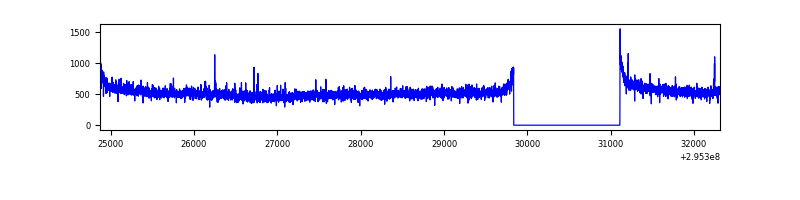 |
| D | 7441 | 6167 | 233 | 233 | 3.13% | 3.78% | 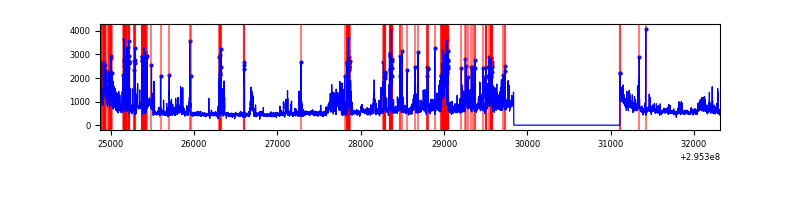 |
Top three noisy pixels from each quadrant. If the there are fewer than three noisy pixels in the level2.evt file, extra rows are filled as -1
| Pixel properties | Quadrant properties | ||||||
|---|---|---|---|---|---|---|---|
| Quadrant | DetID | PixID | Counts | Sigma | Mean | Median | Sigma |
| A | 9 | 143 | 9331 | 51.73 | 822 | 809 | 164.7 |
| A | 13 | 254 | 9113 | 50.41 | 822 | 809 | 164.7 |
| A | 0 | 226 | 7101 | 38.19 | 822 | 809 | 164.7 |
| B | 0 | 198 | 23721 | 149.92 | 820 | 801 | 152.9 |
| B | 12 | 111 | 18321 | 114.6 | 820 | 801 | 152.9 |
| B | 11 | 111 | 16182 | 100.61 | 820 | 801 | 152.9 |
| C | 14 | 238 | 124135 | 690.05 | 774 | 781 | 178.8 |
| C | 3 | 233 | 62779 | 346.82 | 774 | 781 | 178.8 |
| C | 9 | 221 | 15153 | 80.4 | 774 | 781 | 178.8 |
| D | 12 | 218 | 833707 | 4516.53 | 767 | 748 | 184.4 |
| D | 2 | 16 | 451777 | 2445.6 | 767 | 748 | 184.4 |
| D | 1 | 52 | 435198 | 2355.71 | 767 | 748 | 184.4 |
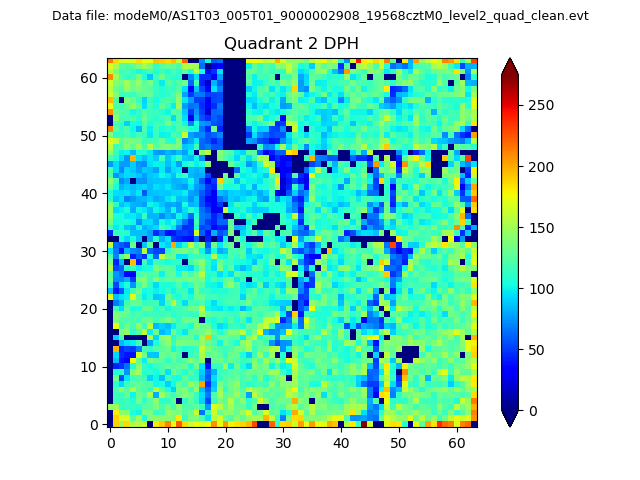
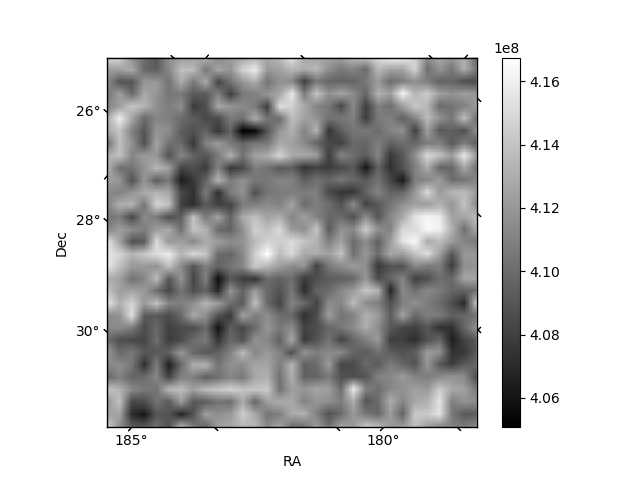
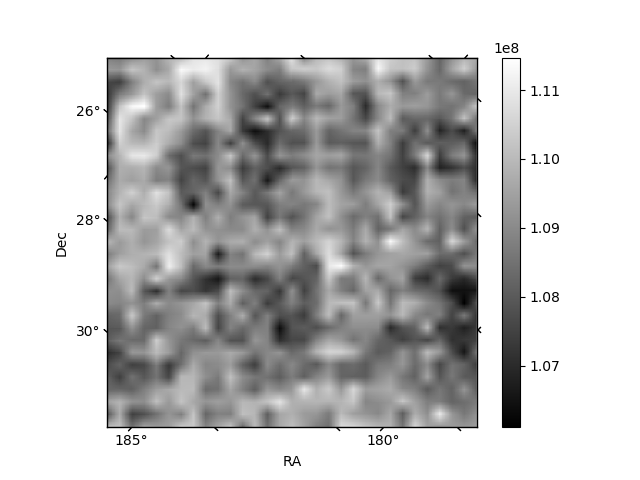
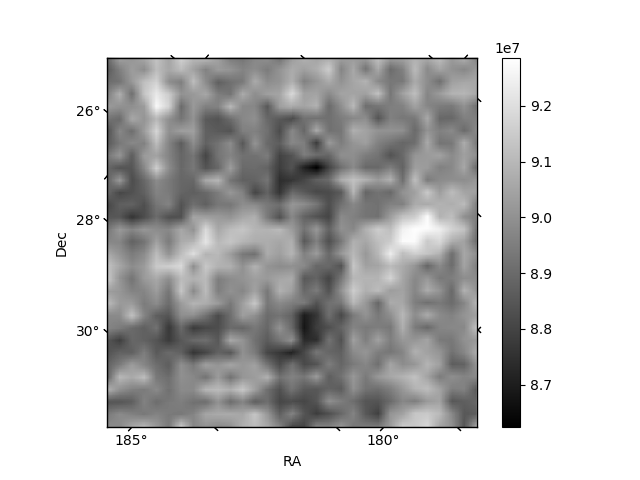
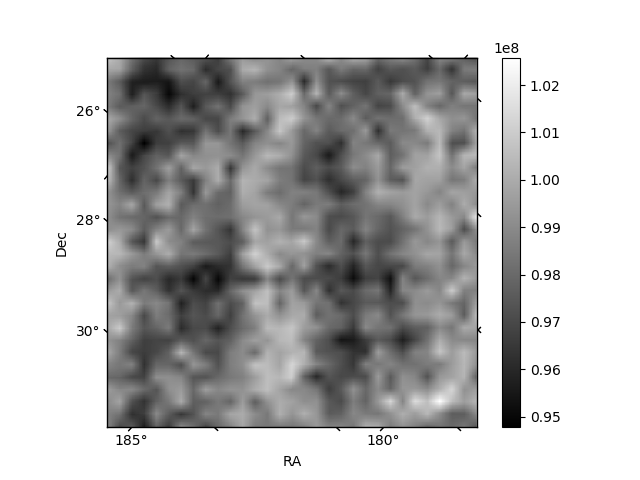
Histogram calculated using DETX and DETY for each event in the final _common_clean file
| Quadrant A | 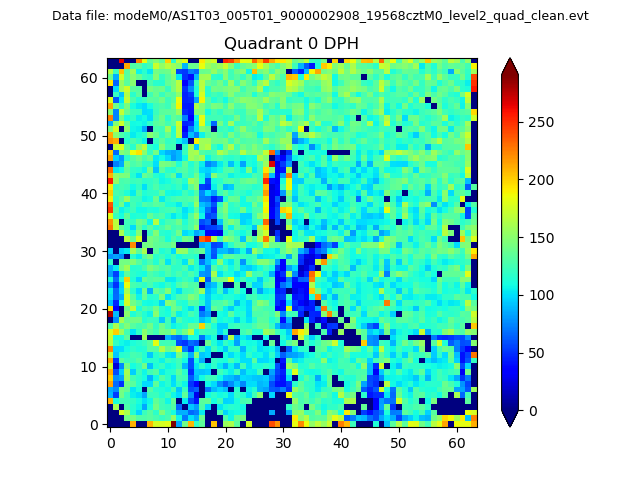 |
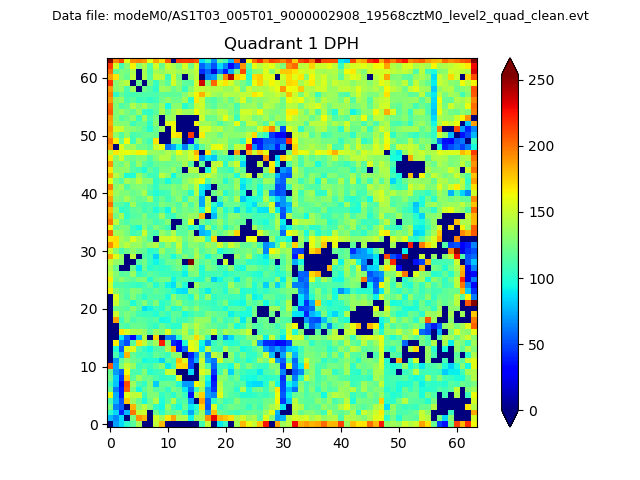 |
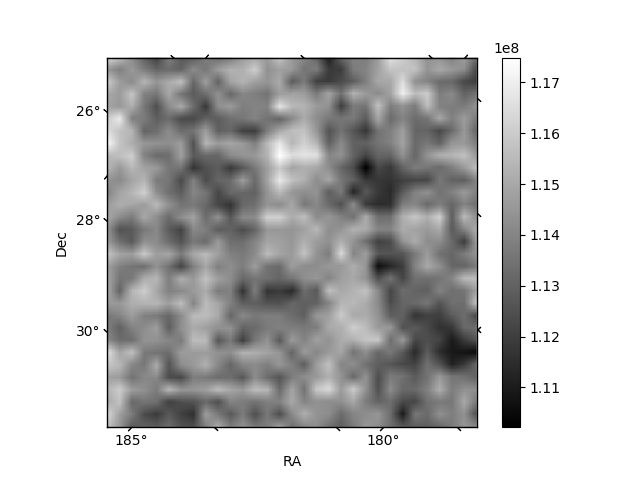
Quadrant B |
|---|---|---|---|
| Quadrant D | 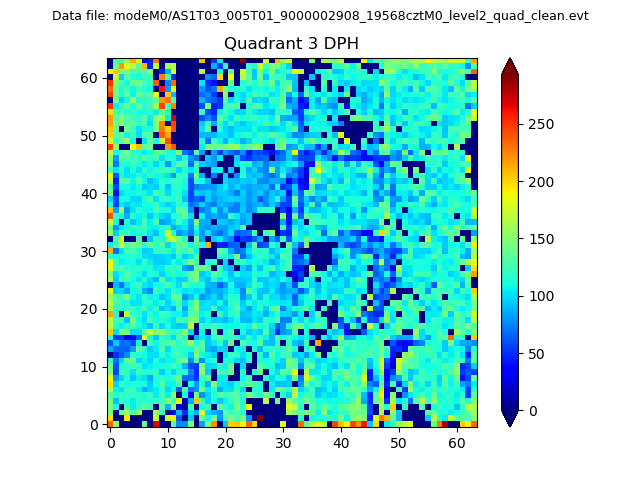 |
 |
Quadrant C |
| Plot type | Count rate plots | Images |
|---|---|---|
| Comparison with Poisson distribution Blue bars denote a histogram of data divided into 1 sec bins. Red curve is a Poisson curve with rate = median count rate of data. |
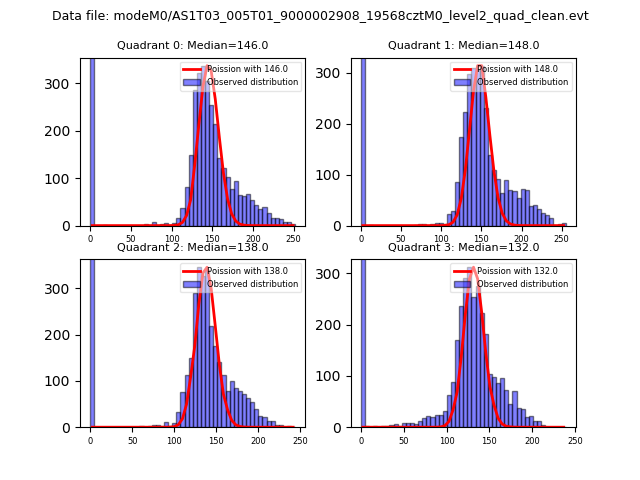 |
 |
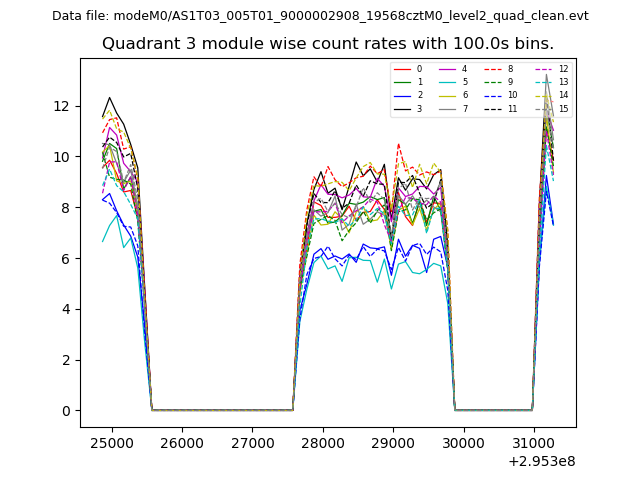
| Quadrant-wise count rates Data is divided into 100 sec bins |
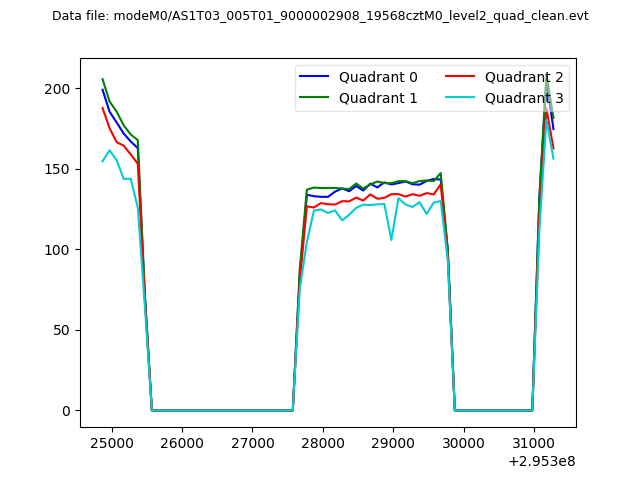 |
|
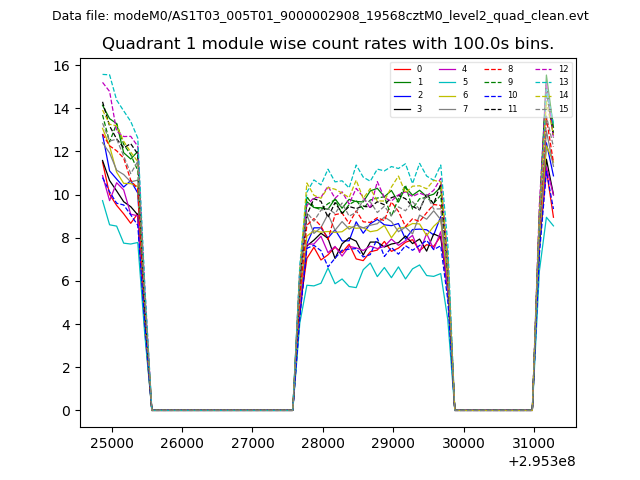
| Module-wise count rates for Quadrant A Data is divided into 100 sec bins |
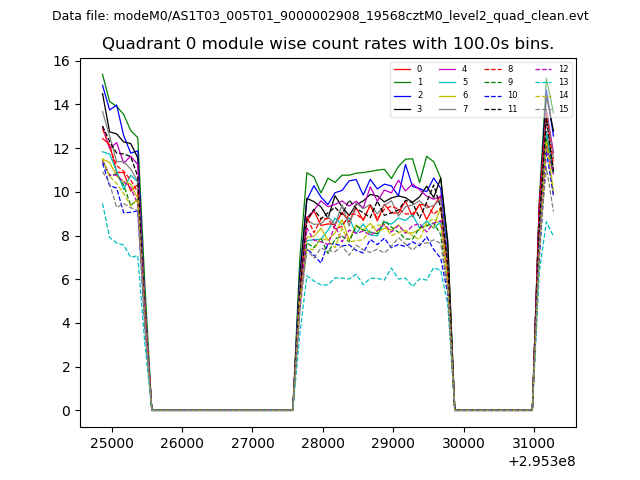 |
 |
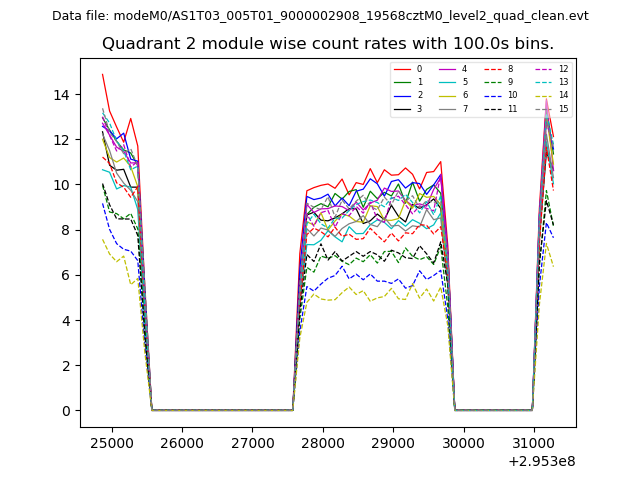
| Module-wise count rates for Quadrant B Data is divided into 100 sec bins |
 |
 |
| Module-wise count rates for Quadrant C Data is divided into 100 sec bins |
 |
 |
| Module-wise count rates for Quadrant D Data is divided into 100 sec bins |
 |
 |
| Parameter | Plot |
|---|---|
| CZT HV Monitor | 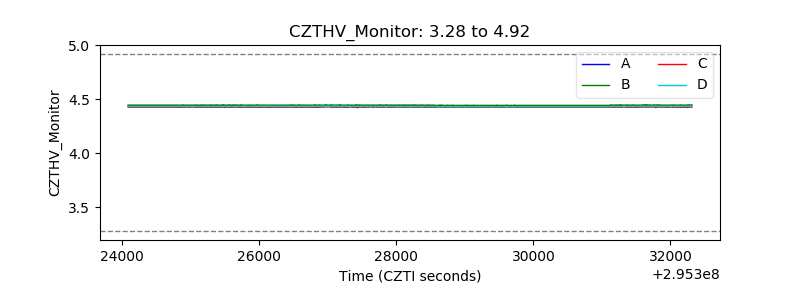 |
| D_VDD | 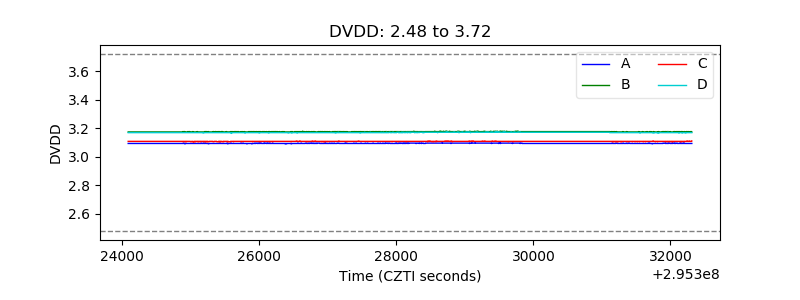 |
| Temperature 1 | 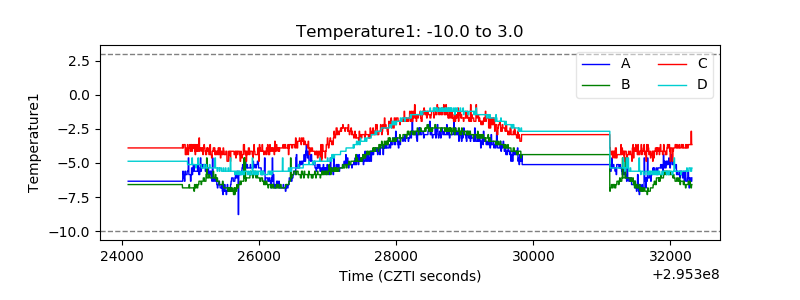 |
| Veto HV Monitor | 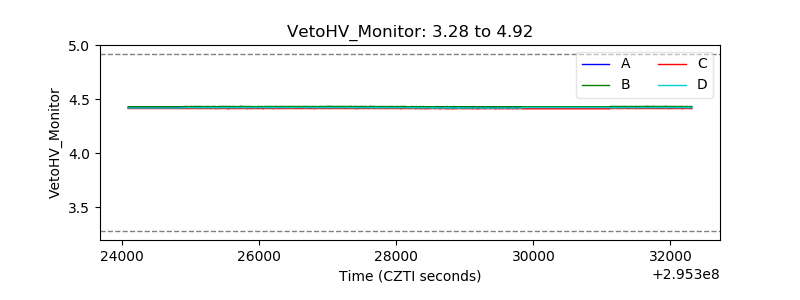 |
| Veto LLD | 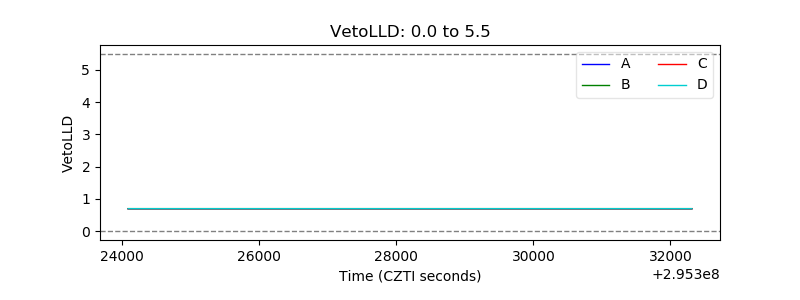 |
| Alpha Counter | 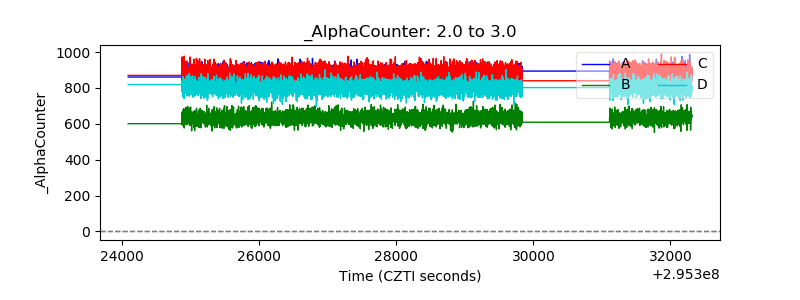 |
| _CPM_Rate | 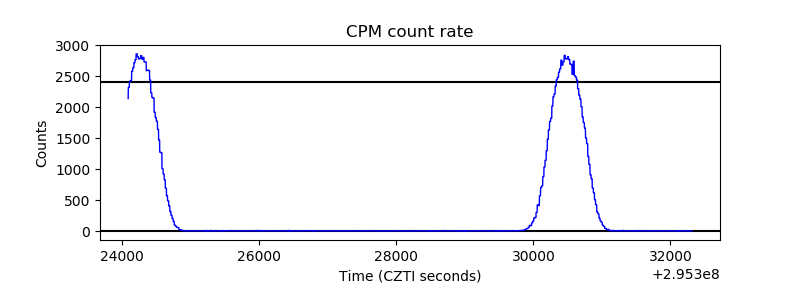 |
| CZT Counter | 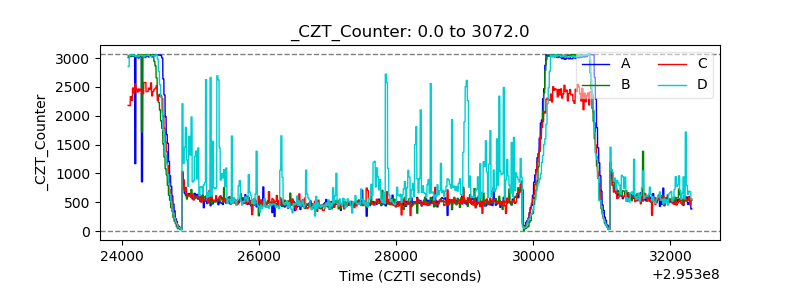 |
| +2.5 Volts monitor |  |
| +5 Volts monitor |  |
| _ROLL_ROT | 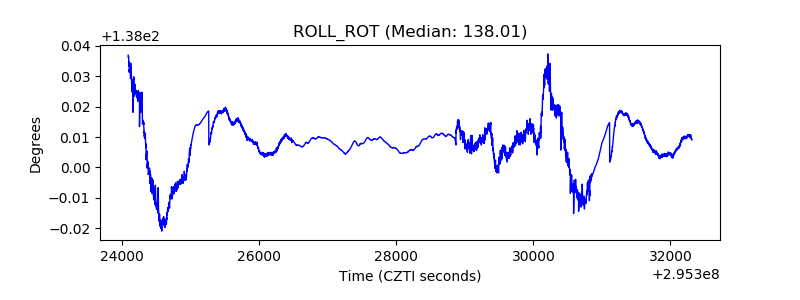 |
| _Roll_DEC | 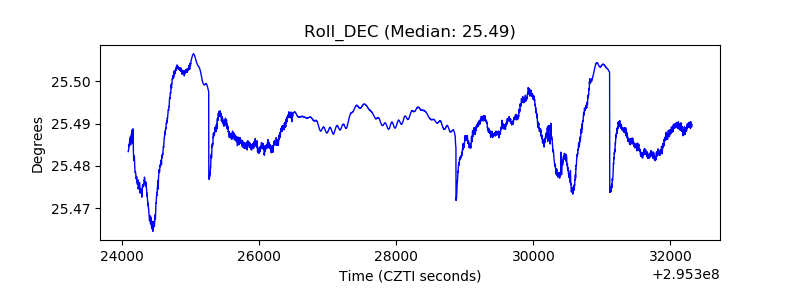 |
| _Roll_RA | 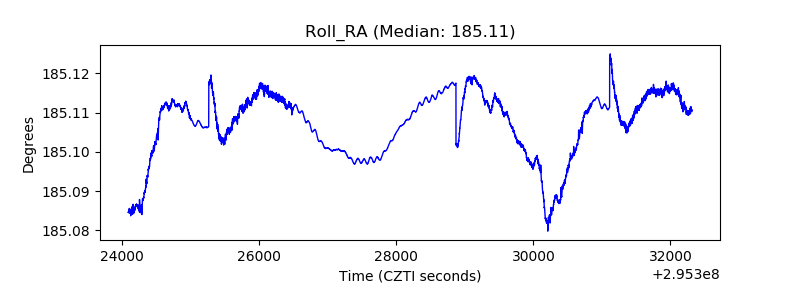 |
| Veto Counter | 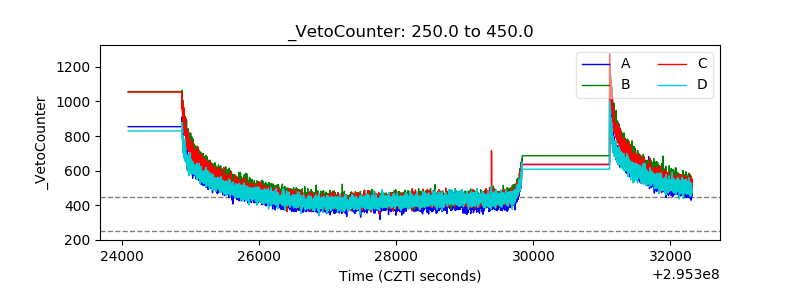 |