| Param | Original file | Final file |
|---|---|---|
| Filename | modeM0/AS1T03_005T01_9000002908_19569cztM0_level2.evt | modeM0/AS1T03_005T01_9000002908_19569cztM0_level2_quad_clean.evt |
| Size (bytes) | 501,122,880 | 67,331,520 |
| Size | 477.9 MB | 64.2 MB |
| Events in quadrant A | 3,472,469 | 407,822 |
| Events in quadrant B | 3,588,007 | 416,917 |
| Events in quadrant C | 3,523,112 | 384,617 |
| Events in quadrant D | 4,150,341 | 374,121 |
| Mode M9 | |||
|---|---|---|---|
| Quadrant | BADHDUFLAG | Total packets | Discarded packets |
| A | 0 | 21 | 0 |
| B | 0 | 22 | 0 |
| C | 0 | 22 | 0 |
| D | 0 | 22 | 0 |
| Mode SS | |||
|---|---|---|---|
| Quadrant | BADHDUFLAG | Total packets | Discarded packets |
| A | 0 | 132 | 0 |
| B | 0 | 132 | 0 |
| C | 0 | 132 | 0 |
| D | 0 | 132 | 0 |
| Mode M0 | |||
|---|---|---|---|
| Quadrant | BADHDUFLAG | Total packets | Discarded packets |
| A | 0 | 14071 | 2 |
| B | 0 | 14465 | 2 |
| C | 0 | 14198 | 3 |
| D | 0 | 16390 | 2 |
| Quadrant | Total seconds | Saturated seconds | Saturation percentage |
|---|---|---|---|
| A | 6527 | 88 | 1.348246% |
| B | 6527 | 115 | 1.761912% |
| C | 6526 | 96 | 1.471039% |
| D | 6526 | 124 | 1.900092% |
Noise dominated data is calculated using 1-second bins in cleaned event files. If a bin has >2000 counts, and if more than 50% of those come from <1% of pixels, then it is considered to be noise-dominated and hence unusable.
| Quadrant | # 1 sec bins | Bins with >0 counts | Bins with >2000 counts | High rate bins dominated by noise | Noise dominated (total time) | Noise dominated (detector-on time) | Marked lightcurve |
|---|---|---|---|---|---|---|---|
| A | 7827 | 6528 | 0 | 0 | 0.00% | 0.00% |  |
| B | 7827 | 6527 | 5 | 5 | 0.06% | 0.08% |  |
| C | 7826 | 6527 | 2 | 2 | 0.03% | 0.03% |  |
| D | 7826 | 6527 | 68 | 68 | 0.87% | 1.04% | 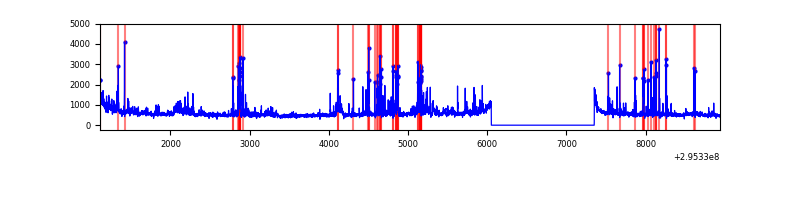 |
Top three noisy pixels from each quadrant. If the there are fewer than three noisy pixels in the level2.evt file, extra rows are filled as -1
| Pixel properties | Quadrant properties | ||||||
|---|---|---|---|---|---|---|---|
| Quadrant | DetID | PixID | Counts | Sigma | Mean | Median | Sigma |
| A | 13 | 254 | 8885 | 44.17 | 900 | 885 | 181.1 |
| A | 0 | 226 | 7746 | 37.88 | 900 | 885 | 181.1 |
| A | 3 | 137 | 6799 | 32.66 | 900 | 885 | 181.1 |
| B | 7 | 220 | 34204 | 200.11 | 897 | 879 | 166.5 |
| B | 12 | 111 | 19716 | 113.11 | 897 | 879 | 166.5 |
| B | 11 | 111 | 17341 | 98.85 | 897 | 879 | 166.5 |
| C | 14 | 238 | 134317 | 689.6 | 842 | 851 | 193.5 |
| C | 3 | 233 | 50110 | 254.52 | 842 | 851 | 193.5 |
| C | 7 | 247 | 34018 | 171.37 | 842 | 851 | 193.5 |
| D | 12 | 218 | 412832 | 2005.73 | 850 | 824 | 205.4 |
| D | 2 | 16 | 309296 | 1501.7 | 850 | 824 | 205.4 |
| D | 7 | 238 | 121451 | 587.23 | 850 | 824 | 205.4 |
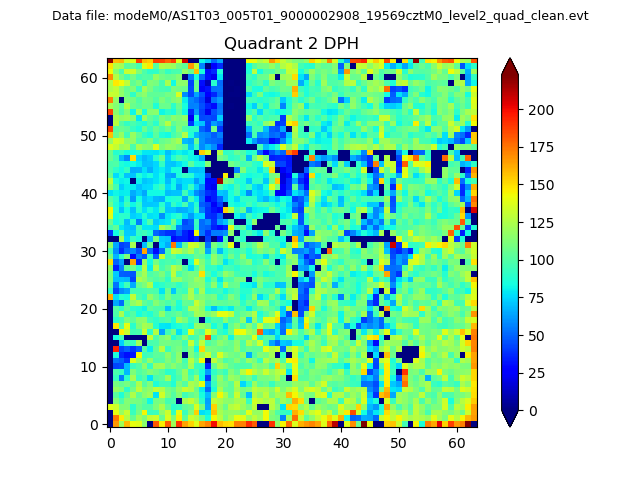
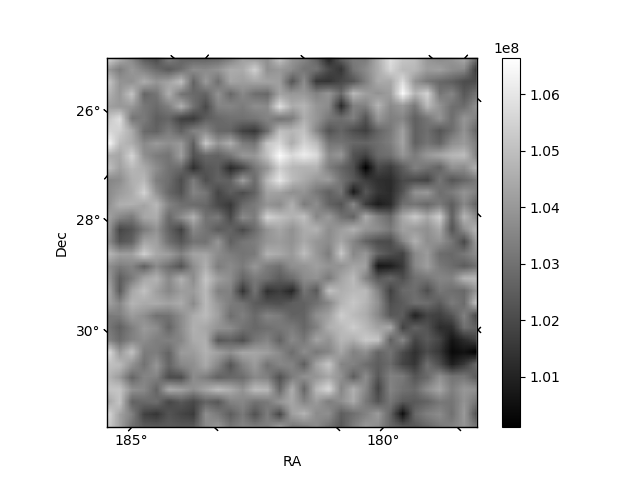
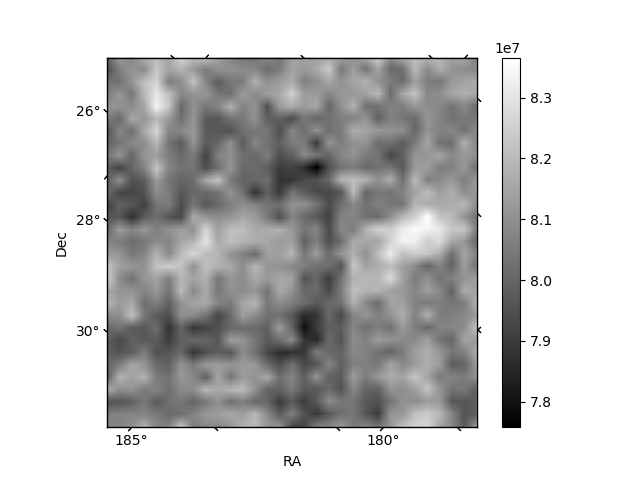
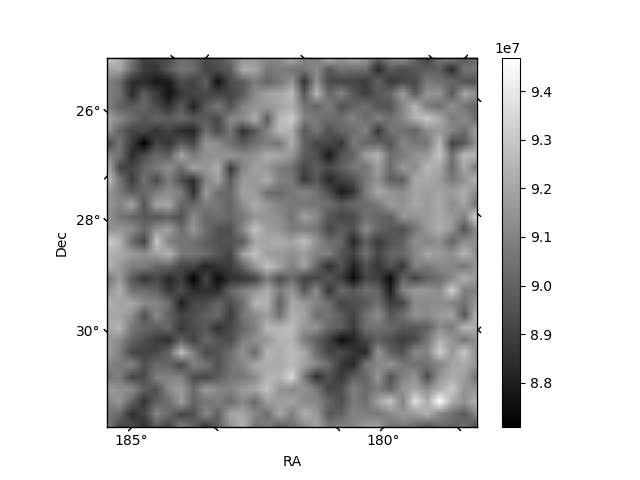
Histogram calculated using DETX and DETY for each event in the final _common_clean file
| Quadrant A | 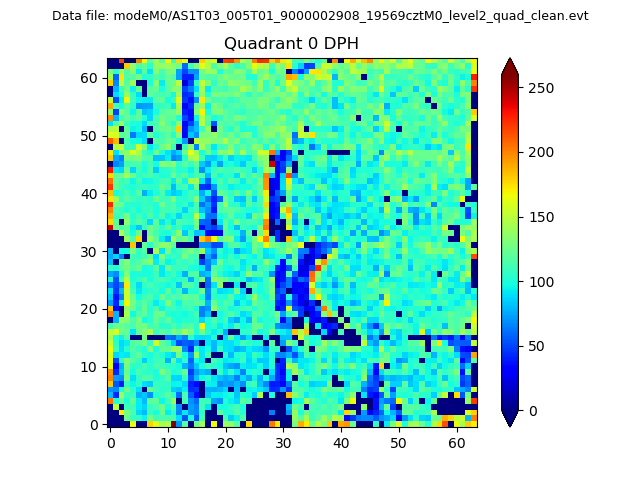 |
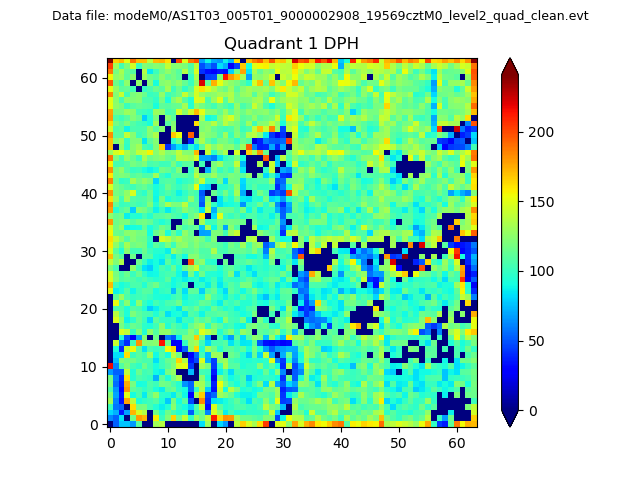 |
Quadrant B |
|---|---|---|---|
| Quadrant D | 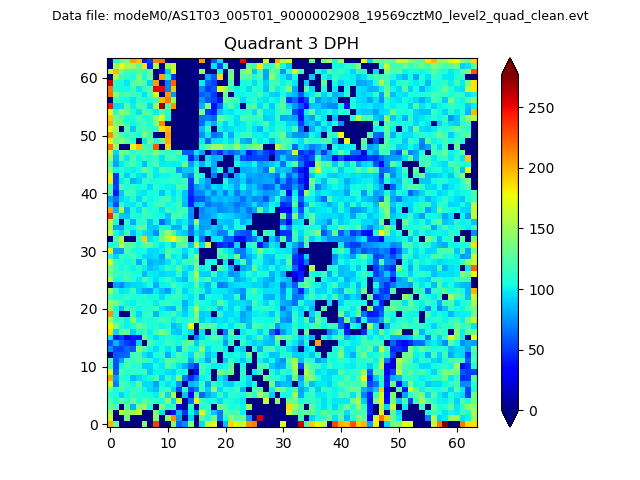 |
 |
Quadrant C |
| Plot type | Count rate plots | Images |
|---|---|---|
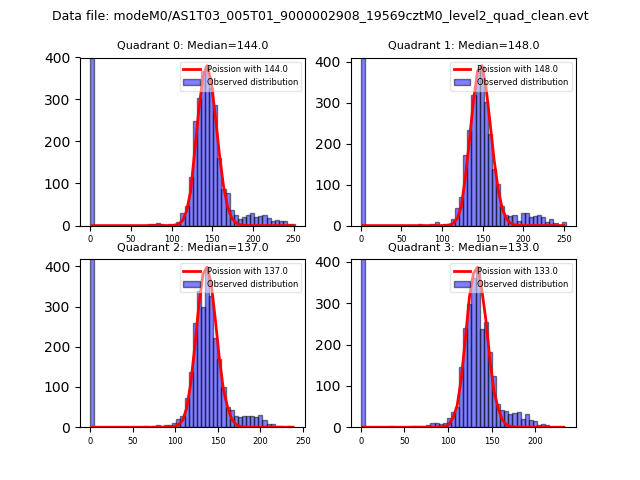
| Comparison with Poisson distribution Blue bars denote a histogram of data divided into 1 sec bins. Red curve is a Poisson curve with rate = median count rate of data. |
 |
 |
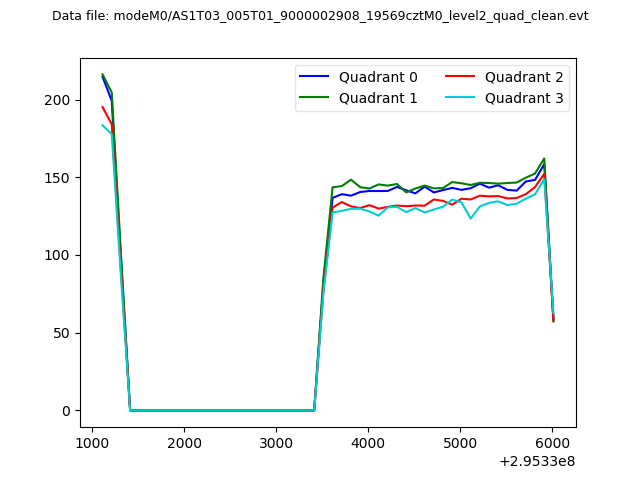
| Quadrant-wise count rates Data is divided into 100 sec bins |
 |
|
| Module-wise count rates for Quadrant A Data is divided into 100 sec bins |
 |
 |
| Module-wise count rates for Quadrant B Data is divided into 100 sec bins |
 |
 |
| Module-wise count rates for Quadrant C Data is divided into 100 sec bins |
 |
 |
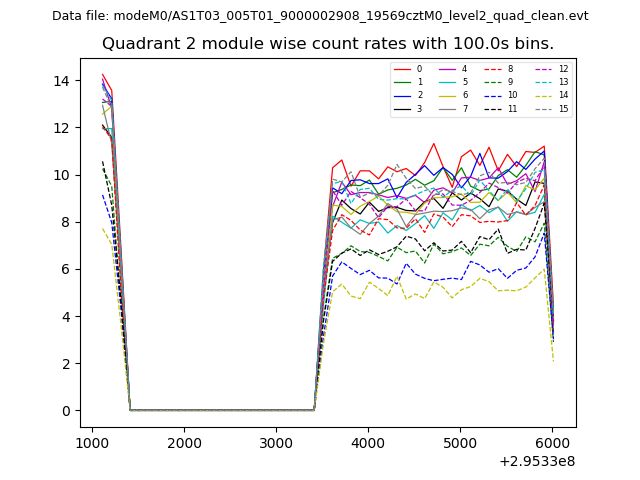
| Module-wise count rates for Quadrant D Data is divided into 100 sec bins |
 |
 |
| Parameter | Plot |
|---|---|
| CZT HV Monitor | 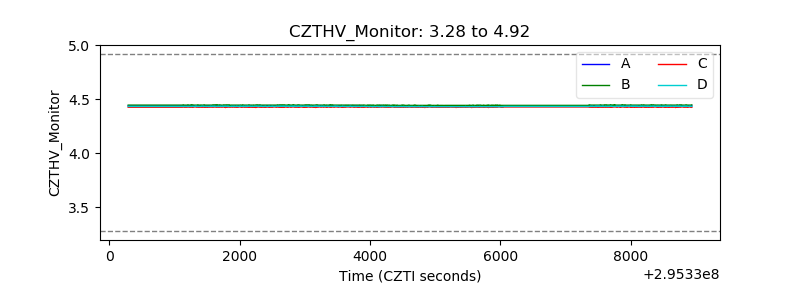 |
| D_VDD | 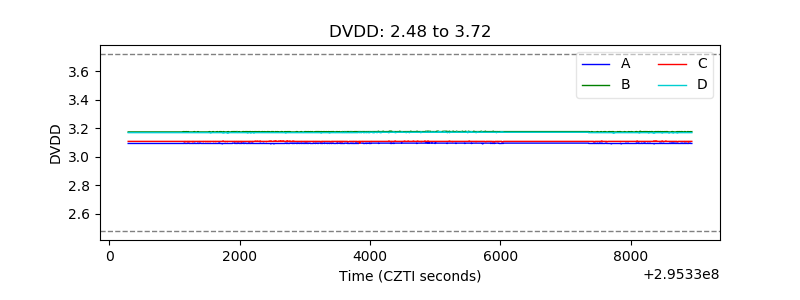 |
| Temperature 1 | 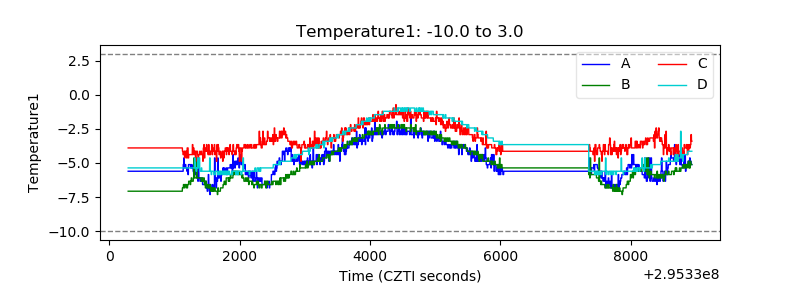 |
| Veto HV Monitor | 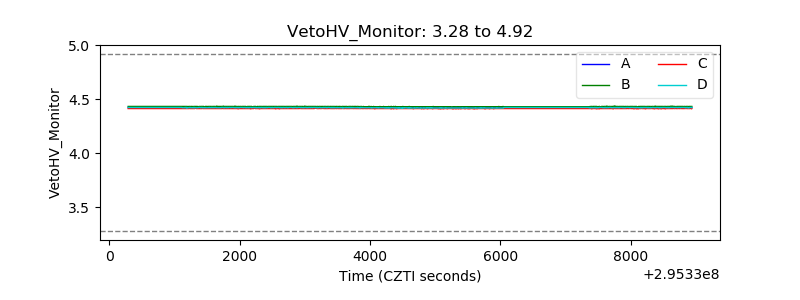 |
| Veto LLD | 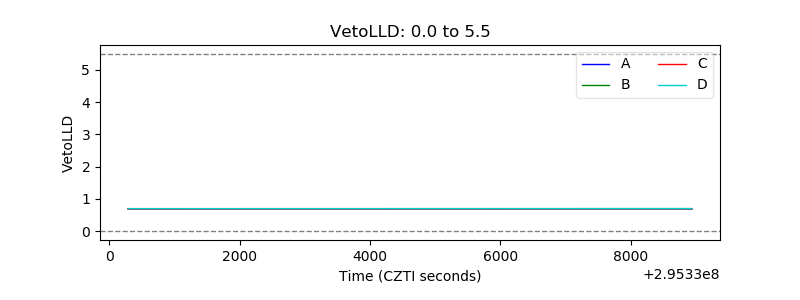 |
| Alpha Counter | 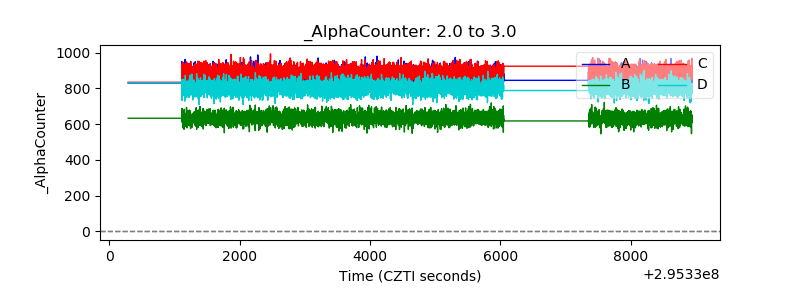 |
| _CPM_Rate | 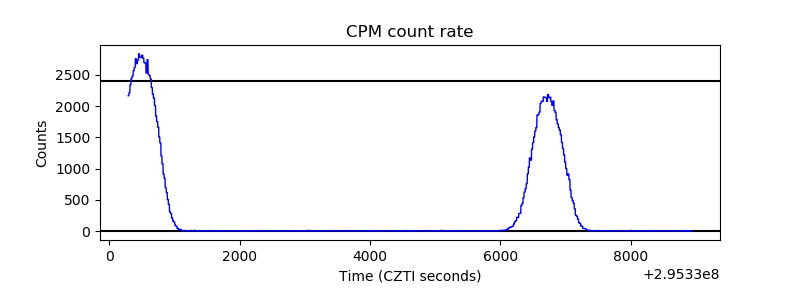 |
| CZT Counter | 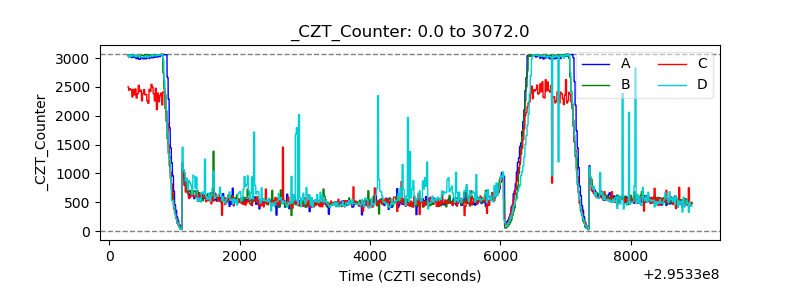 |
| +2.5 Volts monitor |  |
| +5 Volts monitor |  |
| _ROLL_ROT |  |
| _Roll_DEC |  |
| _Roll_RA | 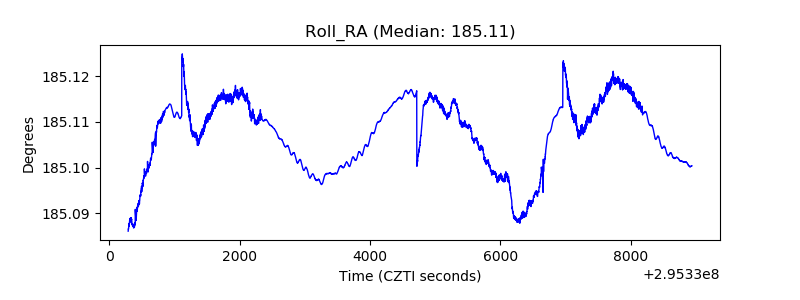 |
| Veto Counter |  |