| Param | Original file | Final file |
|---|---|---|
| Filename | modeM0/AS1T03_005T01_9000002908_19571cztM0_level2.evt | modeM0/AS1T03_005T01_9000002908_19571cztM0_level2_quad_clean.evt |
| Size (bytes) | 553,429,440 | 76,314,240 |
| Size | 527.8 MB | 72.8 MB |
| Events in quadrant A | 3,376,166 | 507,475 |
| Events in quadrant B | 3,419,543 | 512,714 |
| Events in quadrant C | 3,348,510 | 480,256 |
| Events in quadrant D | 6,173,541 | 354,949 |
| Mode M9 | |||
|---|---|---|---|
| Quadrant | BADHDUFLAG | Total packets | Discarded packets |
| A | 0 | 21 | 0 |
| B | 0 | 22 | 0 |
| C | 0 | 22 | 0 |
| D | 0 | 22 | 0 |
| Mode SS | |||
|---|---|---|---|
| Quadrant | BADHDUFLAG | Total packets | Discarded packets |
| A | 0 | 132 | 0 |
| B | 0 | 132 | 0 |
| C | 0 | 132 | 0 |
| D | 0 | 132 | 0 |
| Mode M0 | |||
|---|---|---|---|
| Quadrant | BADHDUFLAG | Total packets | Discarded packets |
| A | 0 | 13822 | 2 |
| B | 0 | 13954 | 2 |
| C | 0 | 13735 | 2 |
| D | 0 | 22417 | 2 |
| Quadrant | Total seconds | Saturated seconds | Saturation percentage |
|---|---|---|---|
| A | 6524 | 122 | 1.870018% |
| B | 6524 | 144 | 2.207235% |
| C | 6524 | 141 | 2.161251% |
| D | 6523 | 1258 | 19.285605% |
Noise dominated data is calculated using 1-second bins in cleaned event files. If a bin has >2000 counts, and if more than 50% of those come from <1% of pixels, then it is considered to be noise-dominated and hence unusable.
| Quadrant | # 1 sec bins | Bins with >0 counts | Bins with >2000 counts | High rate bins dominated by noise | Noise dominated (total time) | Noise dominated (detector-on time) | Marked lightcurve |
|---|---|---|---|---|---|---|---|
| A | 7619 | 6524 | 0 | 0 | 0.00% | 0.00% | 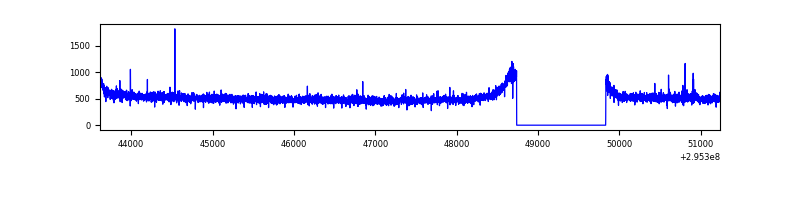 |
| B | 7619 | 6524 | 4 | 4 | 0.05% | 0.06% | 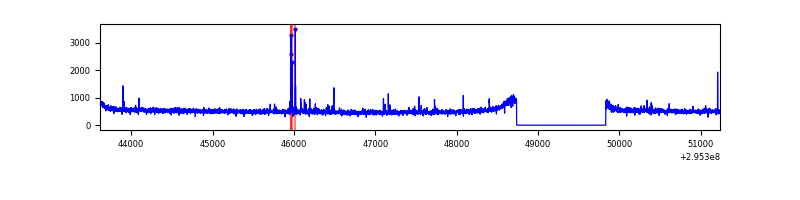 |
| C | 7619 | 6524 | 1 | 1 | 0.01% | 0.02% | 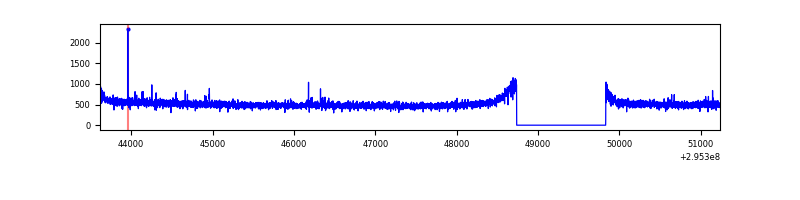 |
| D | 7618 | 6523 | 1124 | 1124 | 14.75% | 17.23% | 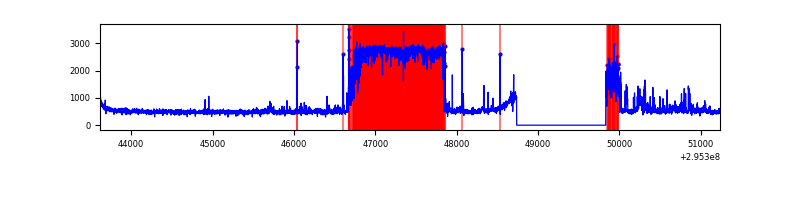 |
Top three noisy pixels from each quadrant. If the there are fewer than three noisy pixels in the level2.evt file, extra rows are filled as -1
| Pixel properties | Quadrant properties | ||||||
|---|---|---|---|---|---|---|---|
| Quadrant | DetID | PixID | Counts | Sigma | Mean | Median | Sigma |
| A | 11 | 29 | 21648 | 119.29 | 868 | 852 | 174.3 |
| A | 13 | 254 | 8508 | 43.92 | 868 | 852 | 174.3 |
| A | 0 | 226 | 7583 | 38.61 | 868 | 852 | 174.3 |
| B | 3 | 64 | 31545 | 187.84 | 858 | 839 | 163.5 |
| B | 12 | 111 | 19520 | 114.28 | 858 | 839 | 163.5 |
| B | 11 | 111 | 17346 | 100.98 | 858 | 839 | 163.5 |
| C | 14 | 238 | 127946 | 672.18 | 813 | 820 | 189.1 |
| C | 3 | 233 | 24112 | 123.16 | 813 | 820 | 189.1 |
| C | 9 | 221 | 21790 | 110.88 | 813 | 820 | 189.1 |
| D | 13 | 104 | 2779252 | 15364.88 | 732 | 709 | 180.8 |
| D | 7 | 238 | 341059 | 1882.08 | 732 | 709 | 180.8 |
| D | 12 | 218 | 151124 | 831.77 | 732 | 709 | 180.8 |
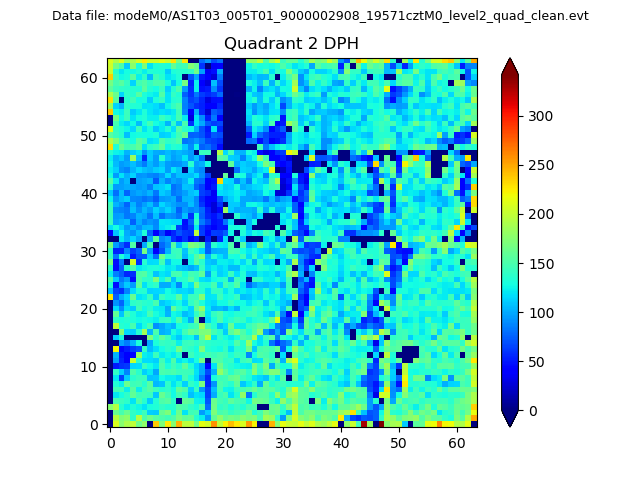
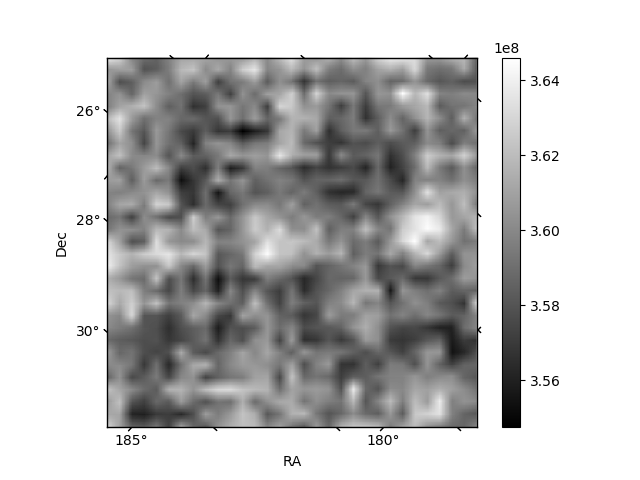
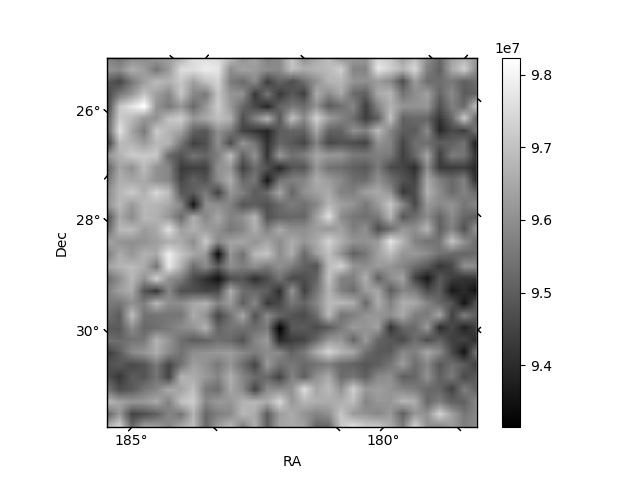
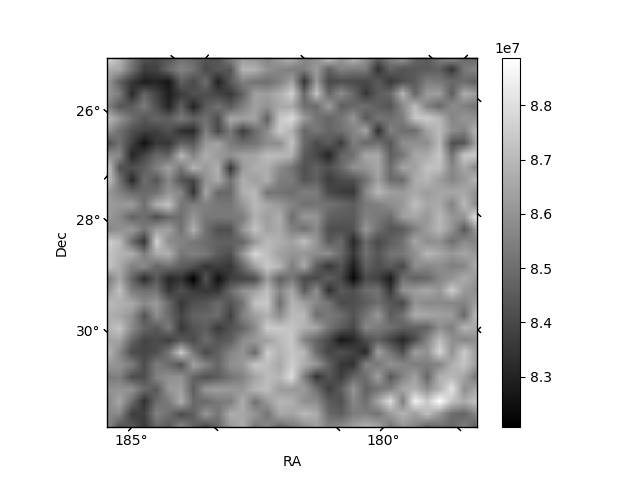
Histogram calculated using DETX and DETY for each event in the final _common_clean file
| Quadrant A | 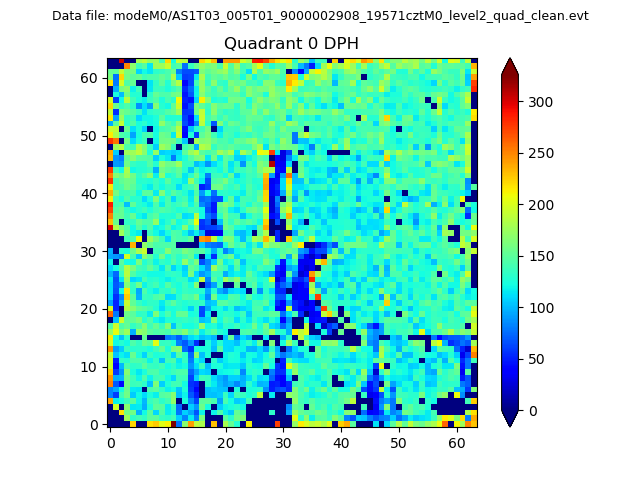 |
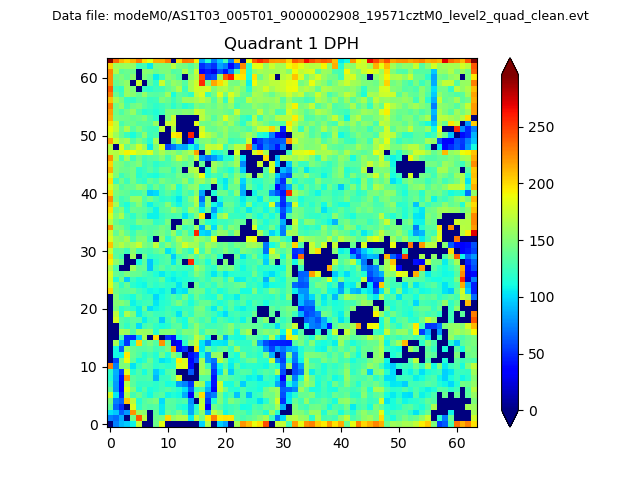 |
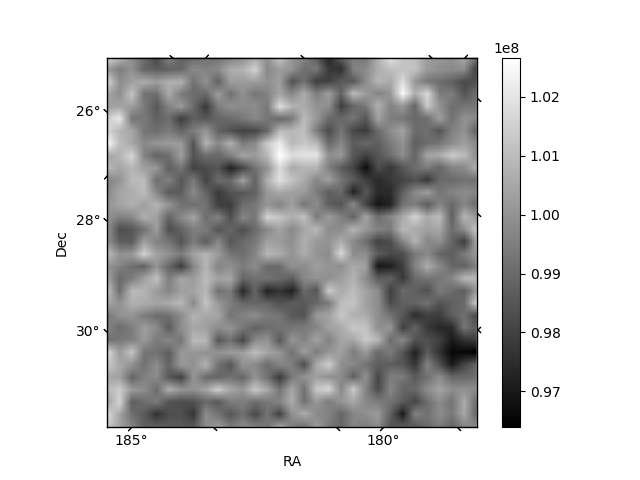
Quadrant B |
|---|---|---|---|
| Quadrant D | 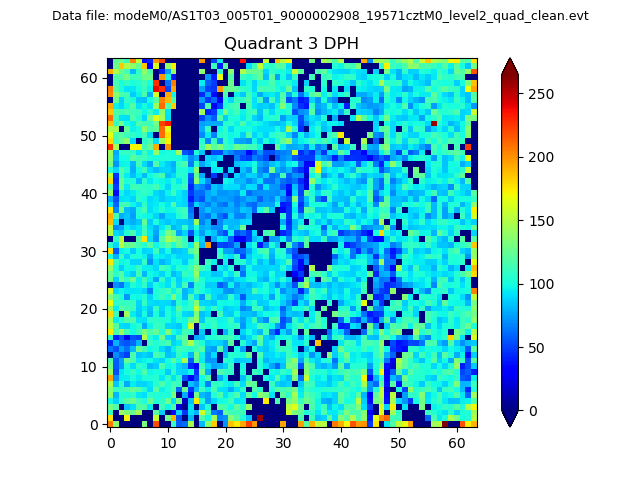 |
 |
Quadrant C |
| Plot type | Count rate plots | Images |
|---|---|---|
| Comparison with Poisson distribution Blue bars denote a histogram of data divided into 1 sec bins. Red curve is a Poisson curve with rate = median count rate of data. |
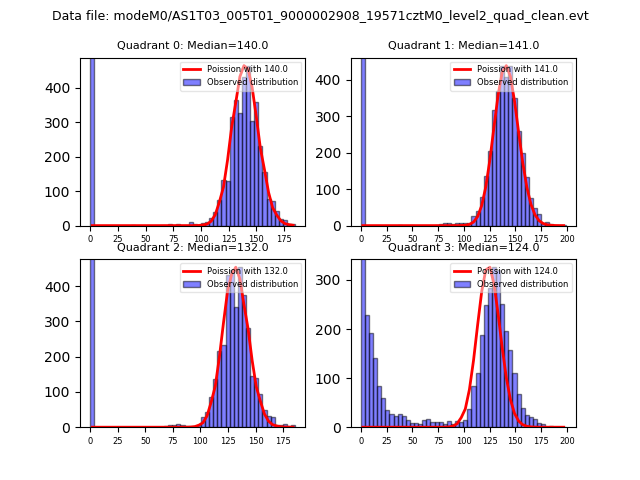 |
 |
| Quadrant-wise count rates Data is divided into 100 sec bins |
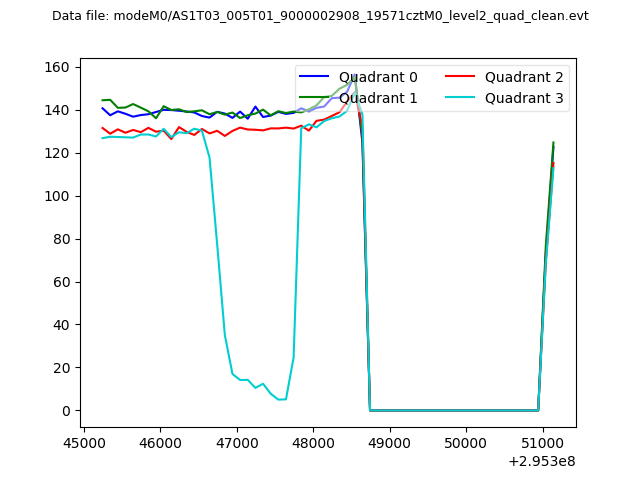 |
|
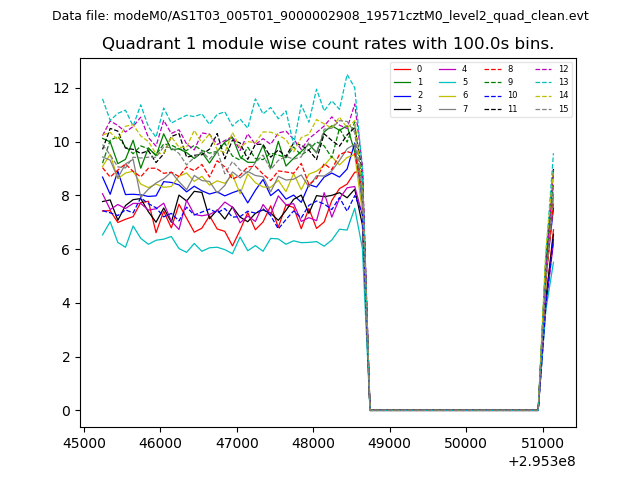
| Module-wise count rates for Quadrant A Data is divided into 100 sec bins |
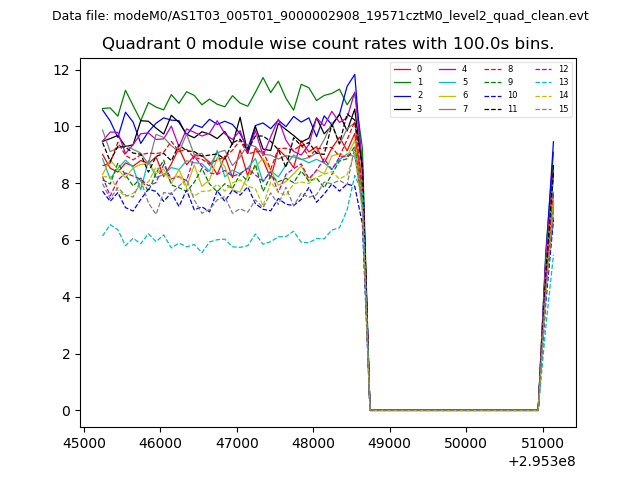 |
 |
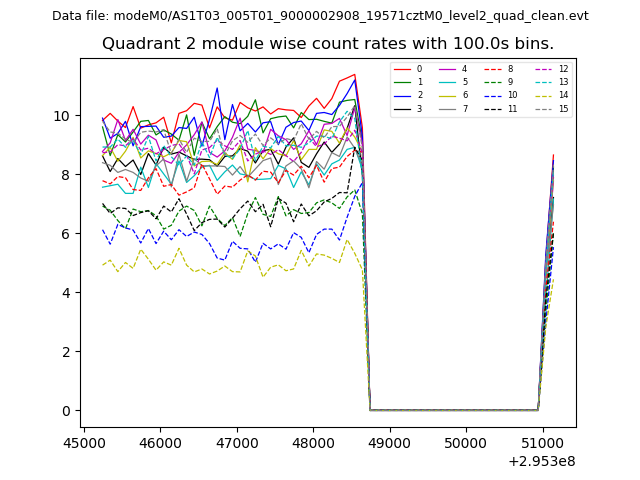
| Module-wise count rates for Quadrant B Data is divided into 100 sec bins |
 |
 |
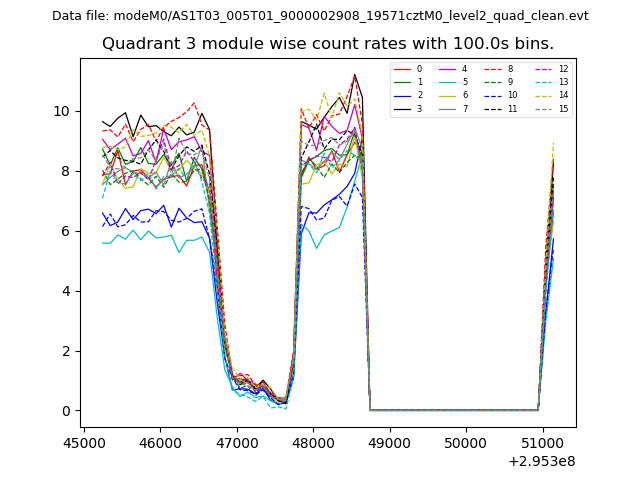
| Module-wise count rates for Quadrant C Data is divided into 100 sec bins |
 |
 |
| Module-wise count rates for Quadrant D Data is divided into 100 sec bins |
 |
 |
| Parameter | Plot |
|---|---|
| CZT HV Monitor | 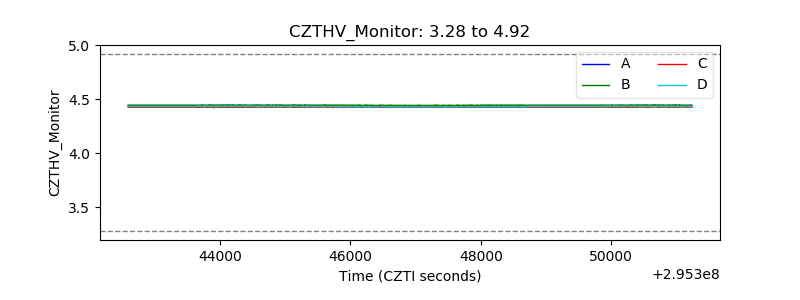 |
| D_VDD |  |
| Temperature 1 | 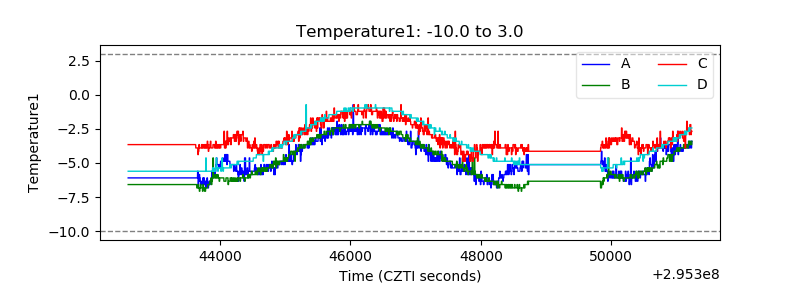 |
| Veto HV Monitor | 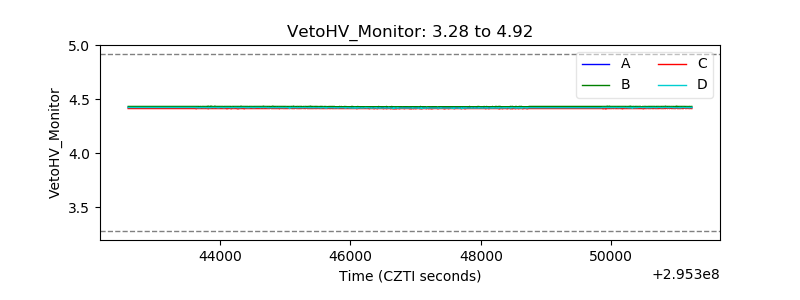 |
| Veto LLD | 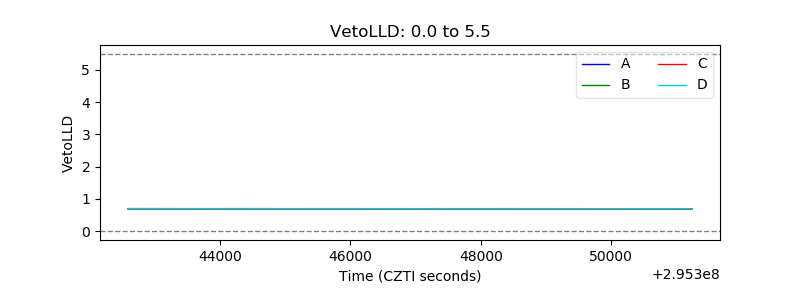 |
| Alpha Counter | 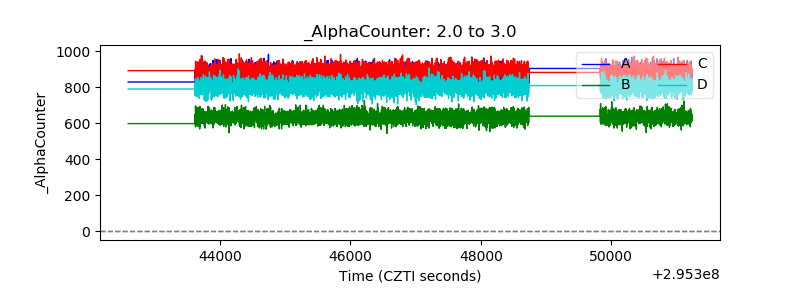 |
| _CPM_Rate | 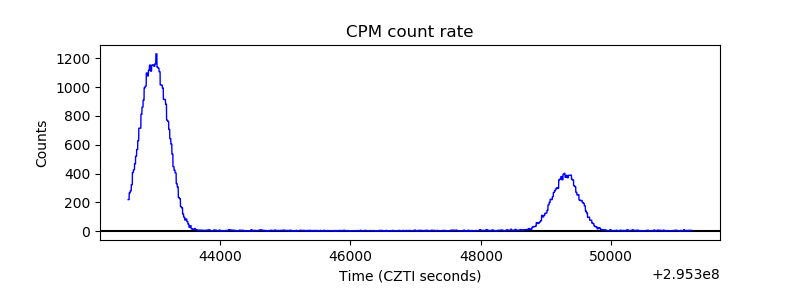 |
| CZT Counter | 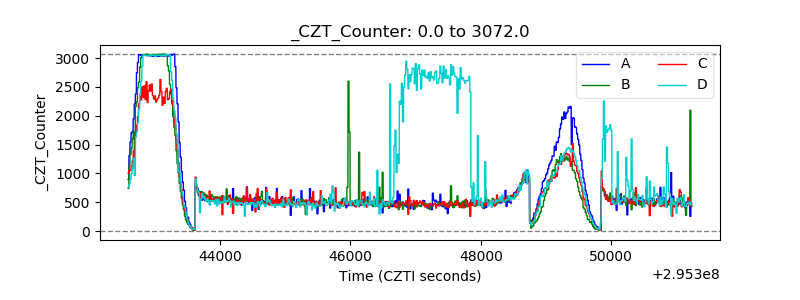 |
| +2.5 Volts monitor |  |
| +5 Volts monitor |  |
| _ROLL_ROT | 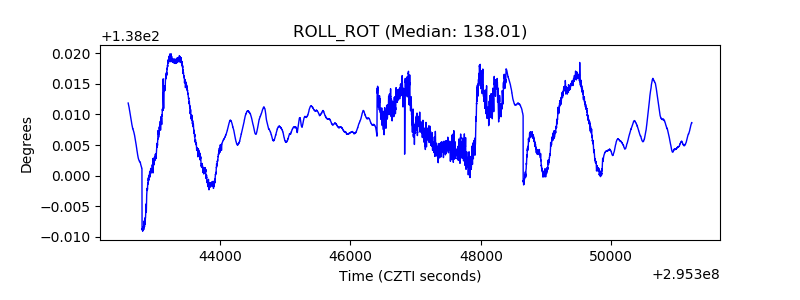 |
| _Roll_DEC | 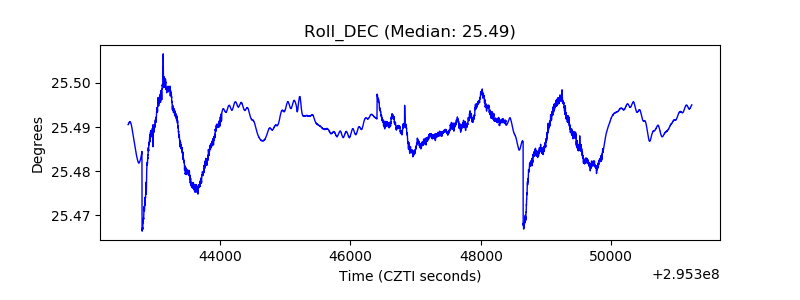 |
| _Roll_RA | 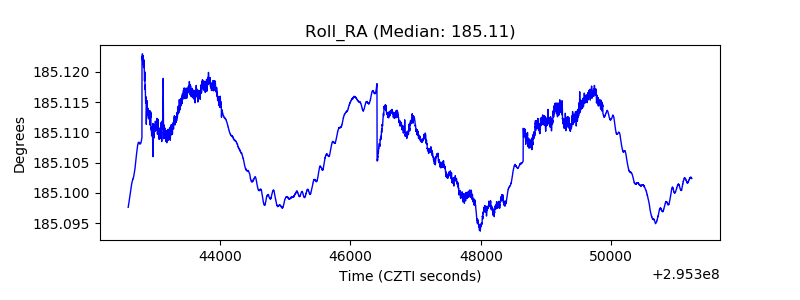 |
| Veto Counter | 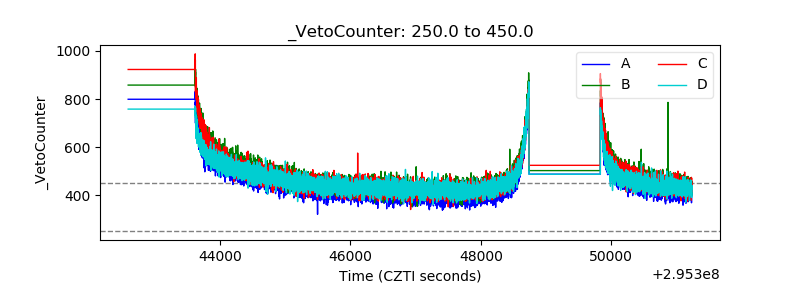 |