| Param | Original file | Final file |
|---|---|---|
| Filename | modeM0/AS1T03_005T01_9000002908_19573cztM0_level2.evt | modeM0/AS1T03_005T01_9000002908_19573cztM0_level2_quad_clean.evt |
| Size (bytes) | 589,959,360 | 92,347,200 |
| Size | 562.6 MB | 88.1 MB |
| Events in quadrant A | 3,619,684 | 602,818 |
| Events in quadrant B | 3,644,170 | 608,503 |
| Events in quadrant C | 3,696,956 | 572,065 |
| Events in quadrant D | 6,402,557 | 496,239 |
| Mode M9 | |||
|---|---|---|---|
| Quadrant | BADHDUFLAG | Total packets | Discarded packets |
| A | 0 | 8 | 0 |
| B | 0 | 9 | 0 |
| C | 0 | 9 | 0 |
| D | 0 | 9 | 0 |
| Mode SS | |||
|---|---|---|---|
| Quadrant | BADHDUFLAG | Total packets | Discarded packets |
| A | 0 | 150 | 0 |
| B | 0 | 150 | 0 |
| C | 0 | 150 | 0 |
| D | 0 | 150 | 0 |
| Mode M0 | |||
|---|---|---|---|
| Quadrant | BADHDUFLAG | Total packets | Discarded packets |
| A | 0 | 15414 | 2 |
| B | 0 | 15473 | 2 |
| C | 0 | 15597 | 2 |
| D | 0 | 23811 | 2 |
| Quadrant | Total seconds | Saturated seconds | Saturation percentage |
|---|---|---|---|
| A | 7422 | 121 | 1.630288% |
| B | 7422 | 132 | 1.778496% |
| C | 7422 | 180 | 2.425222% |
| D | 7422 | 1027 | 13.837241% |
Noise dominated data is calculated using 1-second bins in cleaned event files. If a bin has >2000 counts, and if more than 50% of those come from <1% of pixels, then it is considered to be noise-dominated and hence unusable.
| Quadrant | # 1 sec bins | Bins with >0 counts | Bins with >2000 counts | High rate bins dominated by noise | Noise dominated (total time) | Noise dominated (detector-on time) | Marked lightcurve |
|---|---|---|---|---|---|---|---|
| A | 7782 | 7422 | 2 | 2 | 0.03% | 0.03% | 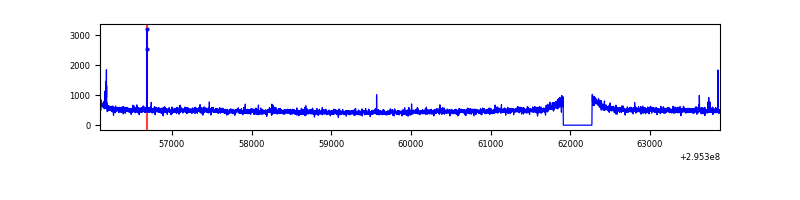 |
| B | 7782 | 7423 | 4 | 4 | 0.05% | 0.05% | 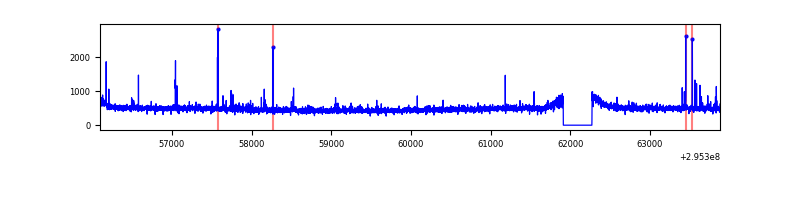 |
| C | 7782 | 7423 | 1 | 1 | 0.01% | 0.01% | 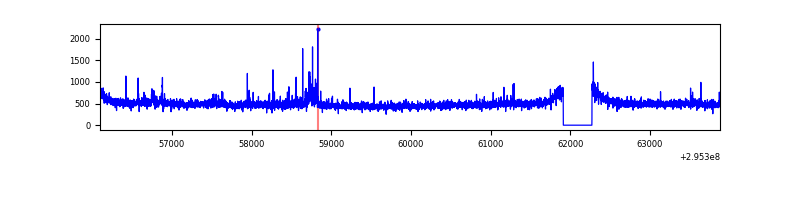 |
| D | 7782 | 7423 | 843 | 843 | 10.83% | 11.36% | 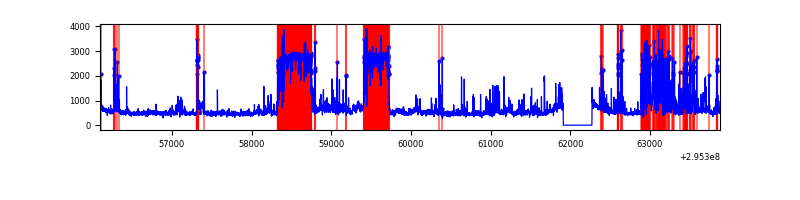 |
Top three noisy pixels from each quadrant. If the there are fewer than three noisy pixels in the level2.evt file, extra rows are filled as -1
| Pixel properties | Quadrant properties | ||||||
|---|---|---|---|---|---|---|---|
| Quadrant | DetID | PixID | Counts | Sigma | Mean | Median | Sigma |
| A | 11 | 29 | 57880 | 308.25 | 915 | 893 | 184.9 |
| A | 9 | 143 | 16246 | 83.05 | 915 | 893 | 184.9 |
| A | 5 | 16 | 10221 | 50.46 | 915 | 893 | 184.9 |
| B | 3 | 64 | 25956 | 144.36 | 906 | 885 | 173.7 |
| B | 12 | 111 | 21403 | 118.14 | 906 | 885 | 173.7 |
| B | 11 | 111 | 18789 | 103.09 | 906 | 885 | 173.7 |
| C | 14 | 238 | 134346 | 654.66 | 869 | 873 | 203.9 |
| C | 9 | 221 | 109295 | 531.79 | 869 | 873 | 203.9 |
| C | 3 | 233 | 39217 | 188.07 | 869 | 873 | 203.9 |
| D | 13 | 104 | 1687316 | 8247.04 | 831 | 807 | 204.5 |
| D | 12 | 218 | 701457 | 3426.18 | 831 | 807 | 204.5 |
| D | 7 | 238 | 323330 | 1577.14 | 831 | 807 | 204.5 |
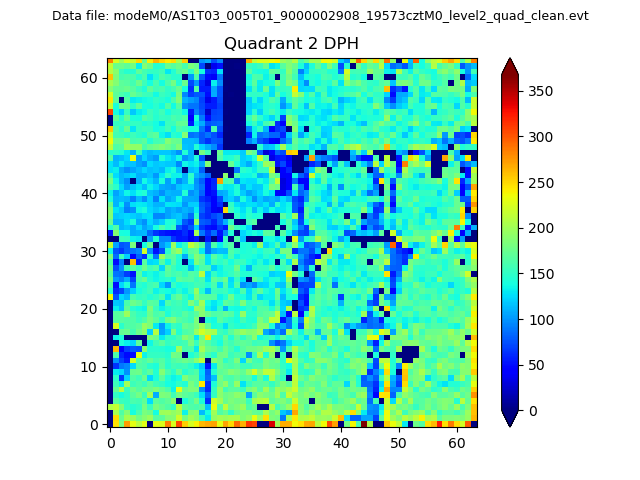
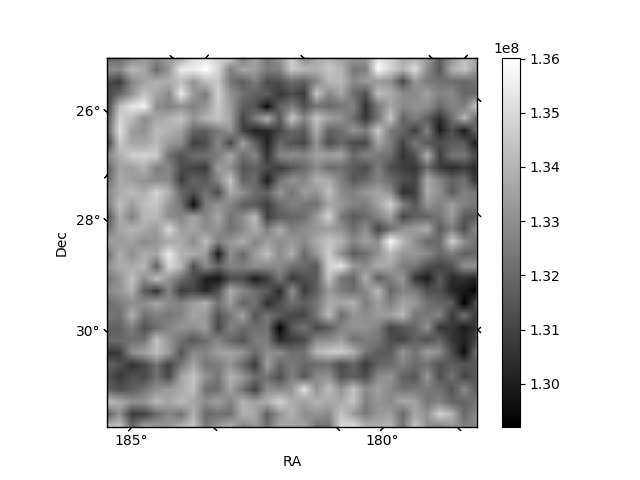
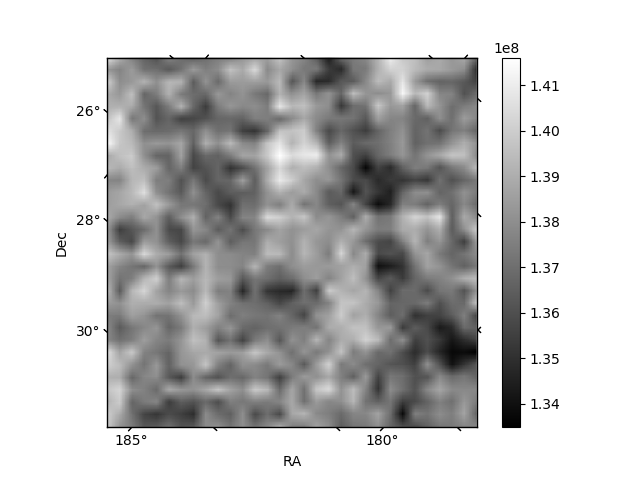
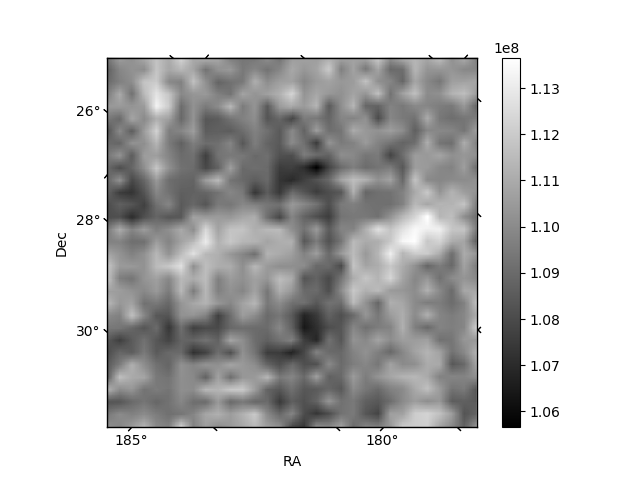
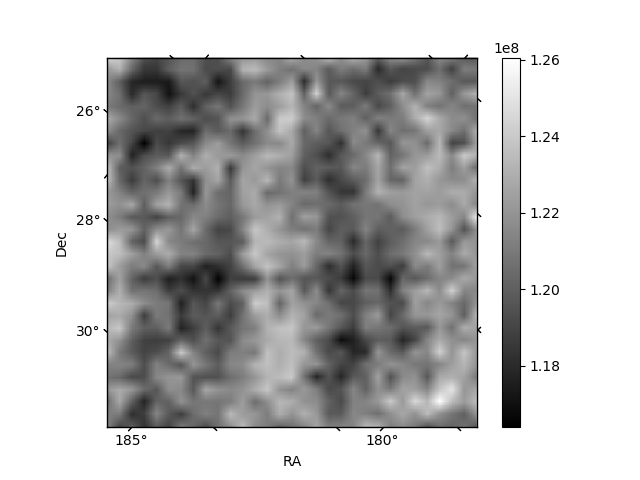
Histogram calculated using DETX and DETY for each event in the final _common_clean file
| Quadrant A | 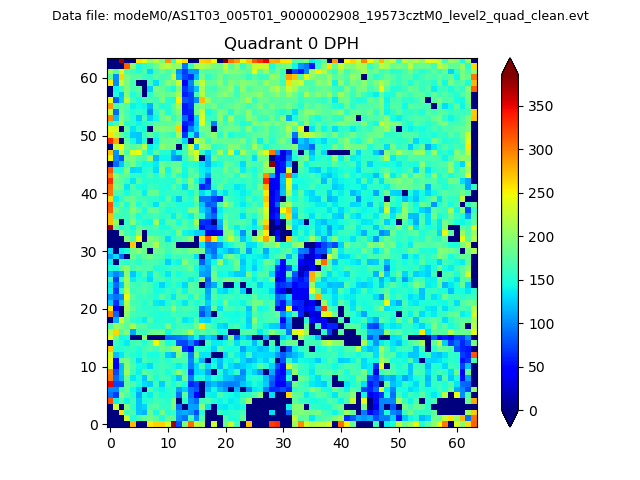 |
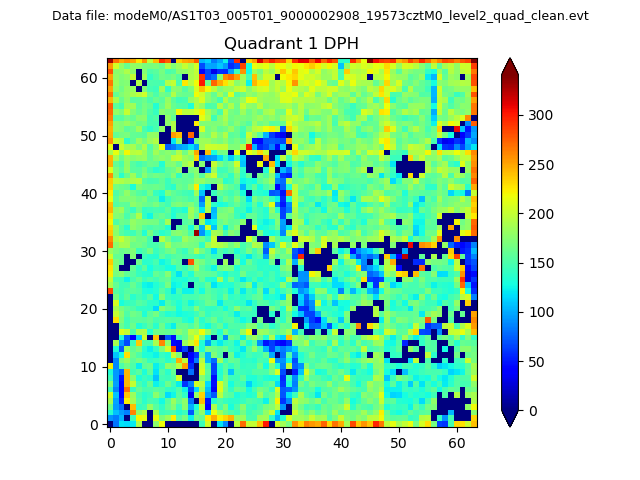 |
Quadrant B |
|---|---|---|---|
| Quadrant D | 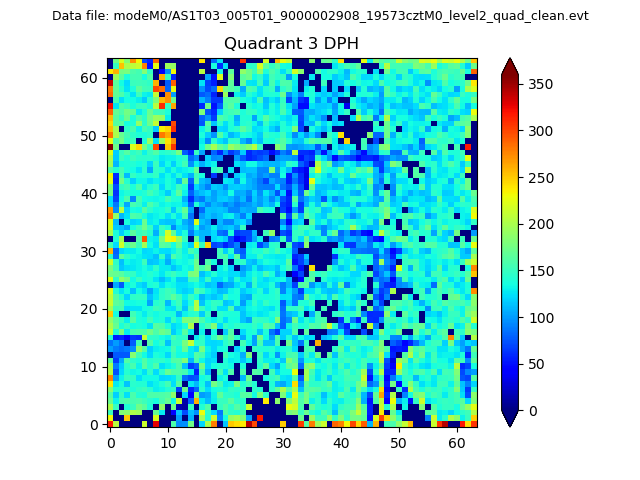 |
 |
Quadrant C |
| Plot type | Count rate plots | Images |
|---|---|---|
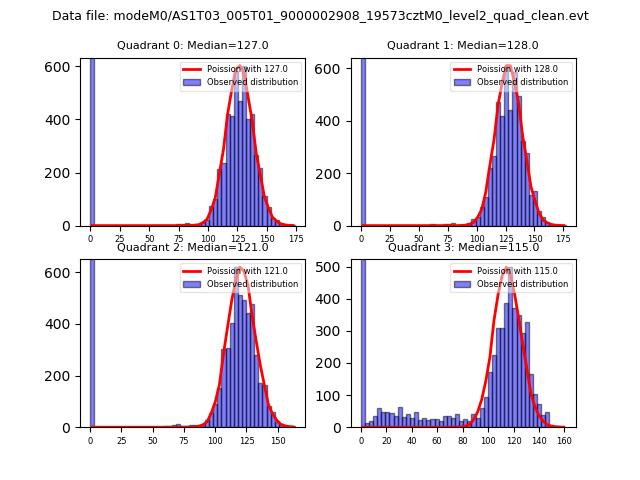
| Comparison with Poisson distribution Blue bars denote a histogram of data divided into 1 sec bins. Red curve is a Poisson curve with rate = median count rate of data. |
 |
 |
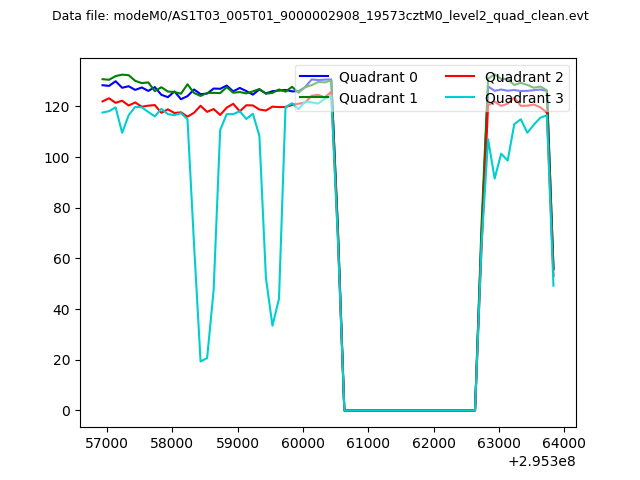
| Quadrant-wise count rates Data is divided into 100 sec bins |
 |
|
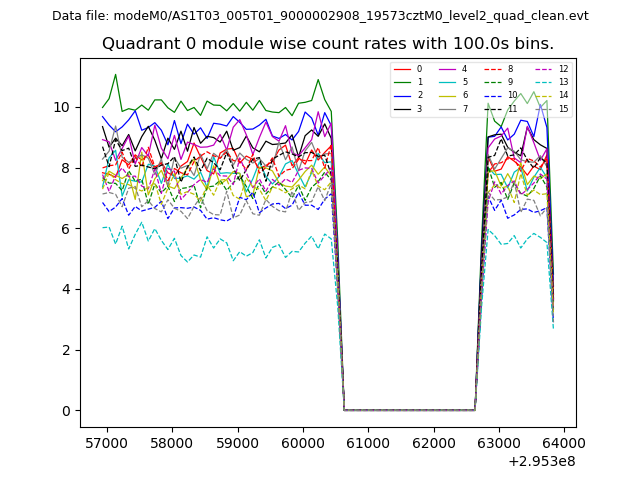
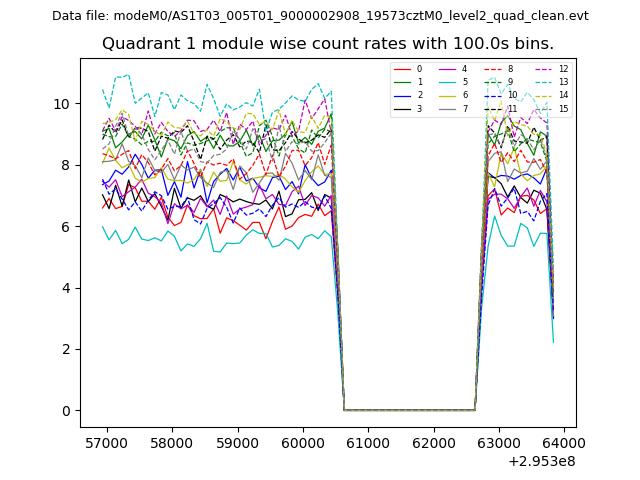
| Module-wise count rates for Quadrant A Data is divided into 100 sec bins |
 |
 |
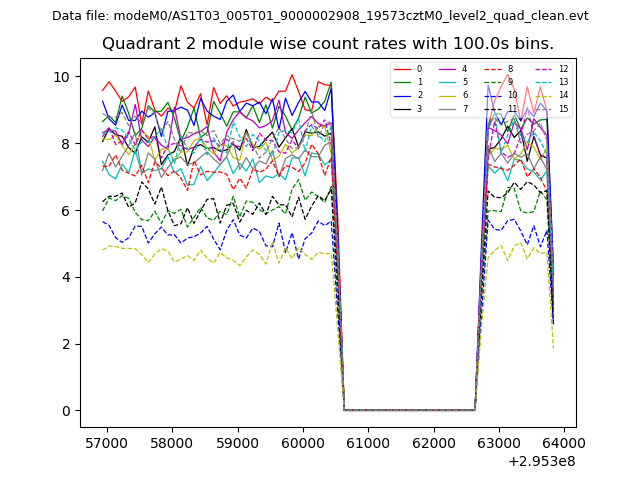
| Module-wise count rates for Quadrant B Data is divided into 100 sec bins |
 |
 |
| Module-wise count rates for Quadrant C Data is divided into 100 sec bins |
 |
 |
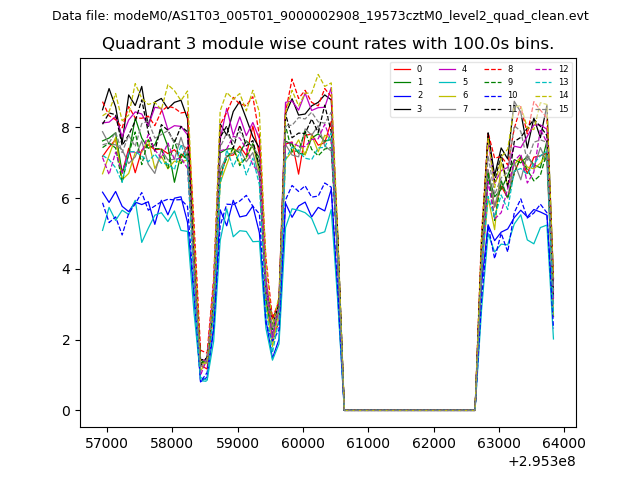
| Module-wise count rates for Quadrant D Data is divided into 100 sec bins |
 |
 |
| Parameter | Plot |
|---|---|
| CZT HV Monitor | 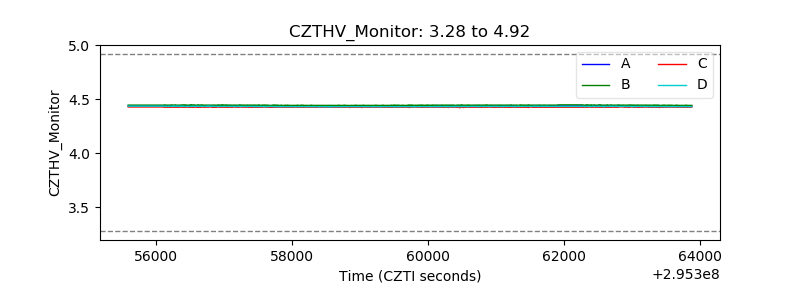 |
| D_VDD | 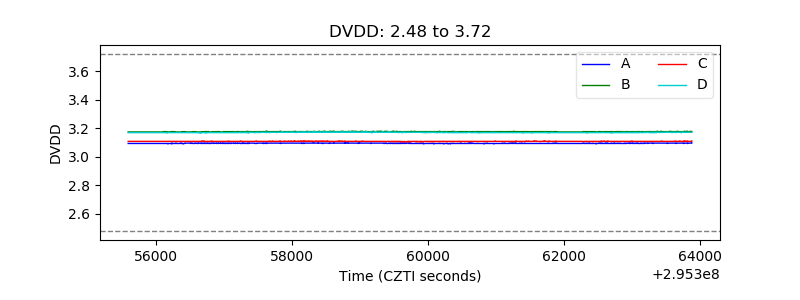 |
| Temperature 1 | 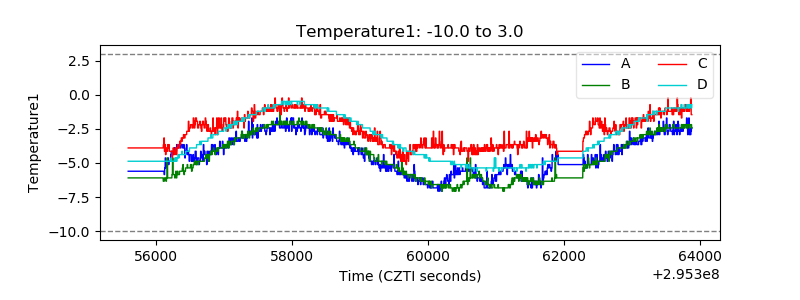 |
| Veto HV Monitor | 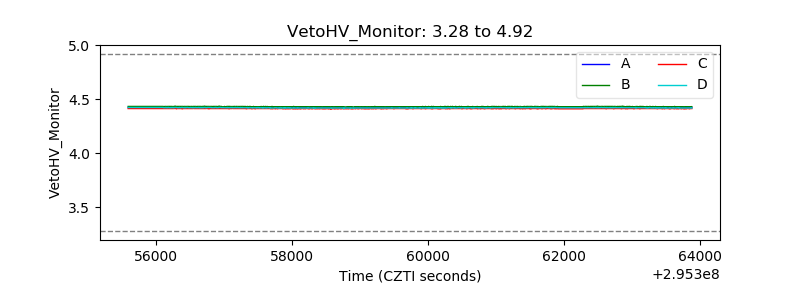 |
| Veto LLD | 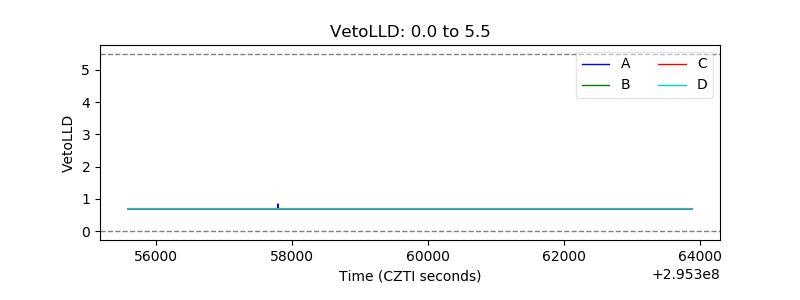 |
| Alpha Counter | 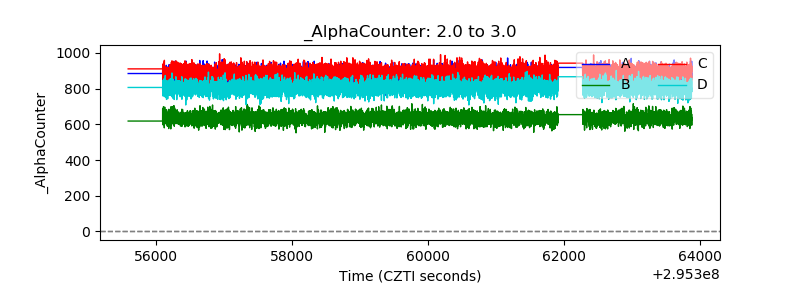 |
| _CPM_Rate | 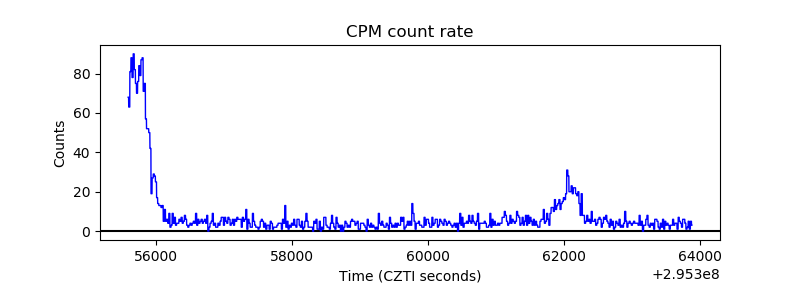 |
| CZT Counter | 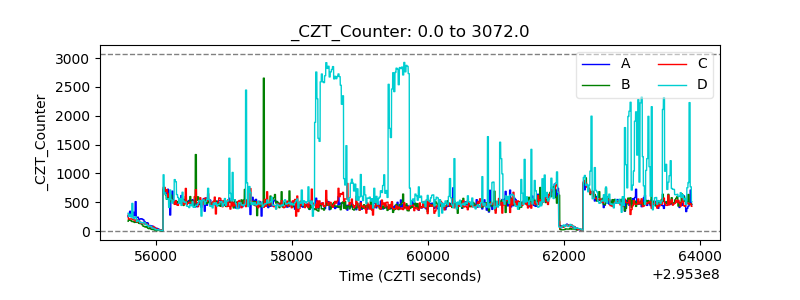 |
| +2.5 Volts monitor |  |
| +5 Volts monitor |  |
| _ROLL_ROT | 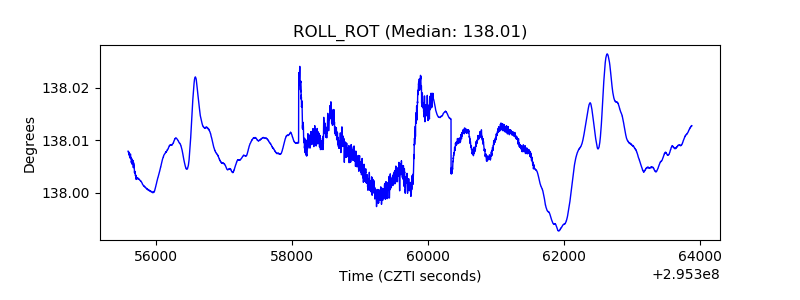 |
| _Roll_DEC | 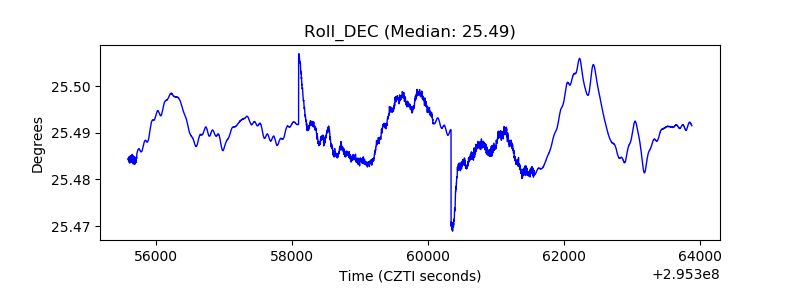 |
| _Roll_RA | 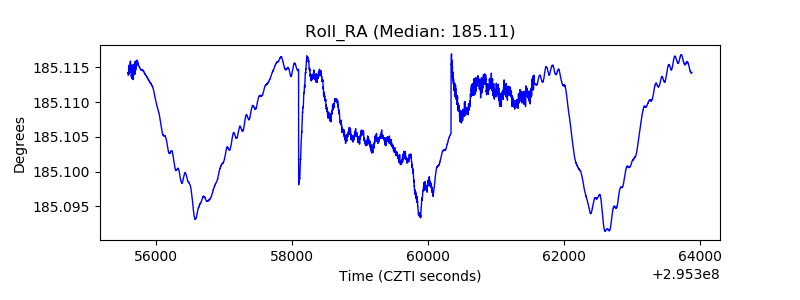 |
| Veto Counter | 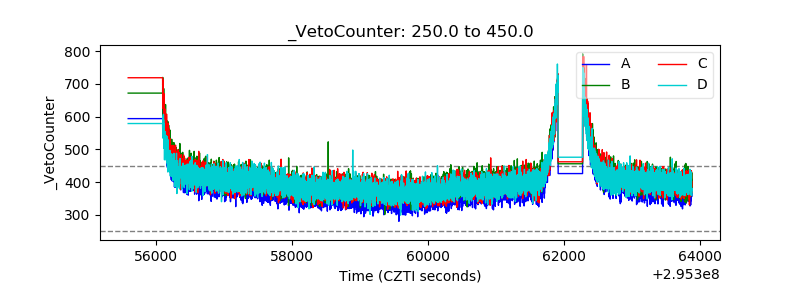 |