| Param | Original file | Final file |
|---|---|---|
| Filename | modeM0/AS1T03_005T01_9000002908_19574cztM0_level2.evt | modeM0/AS1T03_005T01_9000002908_19574cztM0_level2_quad_clean.evt |
| Size (bytes) | 636,197,760 | 95,048,640 |
| Size | 606.7 MB | 90.6 MB |
| Events in quadrant A | 3,621,855 | 634,637 |
| Events in quadrant B | 3,727,788 | 639,436 |
| Events in quadrant C | 3,686,377 | 603,330 |
| Events in quadrant D | 7,728,836 | 485,057 |
| Mode SS | |||
|---|---|---|---|
| Quadrant | BADHDUFLAG | Total packets | Discarded packets |
| A | 0 | 150 | 0 |
| B | 0 | 150 | 0 |
| C | 0 | 150 | 0 |
| D | 0 | 150 | 0 |
| Mode M0 | |||
|---|---|---|---|
| Quadrant | BADHDUFLAG | Total packets | Discarded packets |
| A | 0 | 15547 | 1 |
| B | 0 | 15797 | 1 |
| C | 0 | 15623 | 1 |
| D | 0 | 27853 | 1 |
| Quadrant | Total seconds | Saturated seconds | Saturation percentage |
|---|---|---|---|
| A | 7398 | 209 | 2.825088% |
| B | 7398 | 257 | 3.473912% |
| C | 7398 | 251 | 3.392809% |
| D | 7398 | 1774 | 23.979454% |
Noise dominated data is calculated using 1-second bins in cleaned event files. If a bin has >2000 counts, and if more than 50% of those come from <1% of pixels, then it is considered to be noise-dominated and hence unusable.
| Quadrant | # 1 sec bins | Bins with >0 counts | Bins with >2000 counts | High rate bins dominated by noise | Noise dominated (total time) | Noise dominated (detector-on time) | Marked lightcurve |
|---|---|---|---|---|---|---|---|
| A | 7478 | 7399 | 4 | 4 | 0.05% | 0.05% | 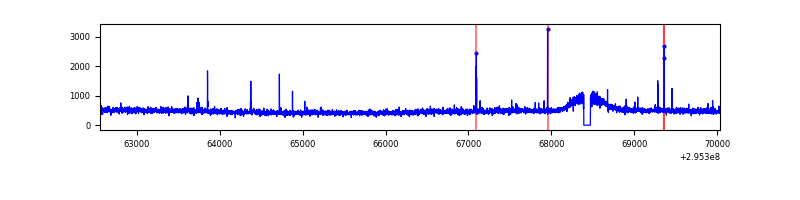 |
| B | 7478 | 7399 | 19 | 19 | 0.25% | 0.26% | 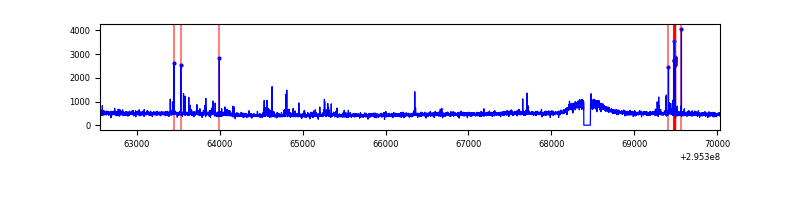 |
| C | 7478 | 7399 | 0 | 0 | 0.00% | 0.00% | 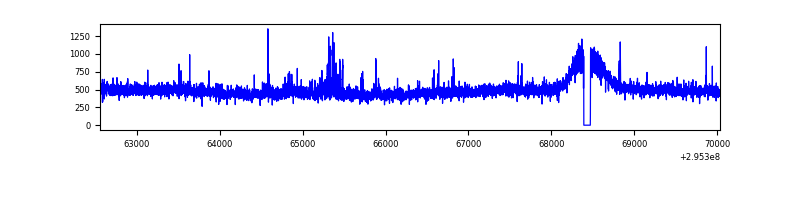 |
| D | 7478 | 7398 | 1346 | 1346 | 18.00% | 18.19% | 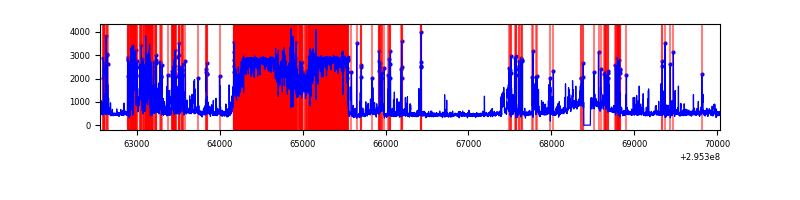 |
Top three noisy pixels from each quadrant. If the there are fewer than three noisy pixels in the level2.evt file, extra rows are filled as -1
| Pixel properties | Quadrant properties | ||||||
|---|---|---|---|---|---|---|---|
| Quadrant | DetID | PixID | Counts | Sigma | Mean | Median | Sigma |
| A | 9 | 143 | 30966 | 159.83 | 919 | 898 | 188.1 |
| A | 11 | 29 | 27247 | 140.06 | 919 | 898 | 188.1 |
| A | 5 | 16 | 17275 | 87.06 | 919 | 898 | 188.1 |
| B | 3 | 64 | 75822 | 428.44 | 909 | 884 | 174.9 |
| B | 7 | 220 | 25483 | 140.64 | 909 | 884 | 174.9 |
| B | 12 | 111 | 21830 | 119.75 | 909 | 884 | 174.9 |
| C | 14 | 238 | 133769 | 635.75 | 876 | 880 | 209.0 |
| C | 7 | 247 | 75321 | 356.13 | 876 | 880 | 209.0 |
| C | 9 | 221 | 27520 | 127.45 | 876 | 880 | 209.0 |
| D | 13 | 104 | 2886042 | 14478.37 | 806 | 782 | 199.3 |
| D | 12 | 218 | 680219 | 3409.45 | 806 | 782 | 199.3 |
| D | 1 | 52 | 667359 | 3344.91 | 806 | 782 | 199.3 |
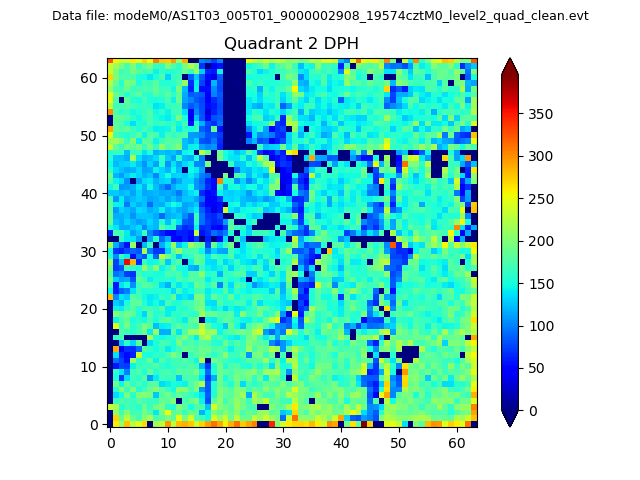
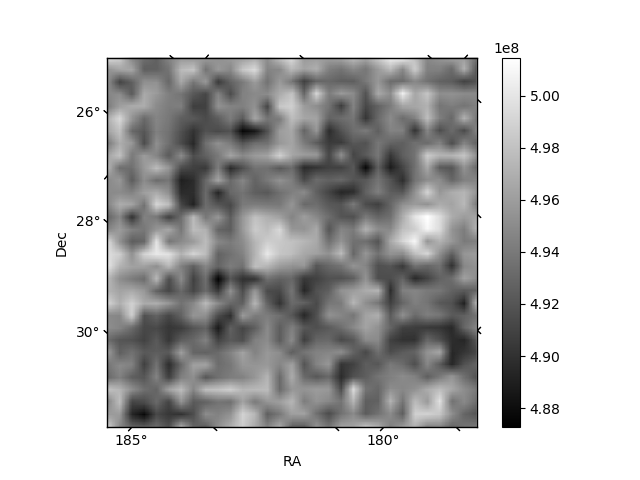
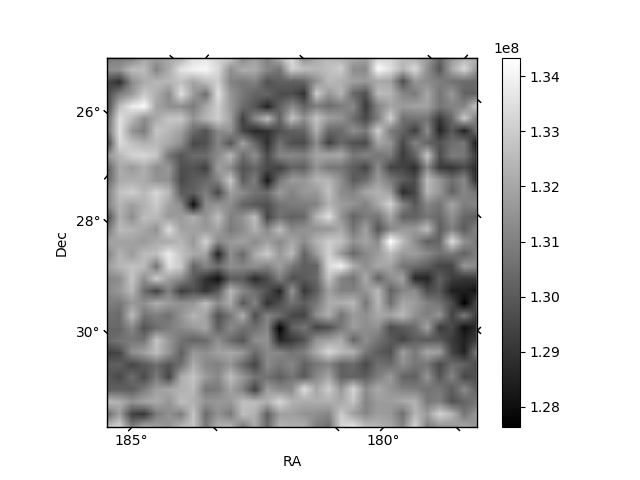
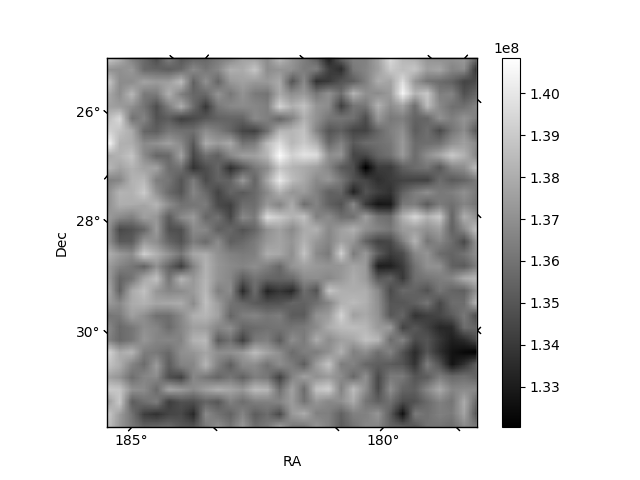
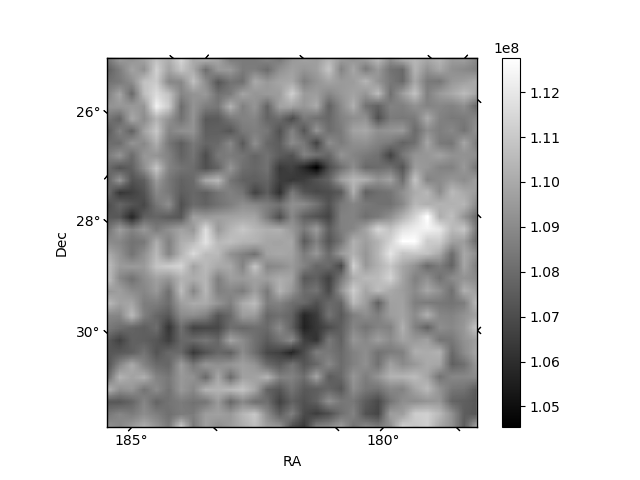
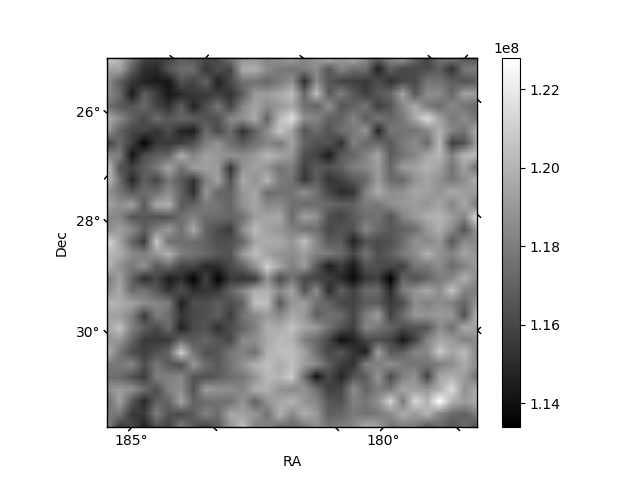
Histogram calculated using DETX and DETY for each event in the final _common_clean file
| Quadrant A | 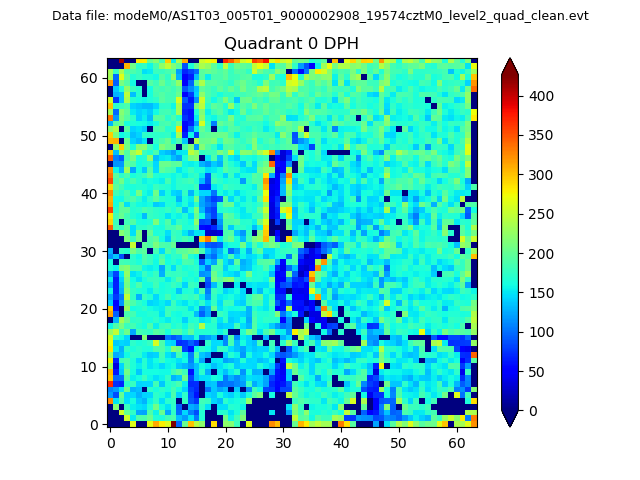 |
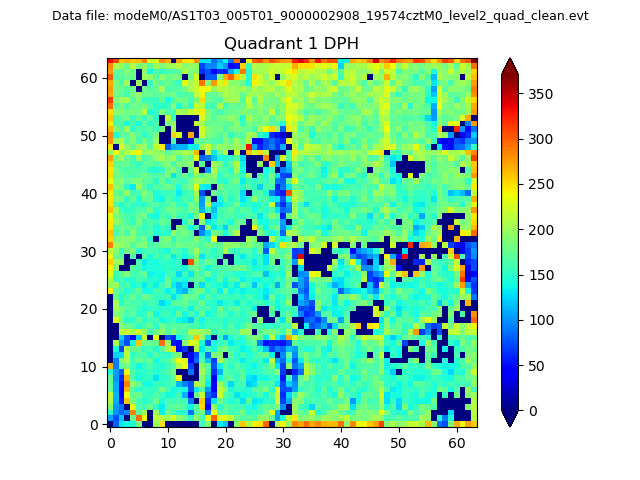 |
Quadrant B |
|---|---|---|---|
| Quadrant D | 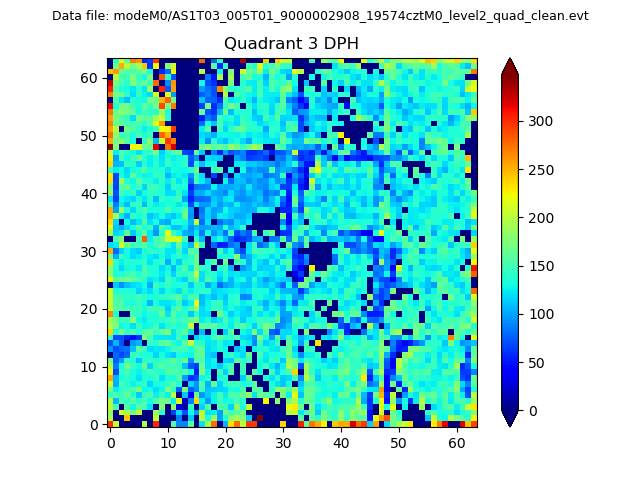 |
 |
Quadrant C |
| Plot type | Count rate plots | Images |
|---|---|---|
| Comparison with Poisson distribution Blue bars denote a histogram of data divided into 1 sec bins. Red curve is a Poisson curve with rate = median count rate of data. |
 |
 |
| Quadrant-wise count rates Data is divided into 100 sec bins |
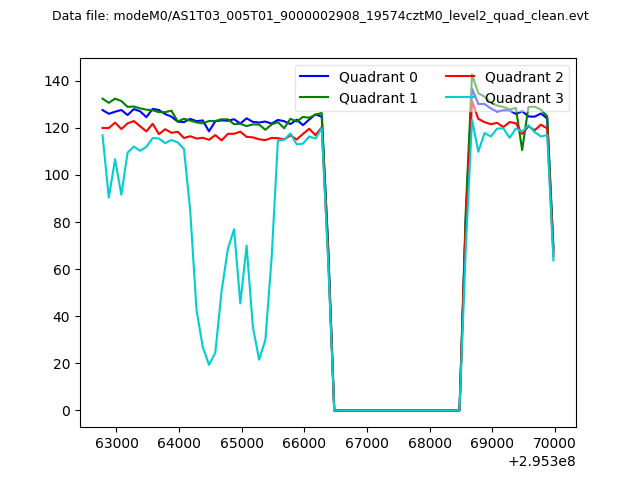 |
|
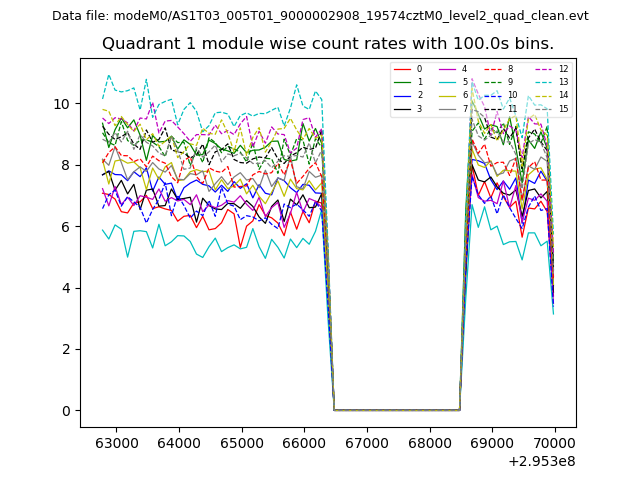
| Module-wise count rates for Quadrant A Data is divided into 100 sec bins |
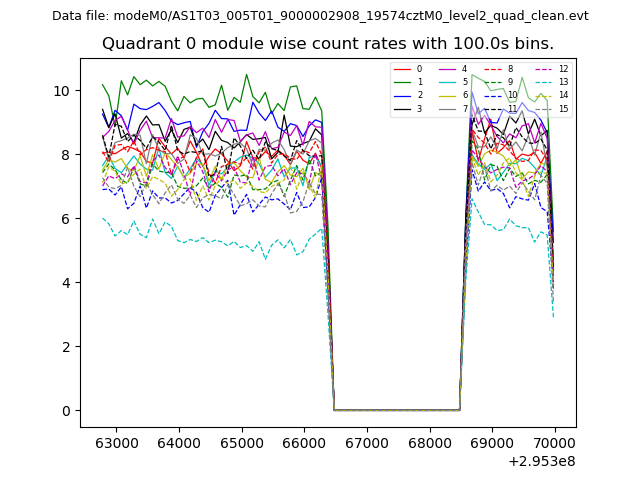 |
 |
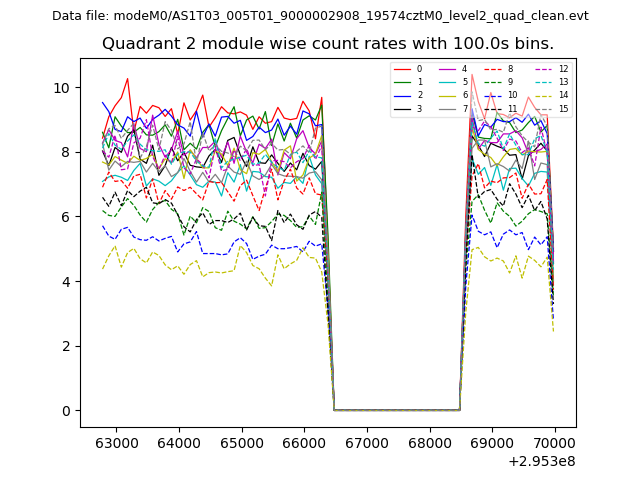
| Module-wise count rates for Quadrant B Data is divided into 100 sec bins |
 |
 |
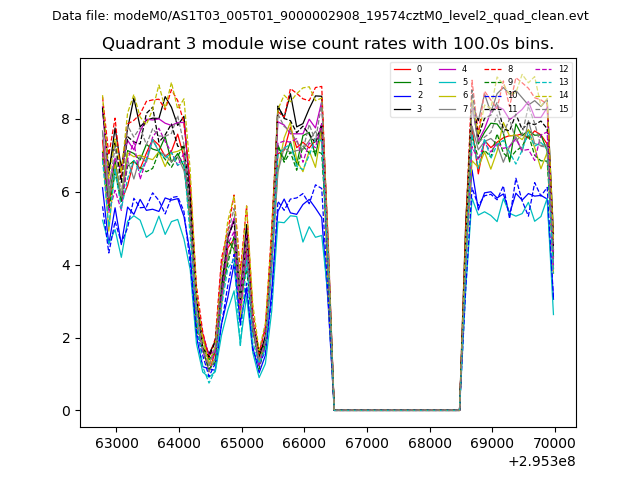
| Module-wise count rates for Quadrant C Data is divided into 100 sec bins |
 |
 |
| Module-wise count rates for Quadrant D Data is divided into 100 sec bins |
 |
 |
| Parameter | Plot |
|---|---|
| CZT HV Monitor | 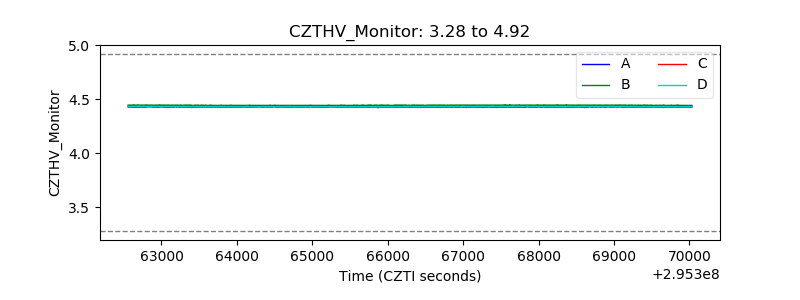 |
| D_VDD | 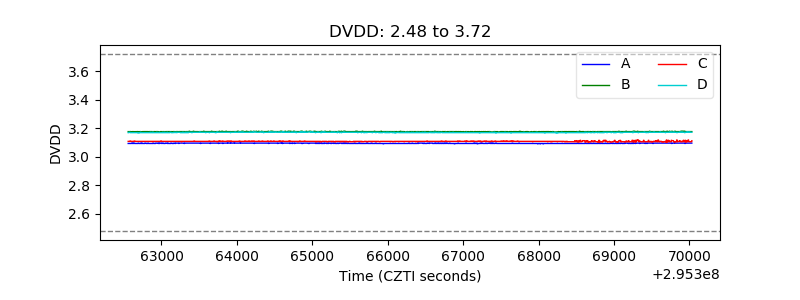 |
| Temperature 1 | 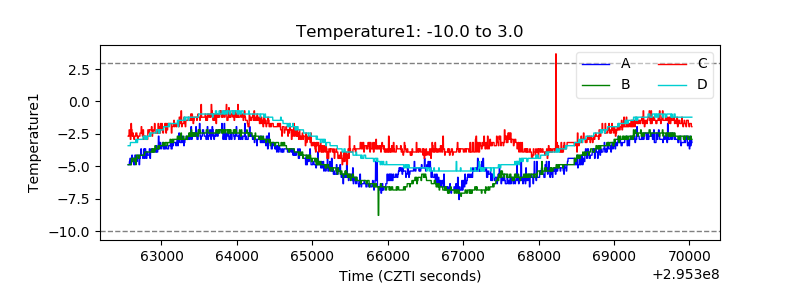 |
| Veto HV Monitor | 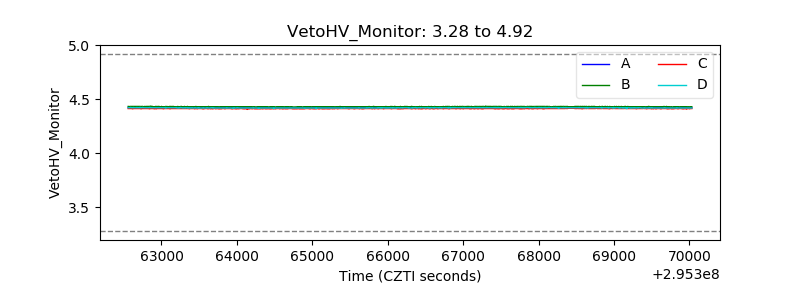 |
| Veto LLD | 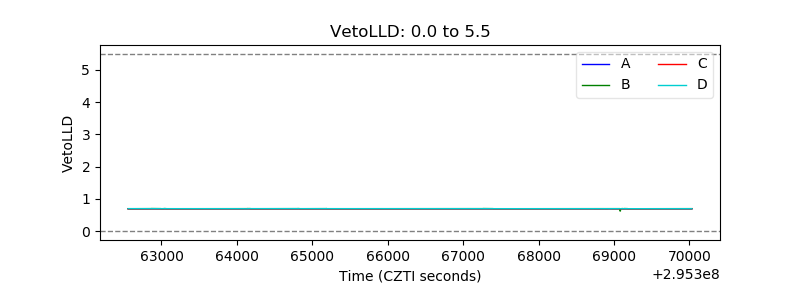 |
| Alpha Counter | 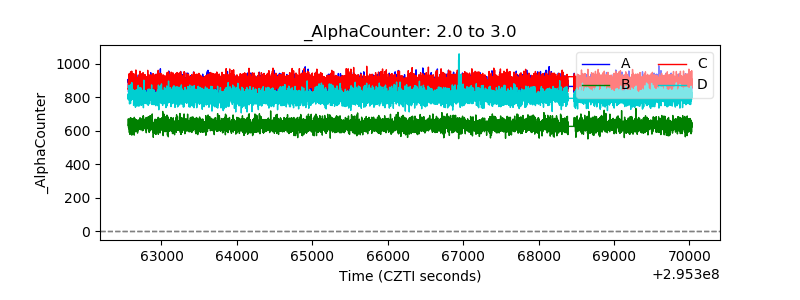 |
| _CPM_Rate | 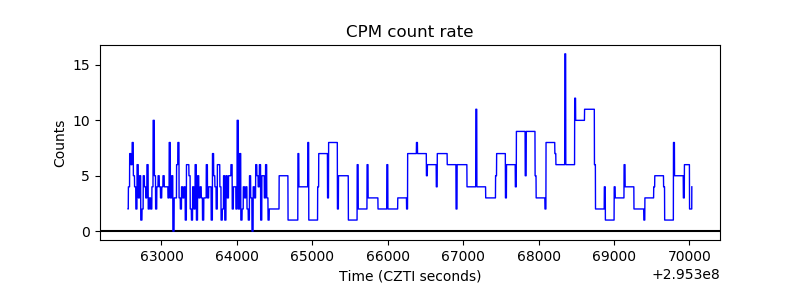 |
| CZT Counter | 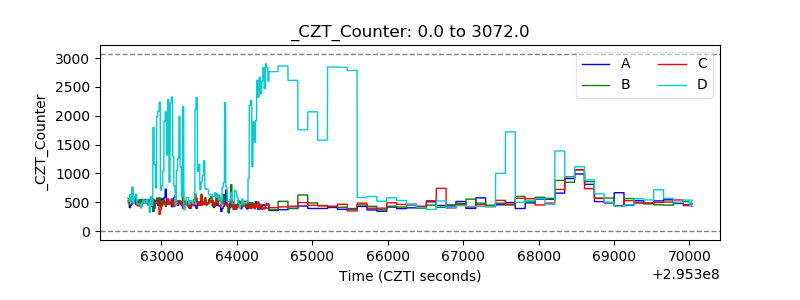 |
| +2.5 Volts monitor |  |
| +5 Volts monitor |  |
| _ROLL_ROT | 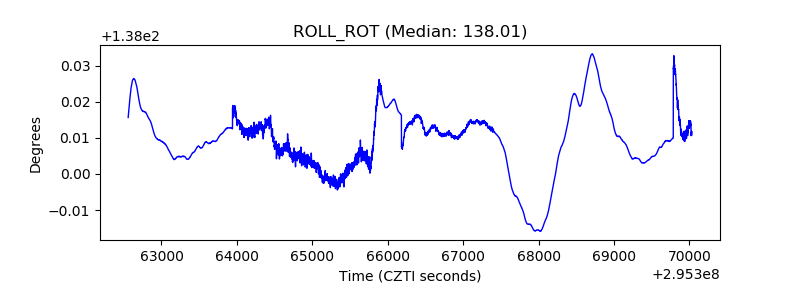 |
| _Roll_DEC | 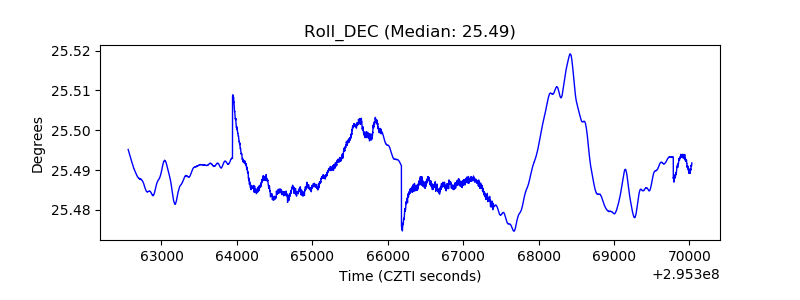 |
| _Roll_RA | 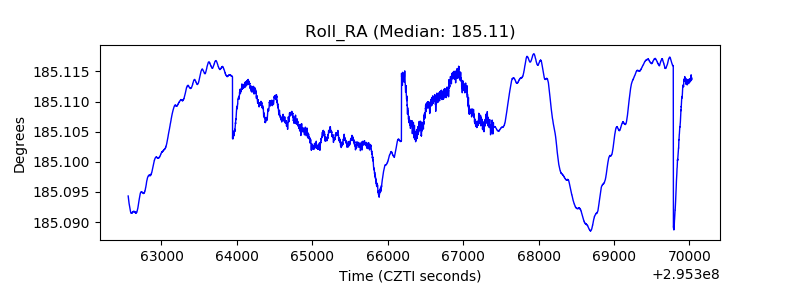 |
| Veto Counter | 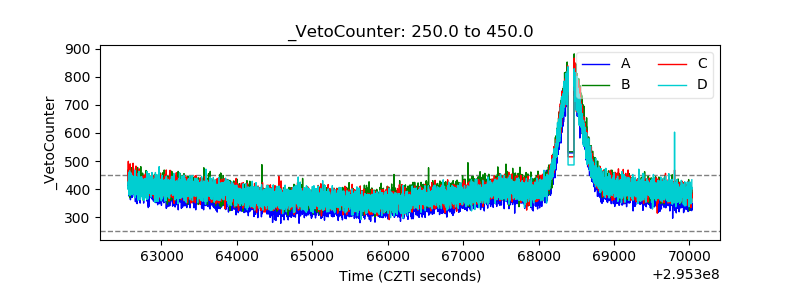 |