| Param | Original file | Final file |
|---|---|---|
| Filename | modeM0/AS1T03_005T01_9000002908_19578cztM0_level2.evt | modeM0/AS1T03_005T01_9000002908_19578cztM0_level2_quad_clean.evt |
| Size (bytes) | 167,143,680 | 41,443,200 |
| Size | 159.4 MB | 39.5 MB |
| Events in quadrant A | 1,062,842 | 282,377 |
| Events in quadrant B | 1,089,716 | 284,453 |
| Events in quadrant C | 1,102,894 | 270,080 |
| Events in quadrant D | 1,651,407 | 255,576 |
| Mode SS | |||
|---|---|---|---|
| Quadrant | BADHDUFLAG | Total packets | Discarded packets |
| A | 0 | 46 | 0 |
| B | 0 | 46 | 0 |
| C | 0 | 46 | 0 |
| D | 0 | 46 | 0 |
| Mode M0 | |||
|---|---|---|---|
| Quadrant | BADHDUFLAG | Total packets | Discarded packets |
| A | 0 | 4700 | 1 |
| B | 0 | 4751 | 1 |
| C | 0 | 4741 | 1 |
| D | 0 | 6337 | 1 |
| Quadrant | Total seconds | Saturated seconds | Saturation percentage |
|---|---|---|---|
| A | 2242 | 33 | 1.471900% |
| B | 2243 | 50 | 2.229157% |
| C | 2243 | 68 | 3.031654% |
| D | 2243 | 159 | 7.088720% |
Noise dominated data is calculated using 1-second bins in cleaned event files. If a bin has >2000 counts, and if more than 50% of those come from <1% of pixels, then it is considered to be noise-dominated and hence unusable.
| Quadrant | # 1 sec bins | Bins with >0 counts | Bins with >2000 counts | High rate bins dominated by noise | Noise dominated (total time) | Noise dominated (detector-on time) | Marked lightcurve |
|---|---|---|---|---|---|---|---|
| A | 2242 | 2242 | 0 | 0 | 0.00% | 0.00% | 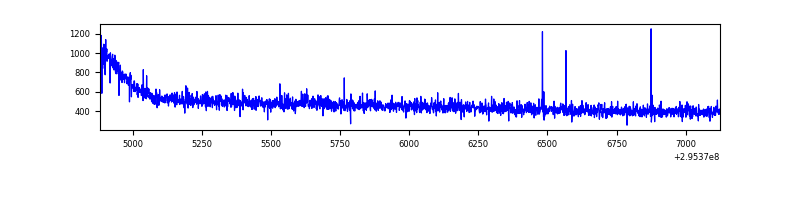 |
| B | 2243 | 2243 | 0 | 0 | 0.00% | 0.00% | 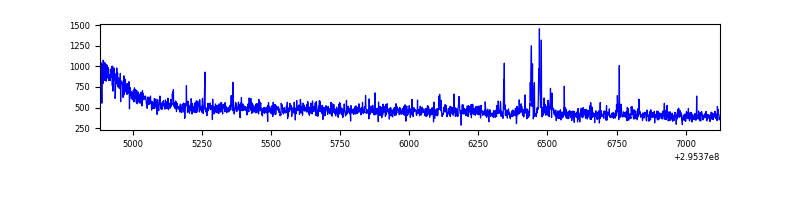 |
| C | 2243 | 2243 | 0 | 0 | 0.00% | 0.00% | 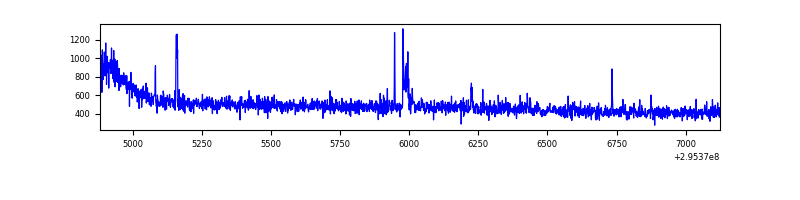 |
| D | 2243 | 2243 | 137 | 137 | 6.11% | 6.11% | 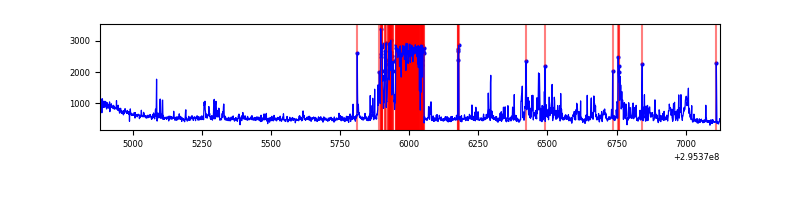 |
Top three noisy pixels from each quadrant. If the there are fewer than three noisy pixels in the level2.evt file, extra rows are filled as -1
| Pixel properties | Quadrant properties | ||||||
|---|---|---|---|---|---|---|---|
| Quadrant | DetID | PixID | Counts | Sigma | Mean | Median | Sigma |
| A | 9 | 143 | 5069 | 82.52 | 274 | 269 | 58.2 |
| A | 13 | 254 | 3027 | 47.42 | 274 | 269 | 58.2 |
| A | 0 | 226 | 2369 | 36.1 | 274 | 269 | 58.2 |
| B | 7 | 220 | 14543 | 260.49 | 271 | 264 | 54.8 |
| B | 0 | 190 | 6928 | 121.57 | 271 | 264 | 54.8 |
| B | 12 | 111 | 6116 | 106.76 | 271 | 264 | 54.8 |
| C | 14 | 238 | 40249 | 627.34 | 263 | 265 | 63.7 |
| C | 7 | 247 | 22533 | 349.38 | 263 | 265 | 63.7 |
| C | 3 | 233 | 6095 | 91.47 | 263 | 265 | 63.7 |
| D | 13 | 104 | 344517 | 5228.92 | 263 | 254 | 65.8 |
| D | 1 | 52 | 136156 | 2064.18 | 263 | 254 | 65.8 |
| D | 12 | 218 | 81915 | 1240.33 | 263 | 254 | 65.8 |
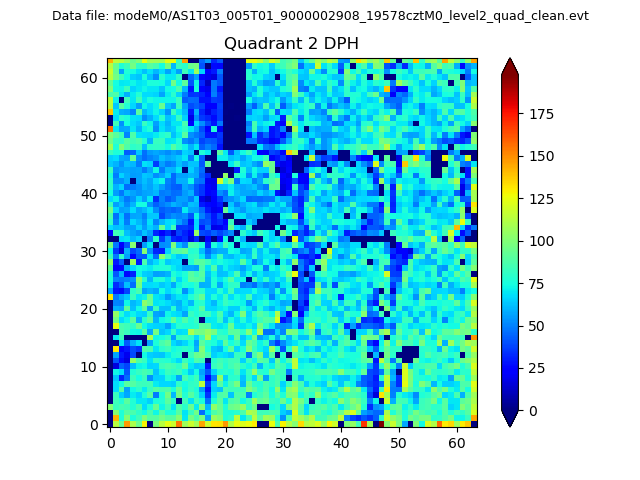
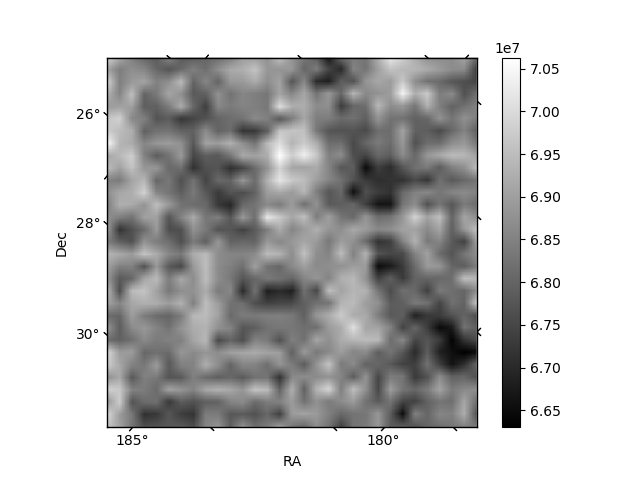
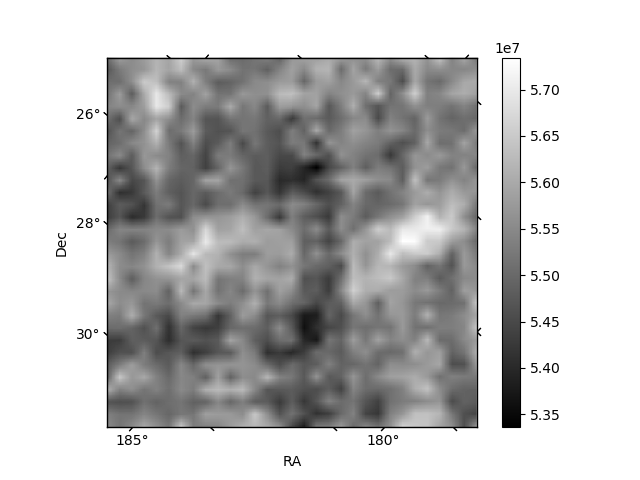
Histogram calculated using DETX and DETY for each event in the final _common_clean file
| Quadrant A | 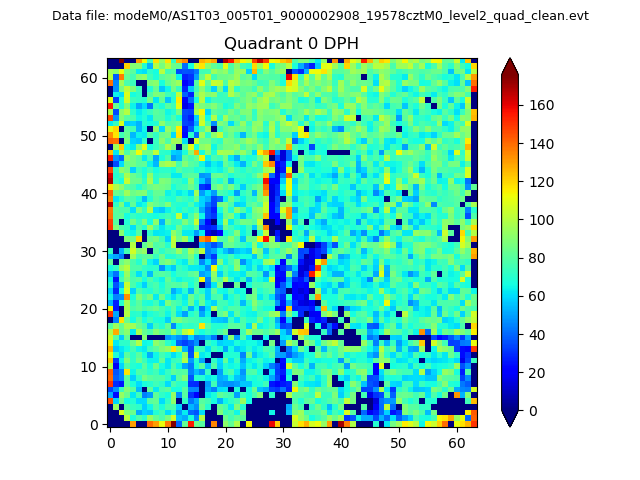 |
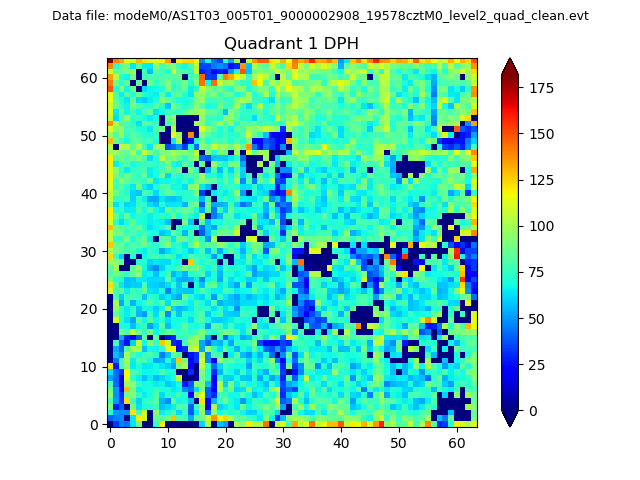 |
Quadrant B |
|---|---|---|---|
| Quadrant D | 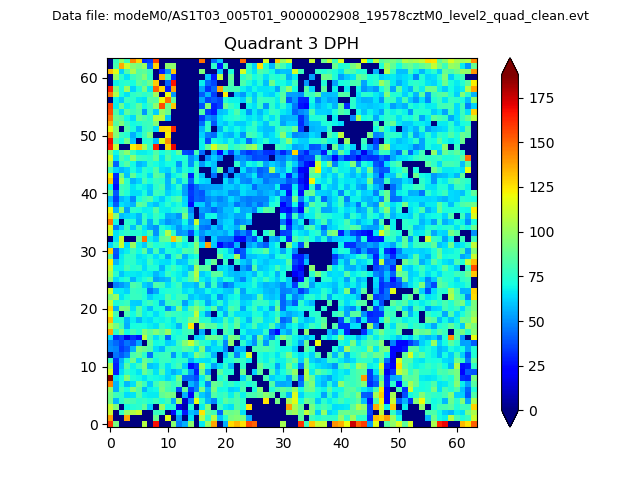 |
 |
Quadrant C |
| Plot type | Count rate plots | Images |
|---|---|---|
| Comparison with Poisson distribution Blue bars denote a histogram of data divided into 1 sec bins. Red curve is a Poisson curve with rate = median count rate of data. |
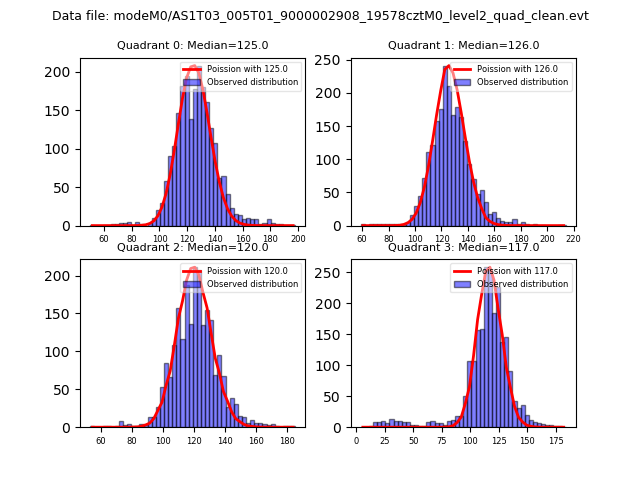 |
 |
| Quadrant-wise count rates Data is divided into 100 sec bins |
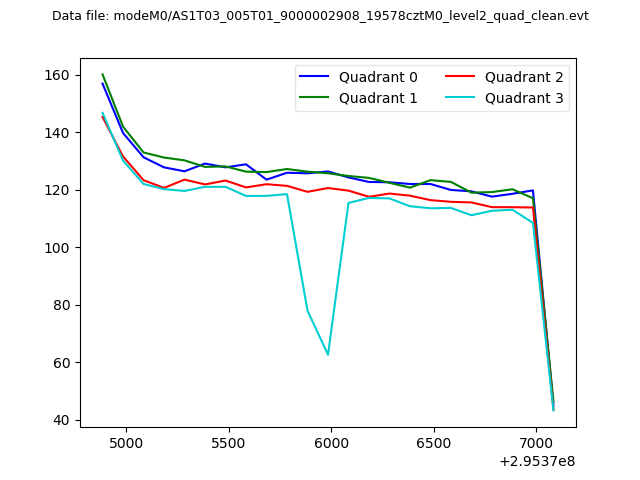 |
|
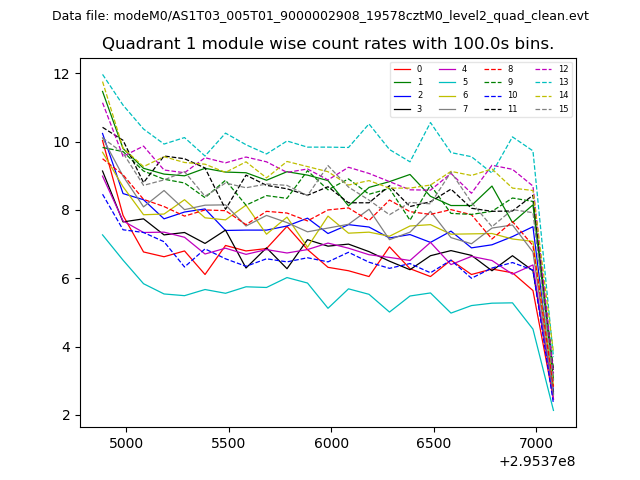
| Module-wise count rates for Quadrant A Data is divided into 100 sec bins |
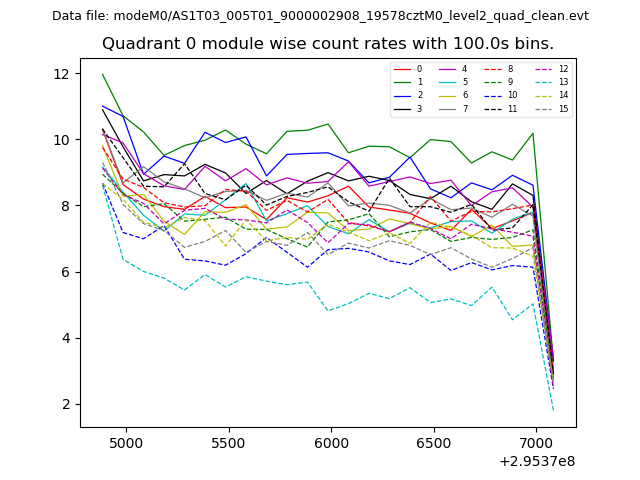 |
 |
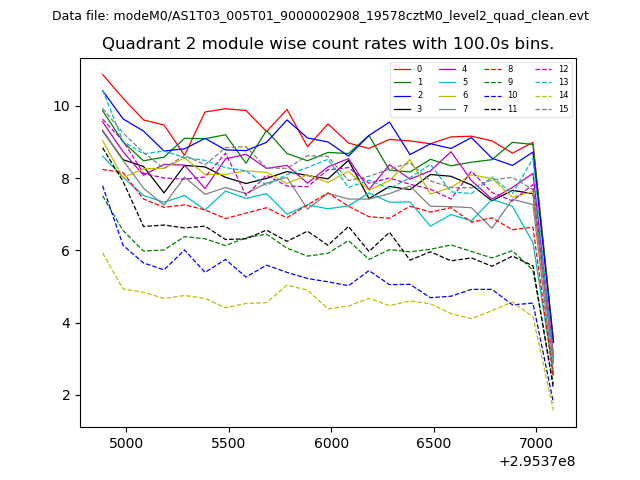
| Module-wise count rates for Quadrant B Data is divided into 100 sec bins |
 |
 |
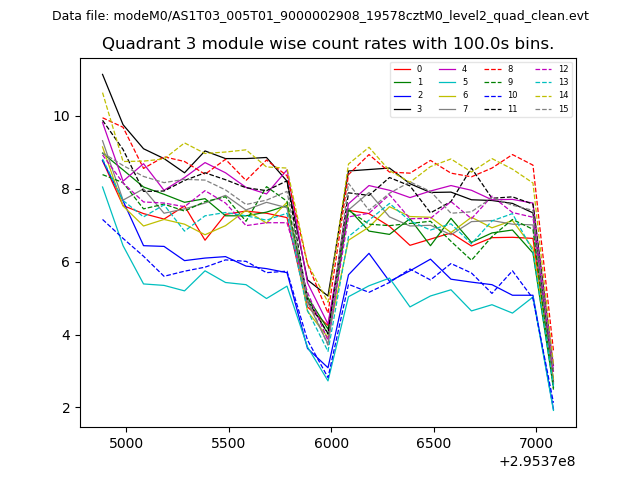
| Module-wise count rates for Quadrant C Data is divided into 100 sec bins |
 |
 |
| Module-wise count rates for Quadrant D Data is divided into 100 sec bins |
 |
 |
| Parameter | Plot |
|---|---|
| CZT HV Monitor | 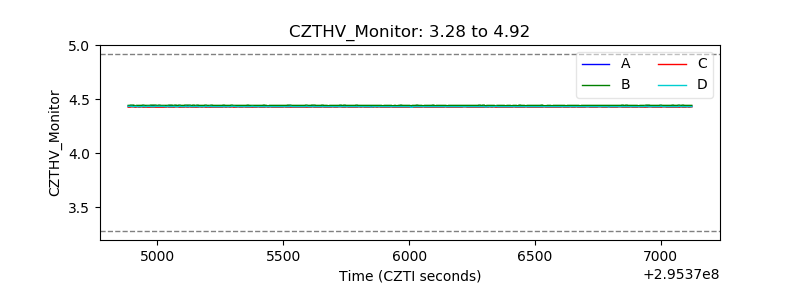 |
| D_VDD | 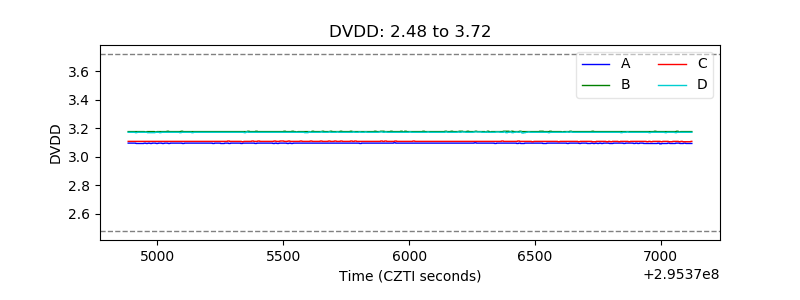 |
| Temperature 1 | 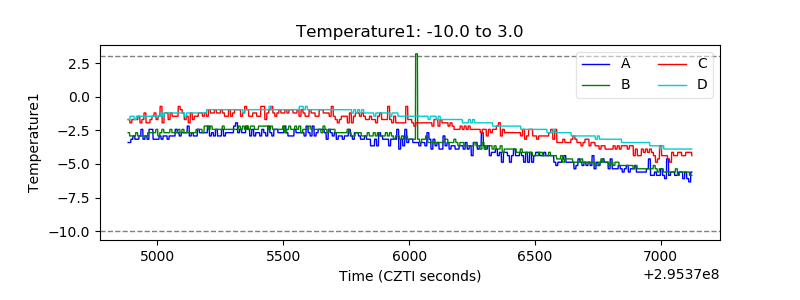 |
| Veto HV Monitor | 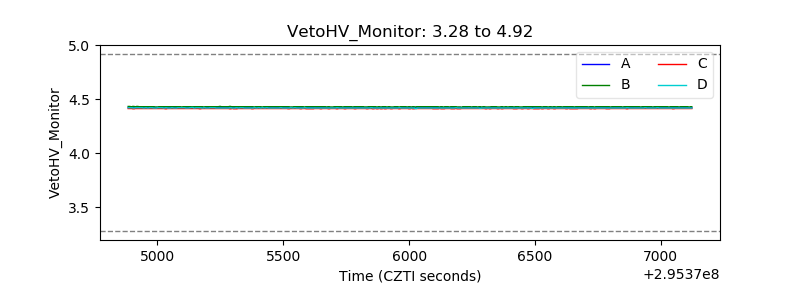 |
| Veto LLD | 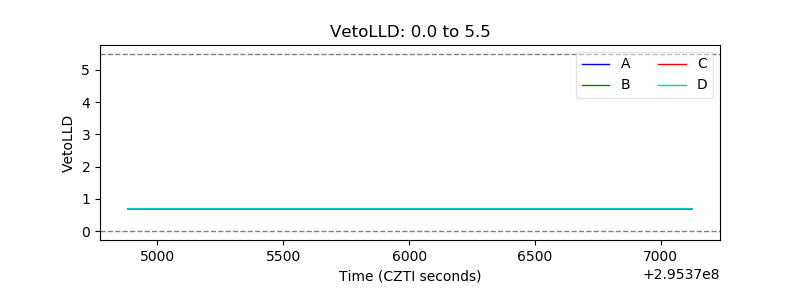 |
| Alpha Counter | 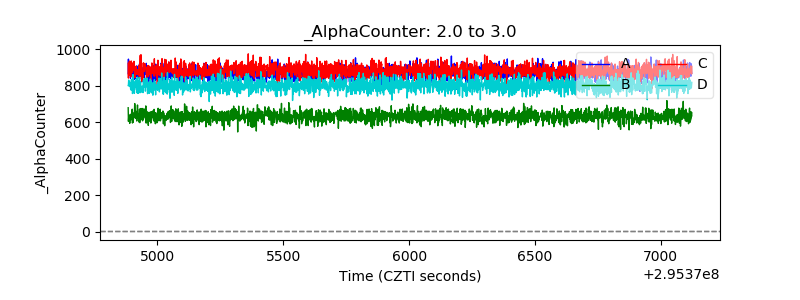 |
| _CPM_Rate | 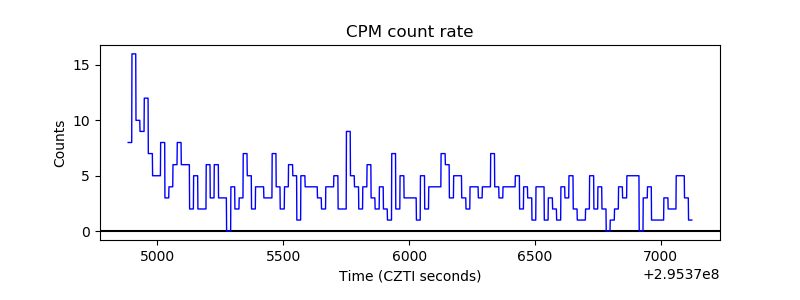 |
| CZT Counter | 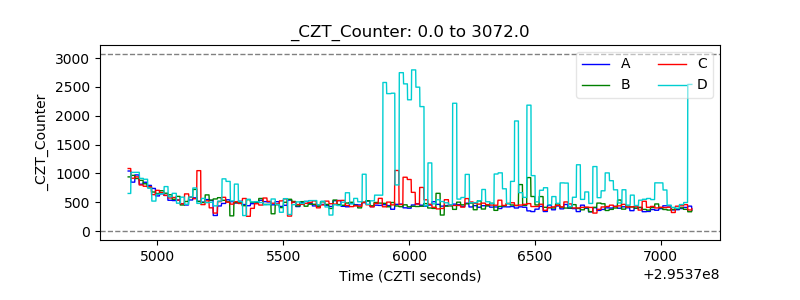 |
| +2.5 Volts monitor |  |
| +5 Volts monitor |  |
| _ROLL_ROT | 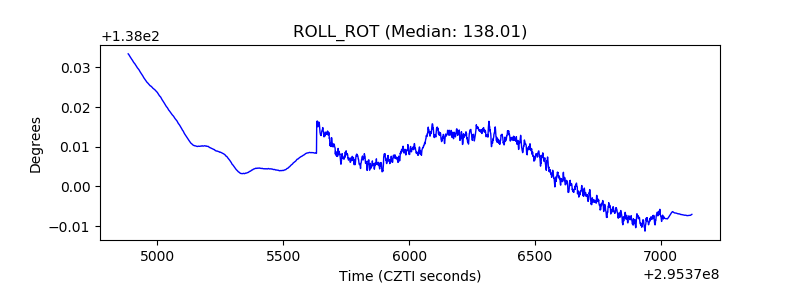 |
| _Roll_DEC | 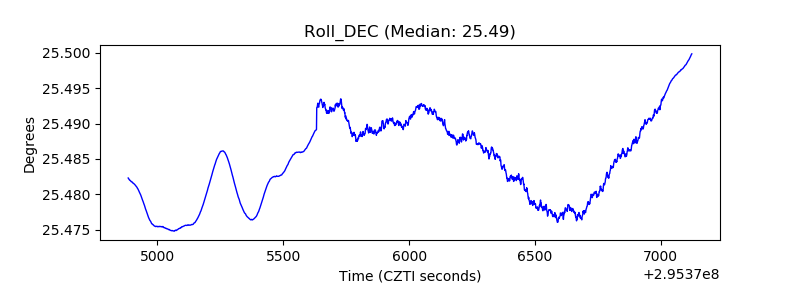 |
| _Roll_RA |  |
| Veto Counter | 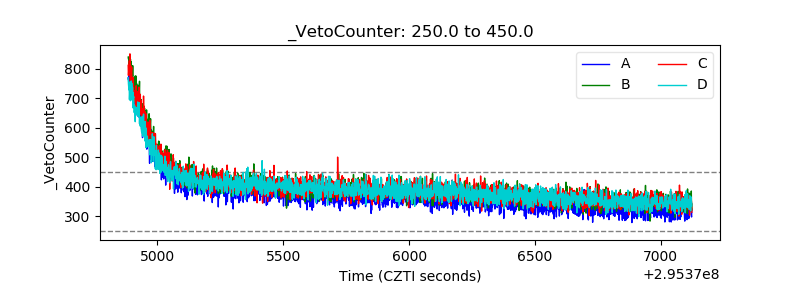 |