| Param | Original file | Final file |
|---|---|---|
| Filename | modeM0/AS1A05_104T08_9000002910cztM0_level2.fits | modeM0/AS1A05_104T08_9000002910cztM0_level2_quad_clean.evt |
| Size (bytes) | 166,783,680 | 135,964,800 |
| Size | 159.1 MB | 129.7 MB |
| Events in quadrant A | 1,011,114 | 759,560 |
| Events in quadrant B | 974,958 | 758,709 |
| Events in quadrant C | 978,426 | 711,598 |
| Events in quadrant D | 845,852 | 645,999 |
| Mode SS | |||
|---|---|---|---|
| Quadrant | BADHDUFLAG | Total packets | Discarded packets |
| A | 0 | 368 | 0 |
| B | 0 | 368 | 0 |
| C | 0 | 368 | 0 |
| D | 0 | 368 | 0 |
| Mode M0 | |||
|---|---|---|---|
| Quadrant | BADHDUFLAG | Total packets | Discarded packets |
| A | 0 | 36715 | 0 |
| B | 0 | 37081 | 0 |
| C | 0 | 37913 | 0 |
| D | 0 | 43930 | 0 |
| Mode M9 | |||
|---|---|---|---|
| Quadrant | BADHDUFLAG | Total packets | Discarded packets |
| A | 0 | 21 | 0 |
| B | 0 | 21 | 0 |
| C | 0 | 21 | 0 |
| D | 0 | 21 | 0 |
| Quadrant | Total seconds | Saturated seconds | Saturation percentage |
|---|---|---|---|
| A | 17995 | 98 | 0.544596% |
| B | 17995 | 115 | 0.639066% |
| C | 17995 | 257 | 1.428174% |
| D | 17995 | 532 | 2.956377% |
Noise dominated data is calculated using 1-second bins in cleaned event files. If a bin has >2000 counts, and if more than 50% of those come from <1% of pixels, then it is considered to be noise-dominated and hence unusable.
| Quadrant | # 1 sec bins | Bins with >0 counts | Bins with >2000 counts | High rate bins dominated by noise | Noise dominated (total time) | Noise dominated (detector-on time) | Marked lightcurve |
|---|---|---|---|---|---|---|---|
| A | 20135 | 17994 | 0 | 0 | 0.00% | 0.00% | 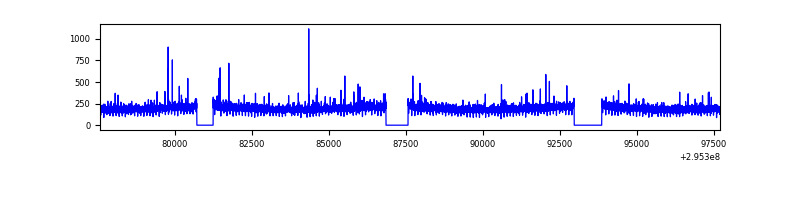 |
| B | 20135 | 17993 | 0 | 0 | 0.00% | 0.00% | 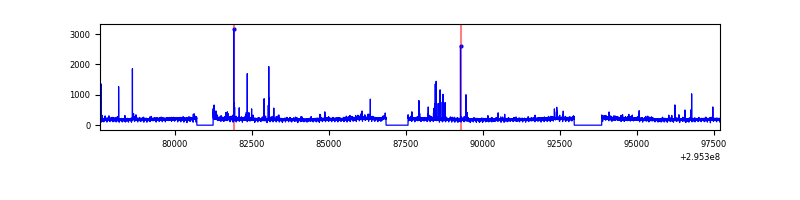 |
| C | 20135 | 17994 | 0 | 0 | 0.00% | 0.00% | 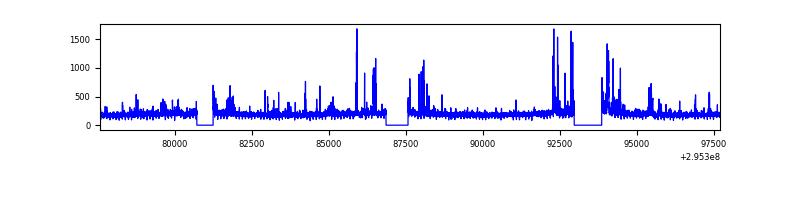 |
| D | 20135 | 17991 | 0 | 0 | 0.00% | 0.00% | 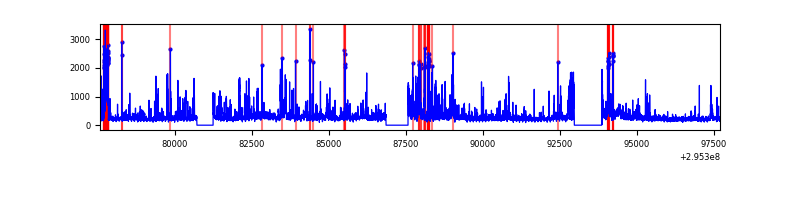 |
Top three noisy pixels from each quadrant. If the there are fewer than three noisy pixels in the level2.evt file, extra rows are filled as -1
| Pixel properties | Quadrant properties | ||||||
|---|---|---|---|---|---|---|---|
| Quadrant | DetID | PixID | Counts | Sigma | Mean | Median | Sigma |
| A | 0 | 29 | 934 | 10.3 | 262 | 245 | 66.9 |
| A | 7 | 110 | 901 | 9.81 | 262 | 245 | 66.9 |
| A | 15 | 236 | 764 | 7.76 | 262 | 245 | 66.9 |
| B | 2 | 9 | 802 | 10.64 | 256 | 244 | 52.4 |
| B | 14 | 254 | 688 | 8.47 | 256 | 244 | 52.4 |
| B | 5 | 232 | 664 | 8.01 | 256 | 244 | 52.4 |
| C | 12 | 241 | 697 | 6.64 | 258 | 240 | 68.8 |
| C | 12 | 249 | 696 | 6.63 | 258 | 240 | 68.8 |
| C | 9 | 209 | 670 | 6.25 | 258 | 240 | 68.8 |
| D | 3 | 14 | 615 | 5.99 | 241 | 220 | 65.9 |
| D | 10 | 189 | 613 | 5.96 | 241 | 220 | 65.9 |
| D | 3 | 159 | 604 | 5.82 | 241 | 220 | 65.9 |
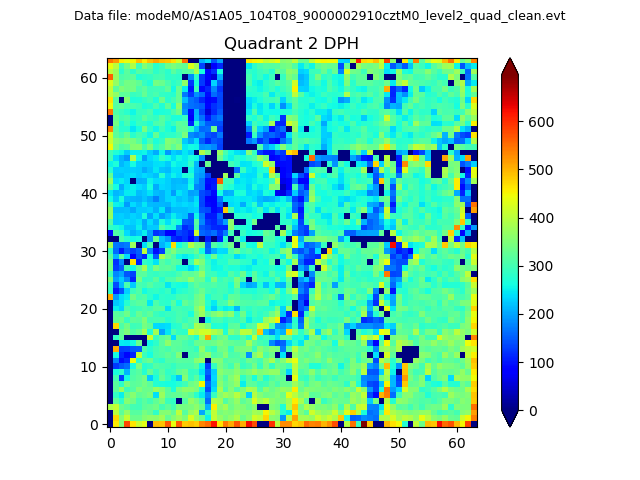
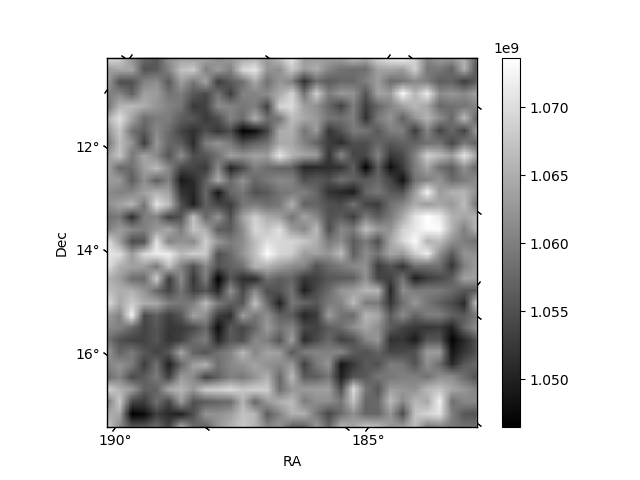
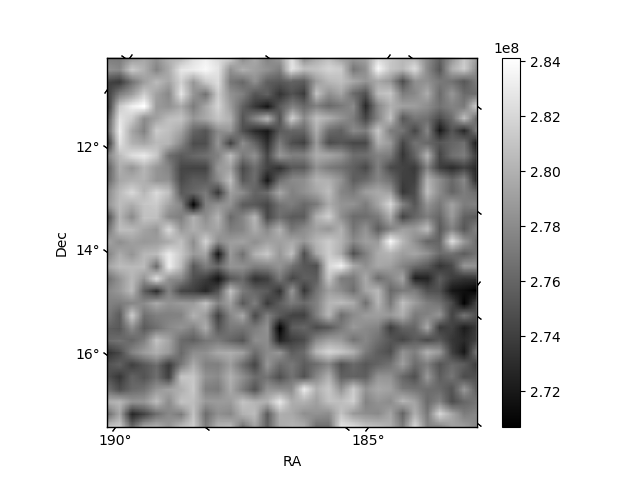
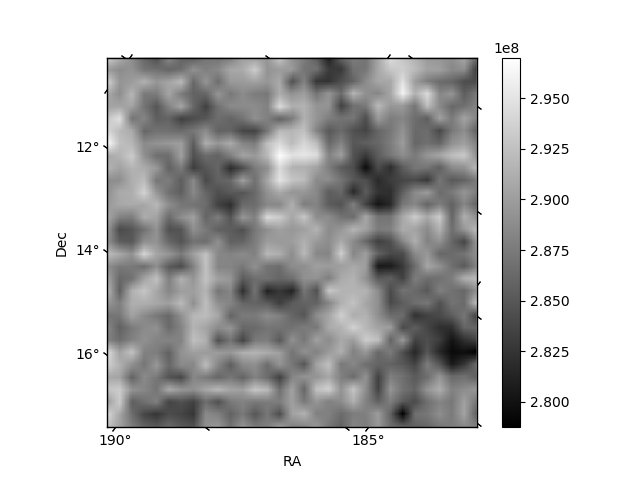
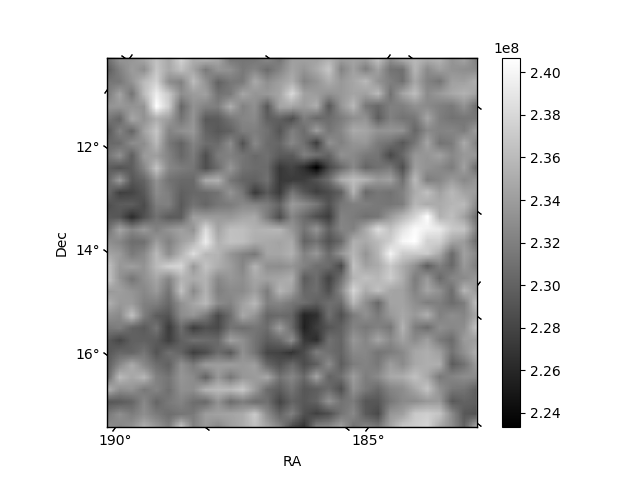
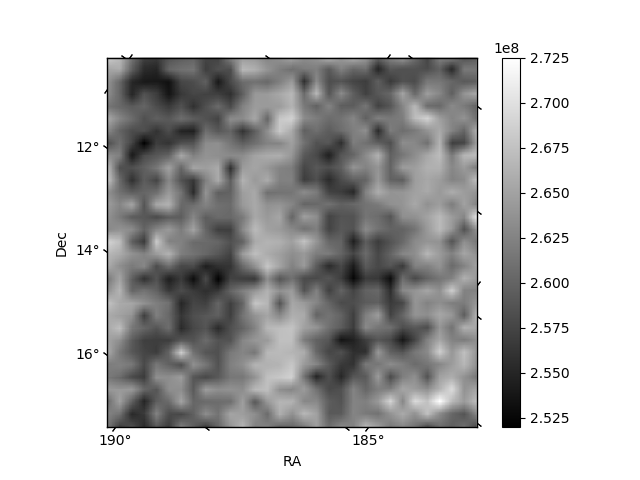
Histogram calculated using DETX and DETY for each event in the final _common_clean file
| Quadrant A | 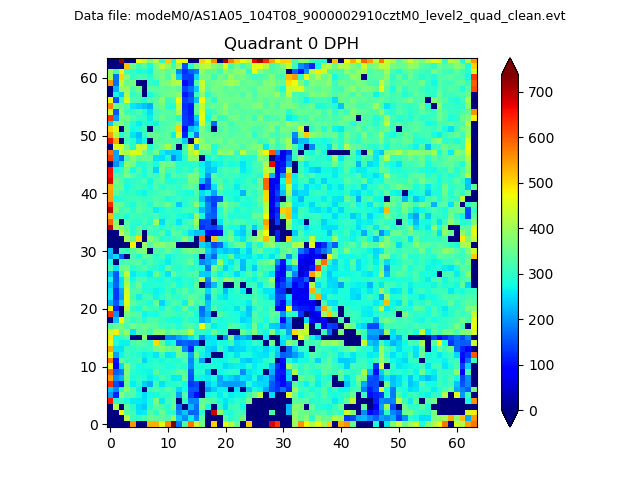 |
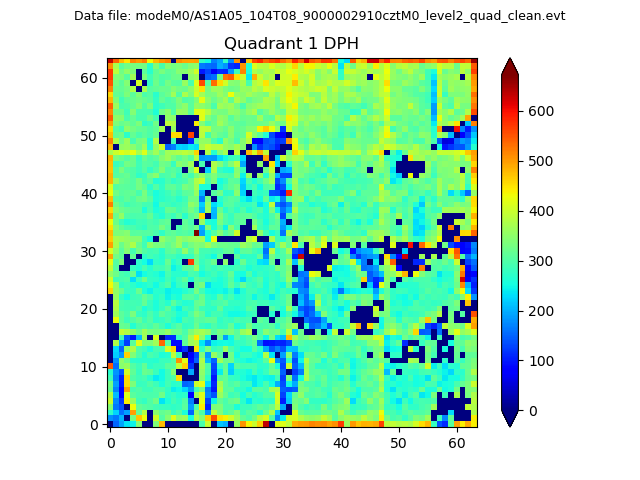 |
Quadrant B |
|---|---|---|---|
| Quadrant D | 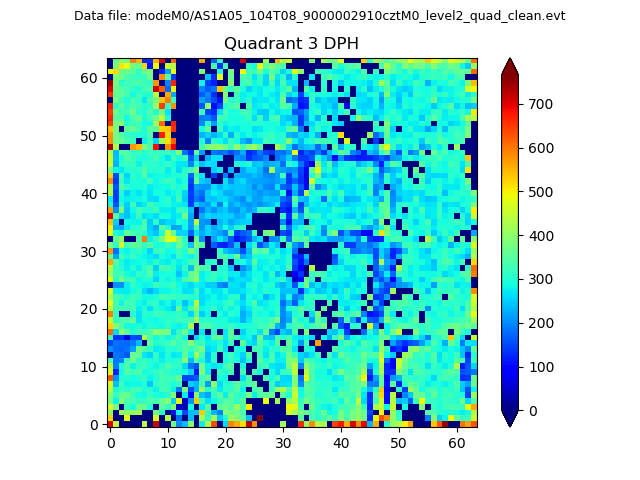 |
 |
Quadrant C |
| Plot type | Count rate plots | Images |
|---|---|---|
| Comparison with Poisson distribution Blue bars denote a histogram of data divided into 1 sec bins. Red curve is a Poisson curve with rate = median count rate of data. |
 |
 |
| Quadrant-wise count rates Data is divided into 100 sec bins |
 |
|
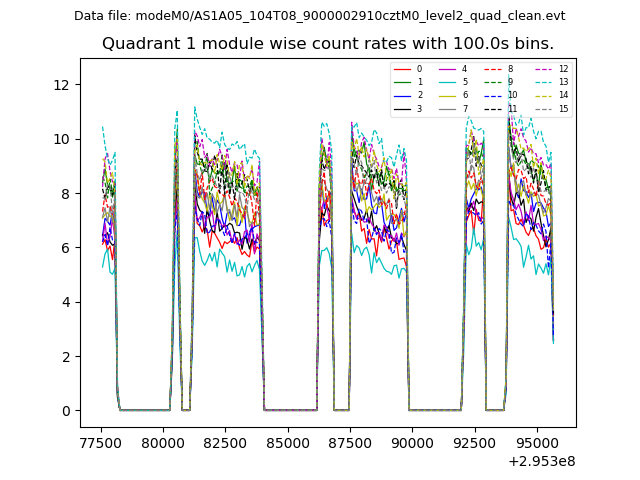
| Module-wise count rates for Quadrant A Data is divided into 100 sec bins |
 |
 |
| Module-wise count rates for Quadrant B Data is divided into 100 sec bins |
 |
 |
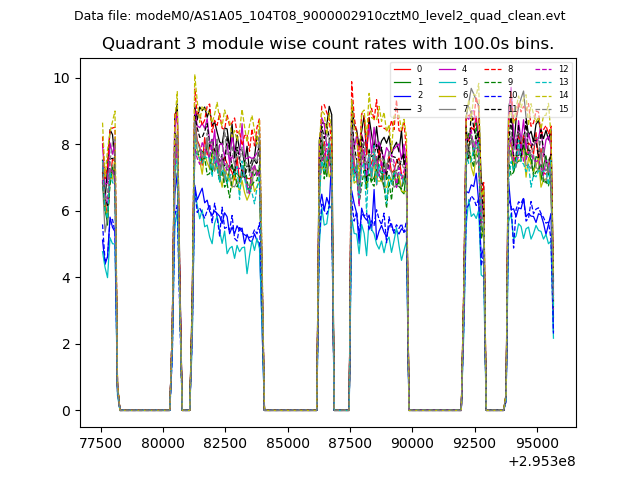
| Module-wise count rates for Quadrant C Data is divided into 100 sec bins |
 |
 |
| Module-wise count rates for Quadrant D Data is divided into 100 sec bins |
 |
 |
| Parameter | Plot |
|---|---|
| CZT HV Monitor |  |
| D_VDD | 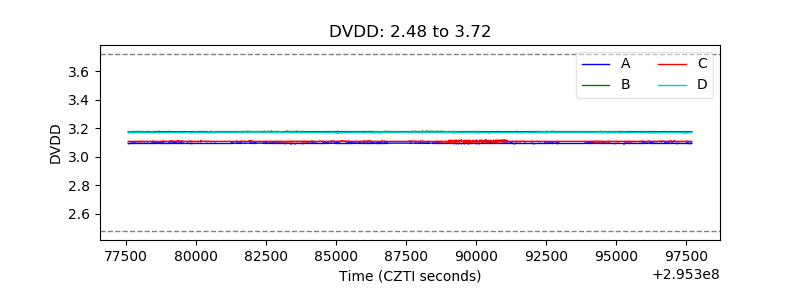 |
| Temperature 1 | 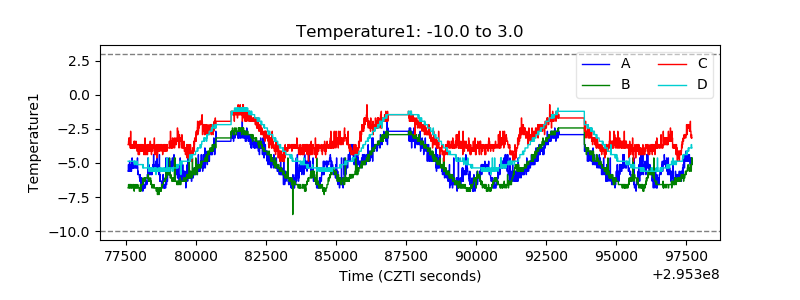 |
| Veto HV Monitor | 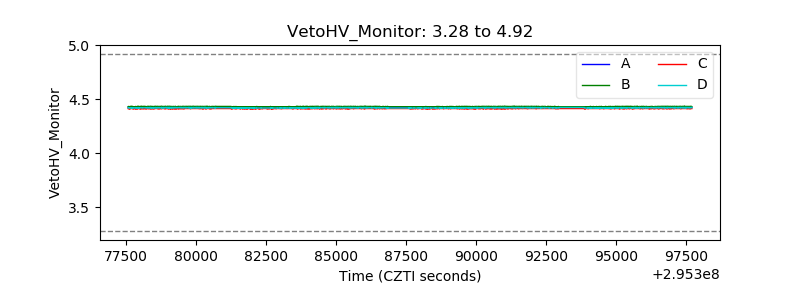 |
| Veto LLD | 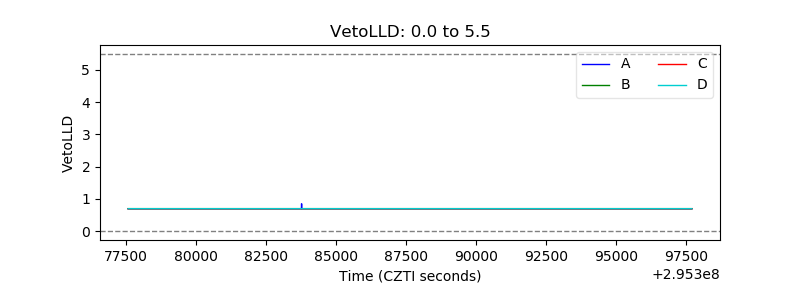 |
| Alpha Counter |  |
| _CPM_Rate | 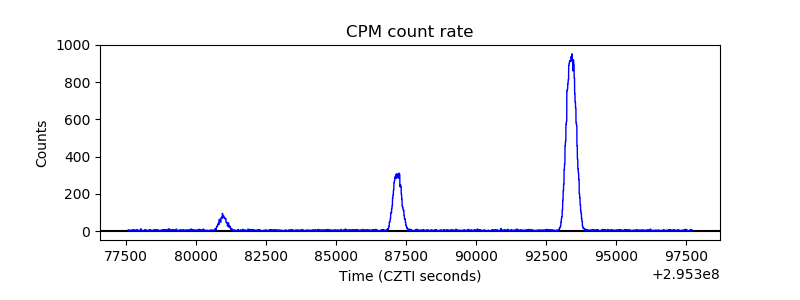 |
| CZT Counter | 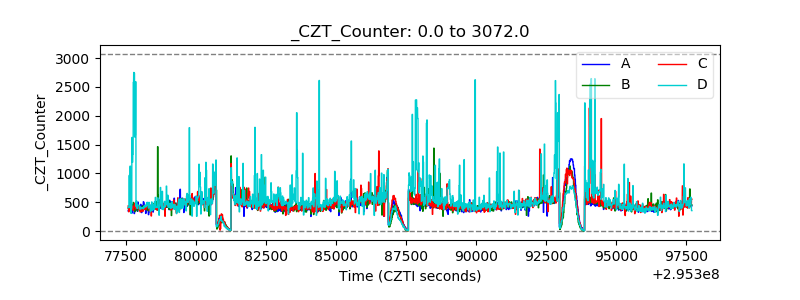 |
| +2.5 Volts monitor |  |
| +5 Volts monitor |  |
| _ROLL_ROT | 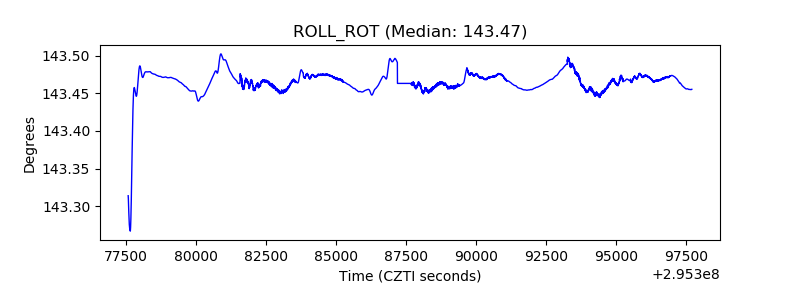 |
| _Roll_DEC | 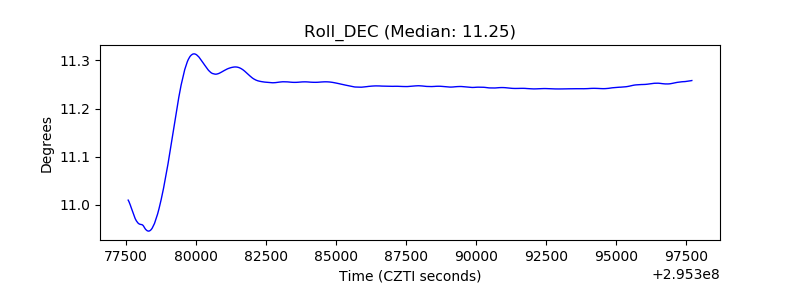 |
| _Roll_RA | 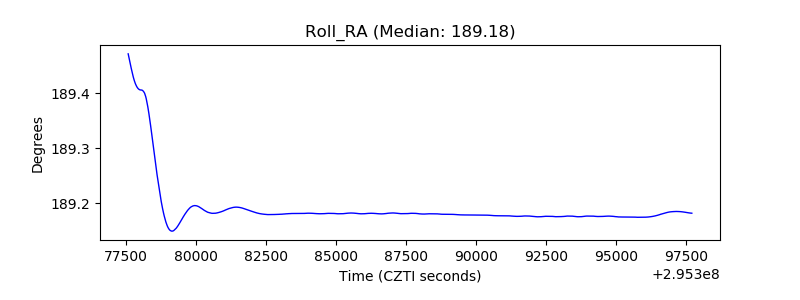 |
| Veto Counter | 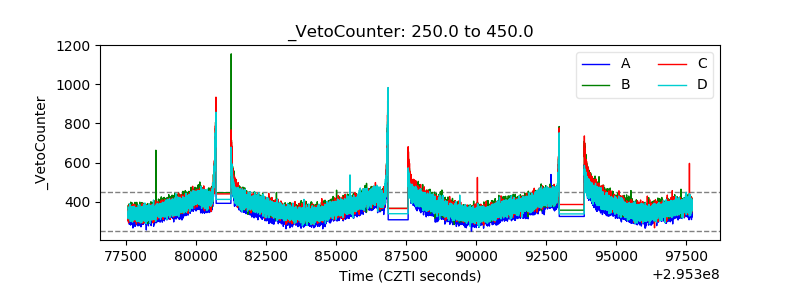 |