| Param | Original file | Final file |
|---|---|---|
| Filename | modeM0/AS1A05_104T08_9000002910_19581cztM0_level2.evt | modeM0/AS1A05_104T08_9000002910_19581cztM0_level2_quad_clean.evt |
| Size (bytes) | 250,346,880 | 39,931,200 |
| Size | 238.7 MB | 38.1 MB |
| Events in quadrant A | 1,673,976 | 241,728 |
| Events in quadrant B | 1,718,218 | 243,481 |
| Events in quadrant C | 1,865,960 | 229,495 |
| Events in quadrant D | 2,060,536 | 222,342 |
| Mode SS | |||
|---|---|---|---|
| Quadrant | BADHDUFLAG | Total packets | Discarded packets |
| A | 0 | 78 | 0 |
| B | 0 | 78 | 0 |
| C | 0 | 78 | 0 |
| D | 0 | 78 | 0 |
| Mode M0 | |||
|---|---|---|---|
| Quadrant | BADHDUFLAG | Total packets | Discarded packets |
| A | 0 | 7719 | 1 |
| B | 0 | 7758 | 1 |
| C | 0 | 8232 | 1 |
| D | 0 | 8949 | 1 |
| Mode M9 | |||
|---|---|---|---|
| Quadrant | BADHDUFLAG | Total packets | Discarded packets |
| A | 0 | 2 | 0 |
| B | 0 | 3 | 0 |
| C | 0 | 3 | 0 |
| D | 0 | 3 | 0 |
| Quadrant | Total seconds | Saturated seconds | Saturation percentage |
|---|---|---|---|
| A | 3842 | 5 | 0.130141% |
| B | 3842 | 3 | 0.078084% |
| C | 3842 | 44 | 1.145237% |
| D | 3842 | 76 | 1.978136% |
Noise dominated data is calculated using 1-second bins in cleaned event files. If a bin has >2000 counts, and if more than 50% of those come from <1% of pixels, then it is considered to be noise-dominated and hence unusable.
| Quadrant | # 1 sec bins | Bins with >0 counts | Bins with >2000 counts | High rate bins dominated by noise | Noise dominated (total time) | Noise dominated (detector-on time) | Marked lightcurve |
|---|---|---|---|---|---|---|---|
| A | 3842 | 3842 | 0 | 0 | 0.00% | 0.00% |  |
| B | 3842 | 3842 | 0 | 0 | 0.00% | 0.00% |  |
| C | 3842 | 3842 | 7 | 7 | 0.18% | 0.18% | 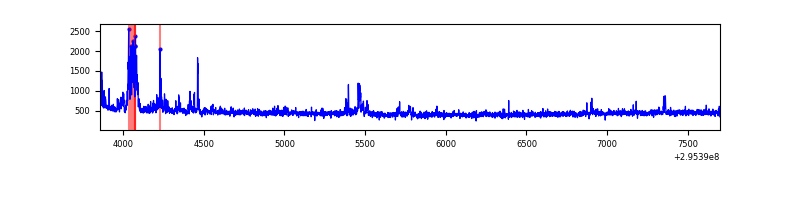 |
| D | 3842 | 3842 | 58 | 58 | 1.51% | 1.51% | 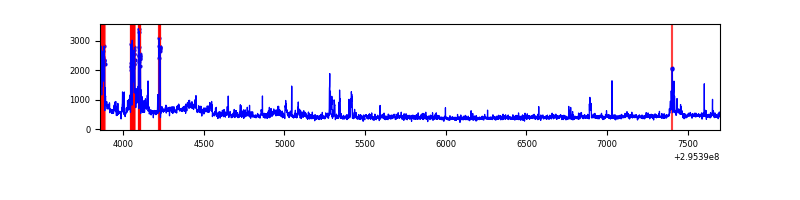 |
Top three noisy pixels from each quadrant. If the there are fewer than three noisy pixels in the level2.evt file, extra rows are filled as -1
| Pixel properties | Quadrant properties | ||||||
|---|---|---|---|---|---|---|---|
| Quadrant | DetID | PixID | Counts | Sigma | Mean | Median | Sigma |
| A | 13 | 254 | 6083 | 63.85 | 433 | 423 | 88.7 |
| A | 0 | 226 | 3661 | 36.52 | 433 | 423 | 88.7 |
| A | 3 | 137 | 3571 | 35.51 | 433 | 423 | 88.7 |
| B | 12 | 111 | 10333 | 117.61 | 435 | 425 | 84.2 |
| B | 11 | 111 | 8926 | 100.91 | 435 | 425 | 84.2 |
| B | 14 | 111 | 7993 | 89.83 | 435 | 425 | 84.2 |
| C | 3 | 233 | 176523 | 1789.37 | 414 | 418 | 98.4 |
| C | 14 | 238 | 64438 | 650.5 | 414 | 418 | 98.4 |
| C | 9 | 221 | 5342 | 50.03 | 414 | 418 | 98.4 |
| D | 1 | 52 | 155637 | 1532.57 | 413 | 401 | 101.3 |
| D | 7 | 238 | 128519 | 1264.84 | 413 | 401 | 101.3 |
| D | 12 | 218 | 122567 | 1206.08 | 413 | 401 | 101.3 |
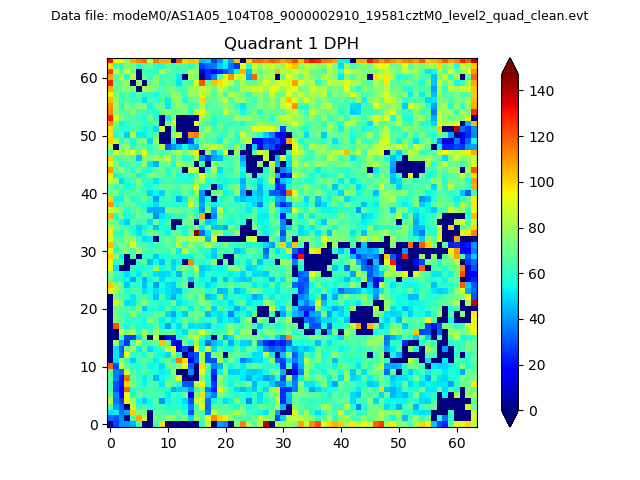
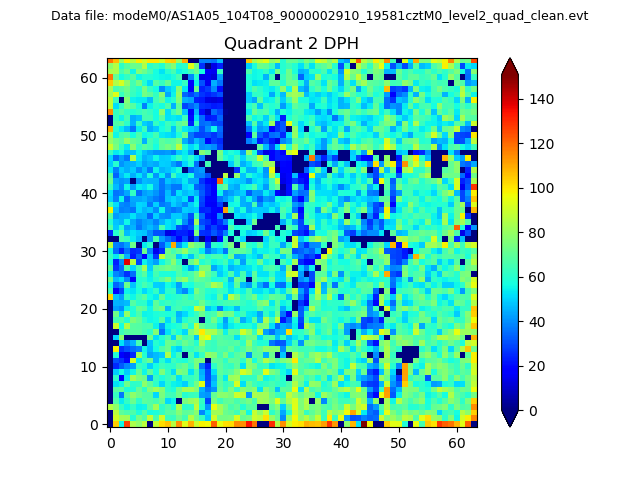
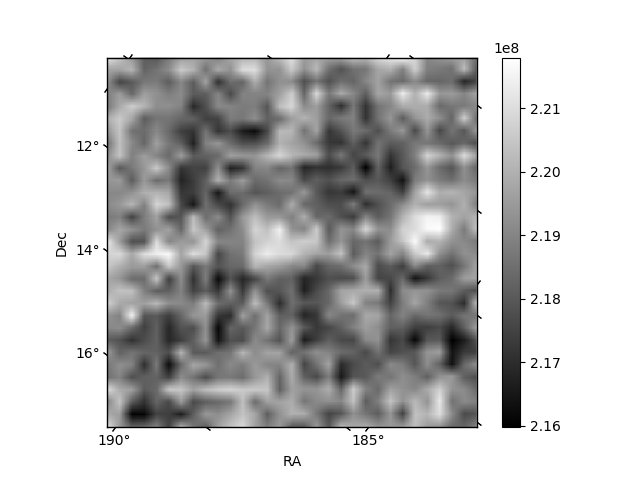
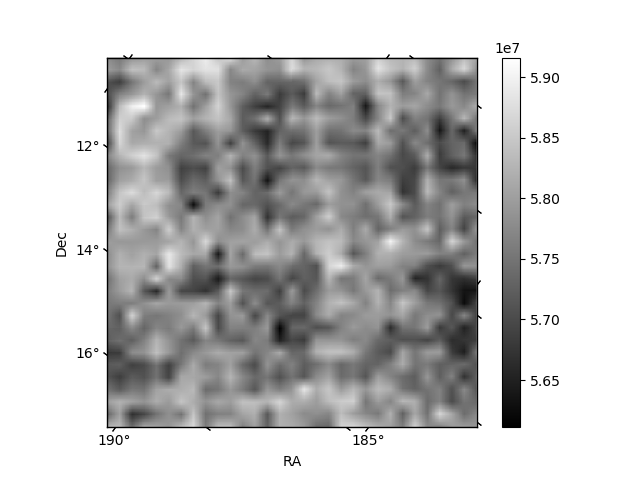
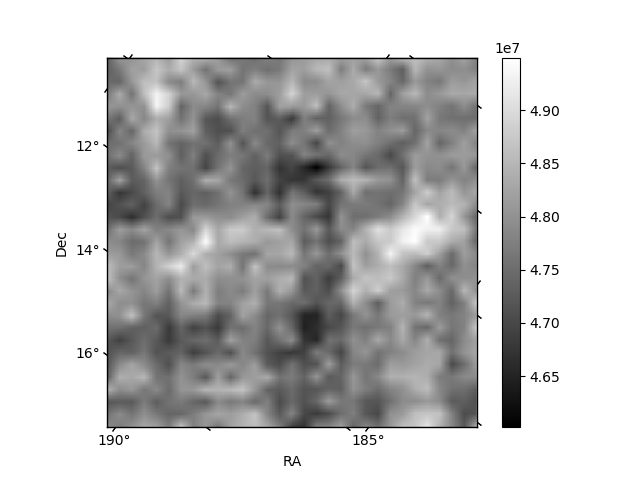
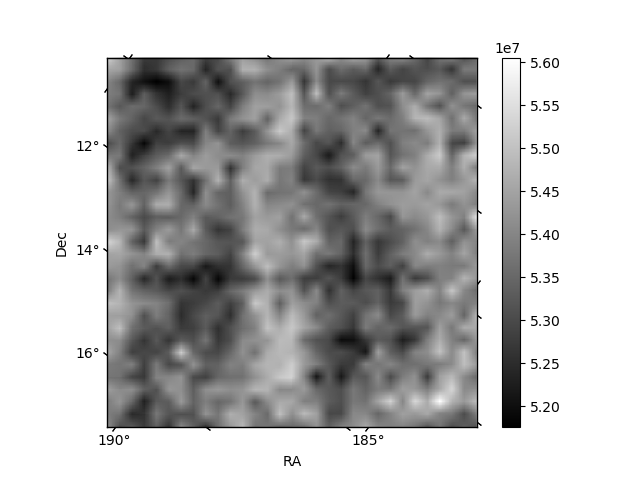
Histogram calculated using DETX and DETY for each event in the final _common_clean file
| Quadrant A |  |
 |
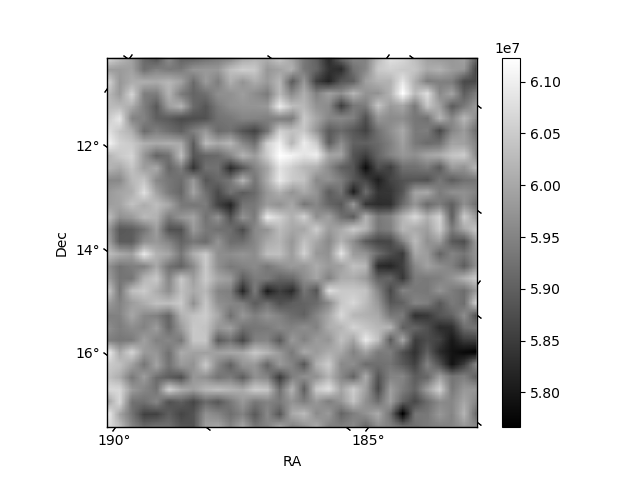
Quadrant B |
|---|---|---|---|
| Quadrant D |  |
 |
Quadrant C |
| Plot type | Count rate plots | Images |
|---|---|---|
| Comparison with Poisson distribution Blue bars denote a histogram of data divided into 1 sec bins. Red curve is a Poisson curve with rate = median count rate of data. |
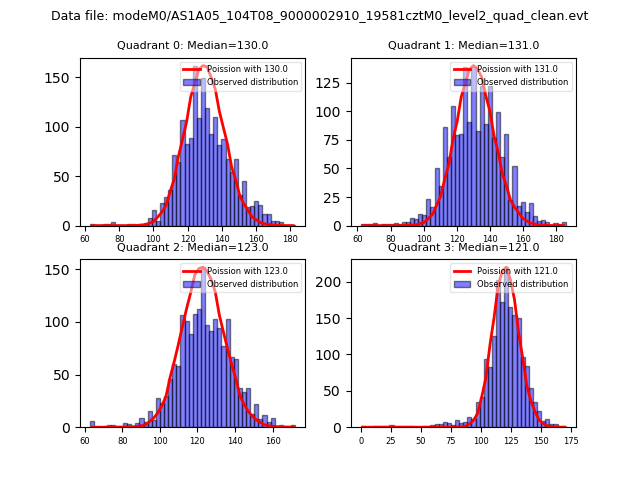 |
 |
| Quadrant-wise count rates Data is divided into 100 sec bins |
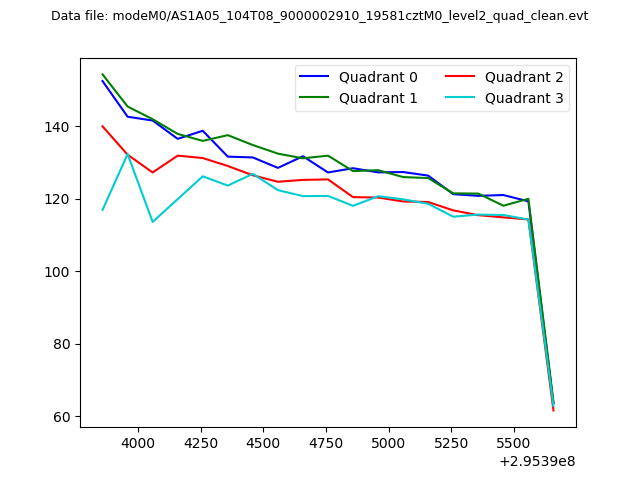 |
|
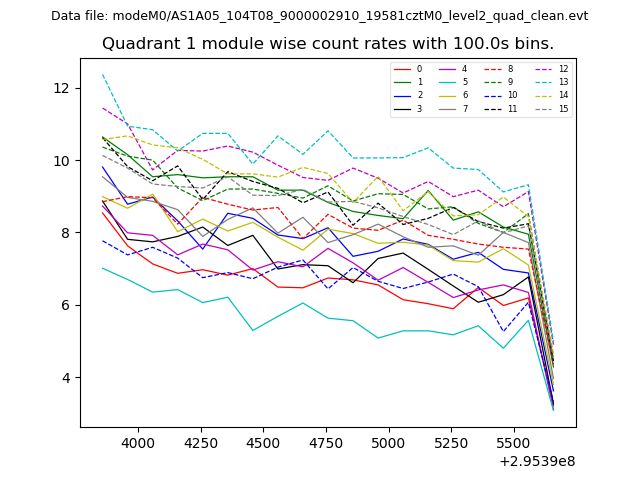
| Module-wise count rates for Quadrant A Data is divided into 100 sec bins |
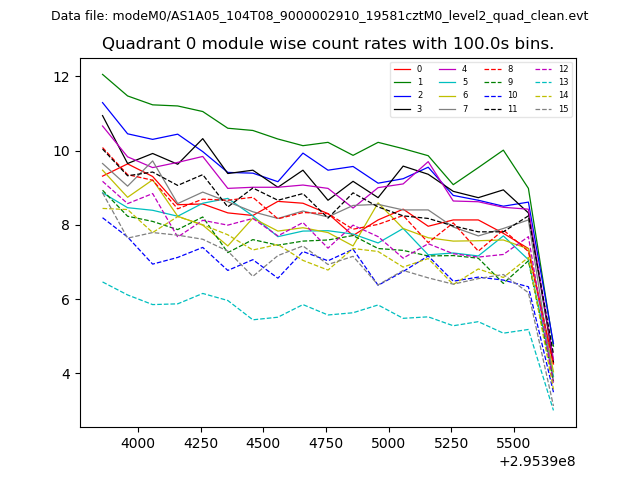 |
 |
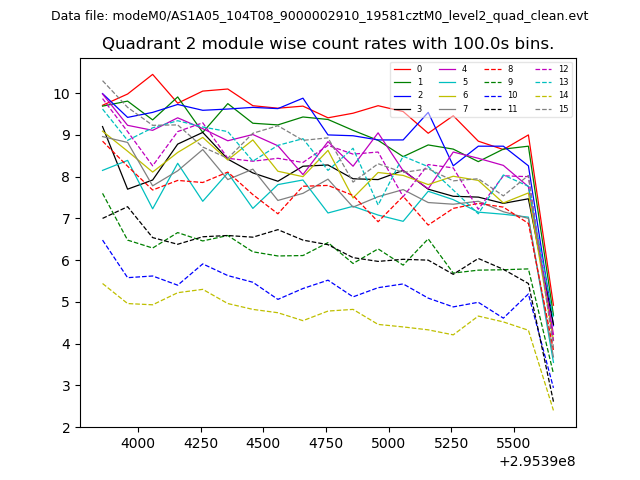
| Module-wise count rates for Quadrant B Data is divided into 100 sec bins |
 |
 |
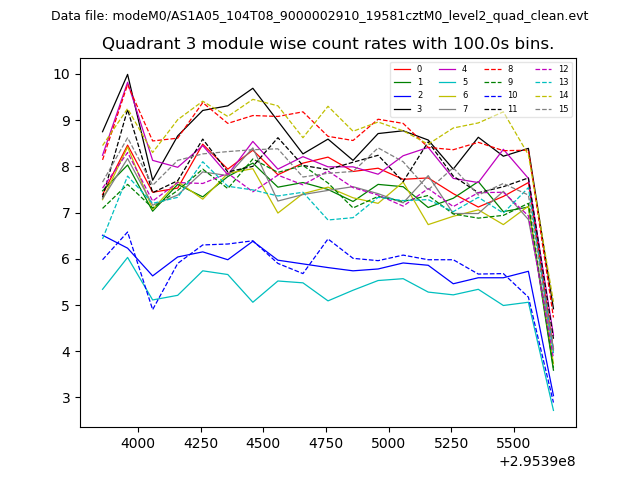
| Module-wise count rates for Quadrant C Data is divided into 100 sec bins |
 |
 |
| Module-wise count rates for Quadrant D Data is divided into 100 sec bins |
 |
 |
| Parameter | Plot |
|---|---|
| CZT HV Monitor | 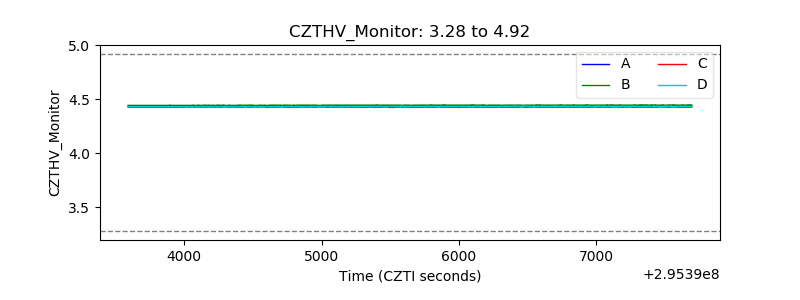 |
| D_VDD | 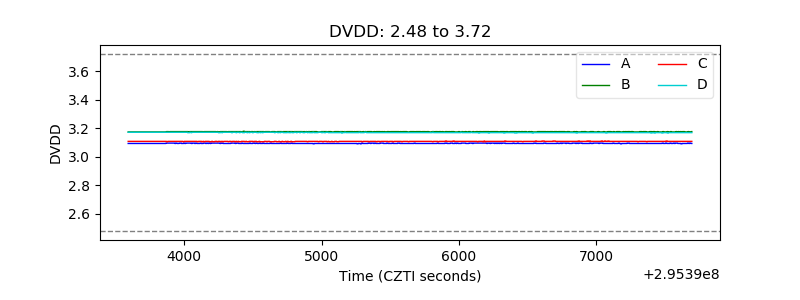 |
| Temperature 1 | 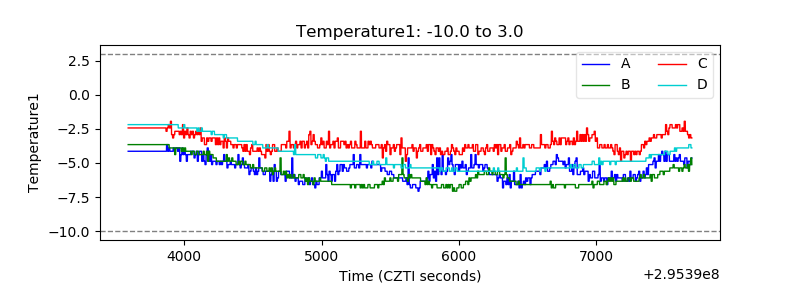 |
| Veto HV Monitor | 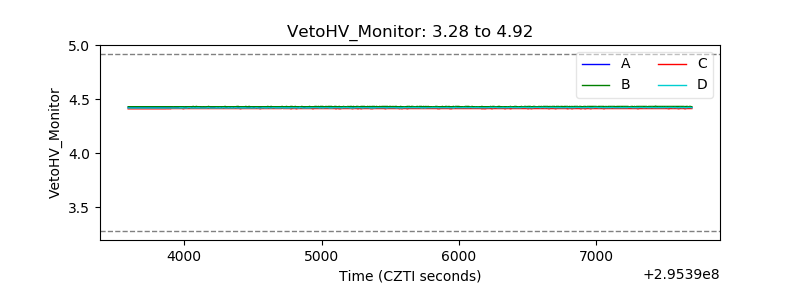 |
| Veto LLD | 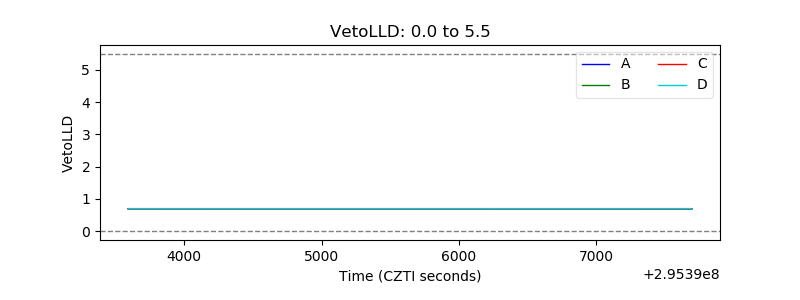 |
| Alpha Counter | 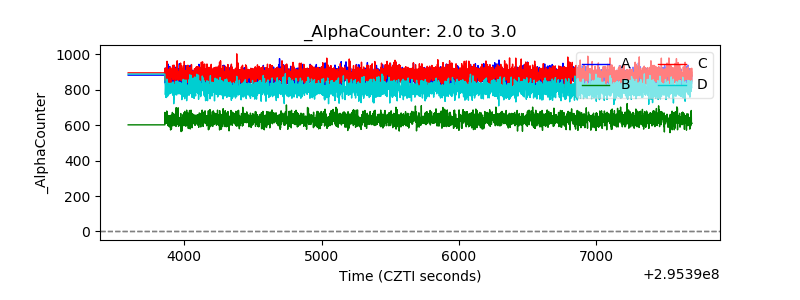 |
| _CPM_Rate | 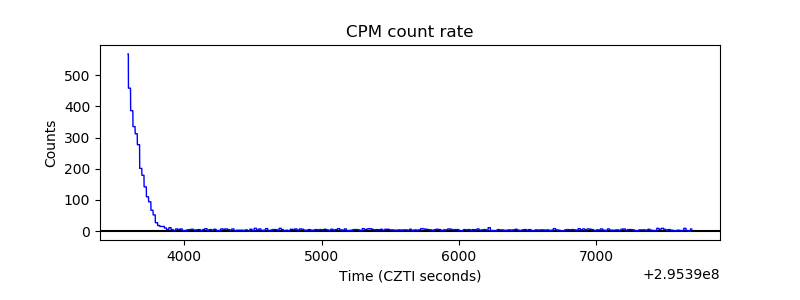 |
| CZT Counter | 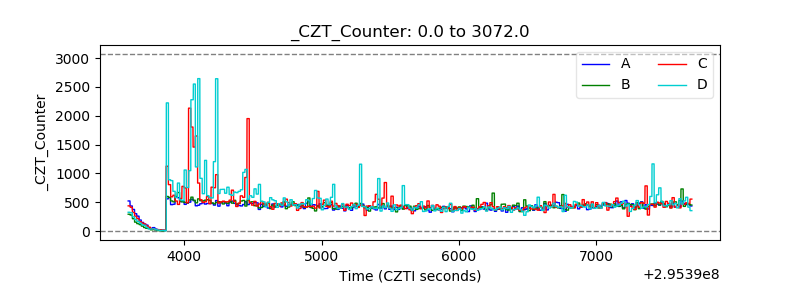 |
| +2.5 Volts monitor |  |
| +5 Volts monitor |  |
| _ROLL_ROT | 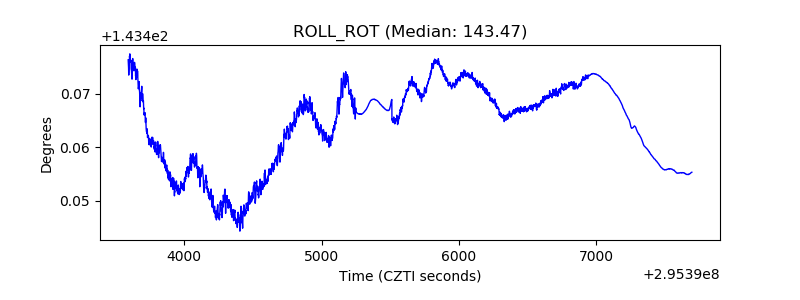 |
| _Roll_DEC | 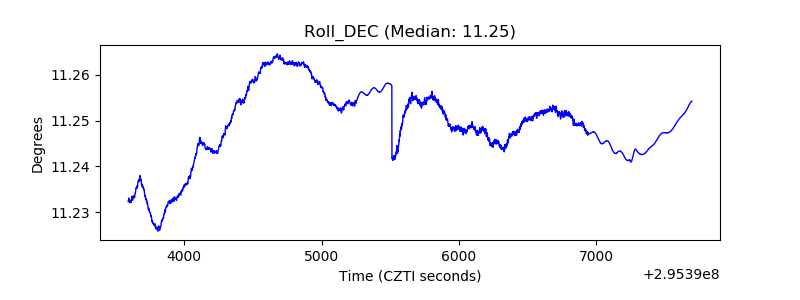 |
| _Roll_RA | 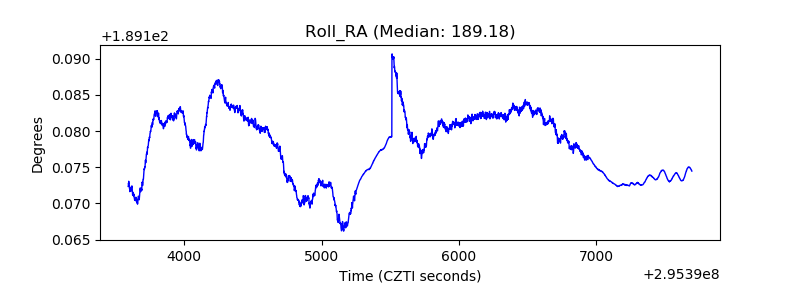 |
| Veto Counter | 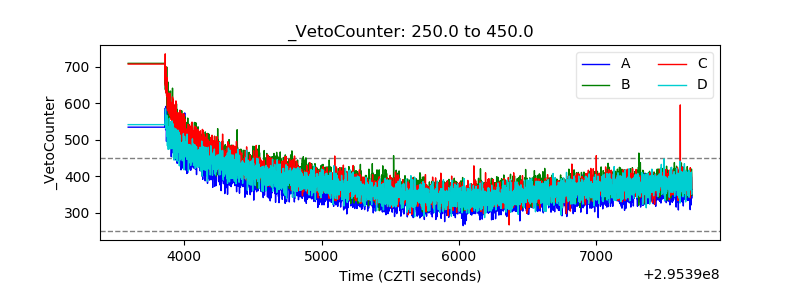 |