| Param | Original file | Final file |
|---|---|---|
| Filename | modeM0/AS1T03_037T01_9000002912cztM0_level2.fits | modeM0/AS1T03_037T01_9000002912cztM0_level2_quad_clean.evt |
| Size (bytes) | 307,918,080 | 183,456,000 |
| Size | 293.7 MB | 175.0 MB |
| Events in quadrant A | 1,925,324 | 920,776 |
| Events in quadrant B | 1,846,160 | 923,136 |
| Events in quadrant C | 1,909,216 | 887,295 |
| Events in quadrant D | 1,601,896 | 780,177 |
| Mode M9 | |||
|---|---|---|---|
| Quadrant | BADHDUFLAG | Total packets | Discarded packets |
| A | 0 | 72 | 0 |
| B | 0 | 72 | 0 |
| C | 0 | 72 | 0 |
| D | 0 | 72 | 0 |
| Mode M0 | |||
|---|---|---|---|
| Quadrant | BADHDUFLAG | Total packets | Discarded packets |
| A | 0 | 62616 | 0 |
| B | 0 | 64006 | 0 |
| C | 0 | 63071 | 0 |
| D | 0 | 87822 | 0 |
| Mode SS | |||
|---|---|---|---|
| Quadrant | BADHDUFLAG | Total packets | Discarded packets |
| A | 0 | 606 | 0 |
| B | 0 | 606 | 0 |
| C | 0 | 606 | 0 |
| D | 0 | 606 | 0 |
| Quadrant | Total seconds | Saturated seconds | Saturation percentage |
|---|---|---|---|
| A | 29717 | 210 | 0.706666% |
| B | 29717 | 304 | 1.022983% |
| C | 29717 | 419 | 1.409967% |
| D | 29717 | 2133 | 7.177710% |
Noise dominated data is calculated using 1-second bins in cleaned event files. If a bin has >2000 counts, and if more than 50% of those come from <1% of pixels, then it is considered to be noise-dominated and hence unusable.
| Quadrant | # 1 sec bins | Bins with >0 counts | Bins with >2000 counts | High rate bins dominated by noise | Noise dominated (total time) | Noise dominated (detector-on time) | Marked lightcurve |
|---|---|---|---|---|---|---|---|
| A | 36957 | 29717 | 0 | 0 | 0.00% | 0.00% |  |
| B | 36957 | 29717 | 0 | 0 | 0.00% | 0.00% |  |
| C | 36957 | 29714 | 0 | 0 | 0.00% | 0.00% |  |
| D | 36957 | 29656 | 0 | 0 | 0.00% | 0.00% |  |
Top three noisy pixels from each quadrant. If the there are fewer than three noisy pixels in the level2.evt file, extra rows are filled as -1
| Pixel properties | Quadrant properties | ||||||
|---|---|---|---|---|---|---|---|
| Quadrant | DetID | PixID | Counts | Sigma | Mean | Median | Sigma |
| A | 0 | 29 | 1775 | 10.47 | 502 | 474 | 124.2 |
| A | 7 | 110 | 1532 | 8.52 | 502 | 474 | 124.2 |
| A | 0 | 30 | 1433 | 7.72 | 502 | 474 | 124.2 |
| B | 2 | 9 | 1471 | 10.55 | 488 | 469 | 95.0 |
| B | 5 | 128 | 1306 | 8.81 | 488 | 469 | 95.0 |
| B | 2 | 8 | 1220 | 7.91 | 488 | 469 | 95.0 |
| C | 1 | 81 | 1474 | 7.68 | 504 | 478 | 129.7 |
| C | 1 | 80 | 1390 | 7.03 | 504 | 478 | 129.7 |
| C | 3 | 126 | 1323 | 6.51 | 504 | 478 | 129.7 |
| D | 10 | 189 | 1198 | 6.46 | 458 | 420 | 120.5 |
| D | 7 | 3 | 1180 | 6.31 | 458 | 420 | 120.5 |
| D | 15 | 46 | 1163 | 6.17 | 458 | 420 | 120.5 |
Histogram calculated using DETX and DETY for each event in the final _common_clean file
| Quadrant A | 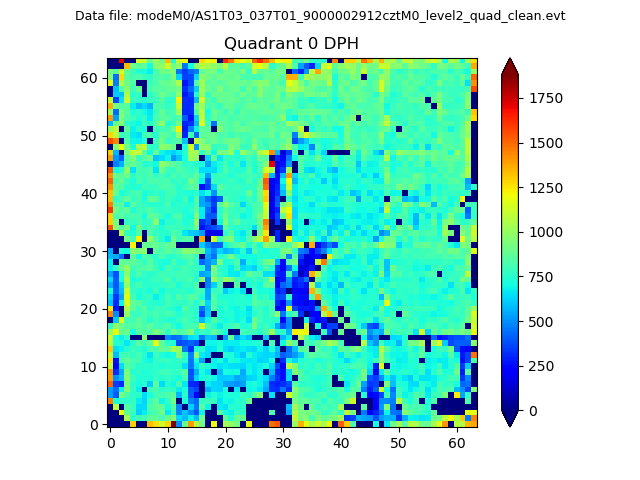 |
 |
Quadrant B |
|---|---|---|---|
| Quadrant D |  |
 |
Quadrant C |
| Plot type | Count rate plots | Images |
|---|---|---|
| Comparison with Poisson distribution Blue bars denote a histogram of data divided into 1 sec bins. Red curve is a Poisson curve with rate = median count rate of data. |
 |
 |
| Quadrant-wise count rates Data is divided into 100 sec bins |
 |
|
| Module-wise count rates for Quadrant A Data is divided into 100 sec bins |
 |
 |
| Module-wise count rates for Quadrant B Data is divided into 100 sec bins |
 |
 |
| Module-wise count rates for Quadrant C Data is divided into 100 sec bins |
 |
 |
| Module-wise count rates for Quadrant D Data is divided into 100 sec bins |
 |
 |
| Parameter | Plot |
|---|---|
| CZT HV Monitor |  |
| D_VDD | 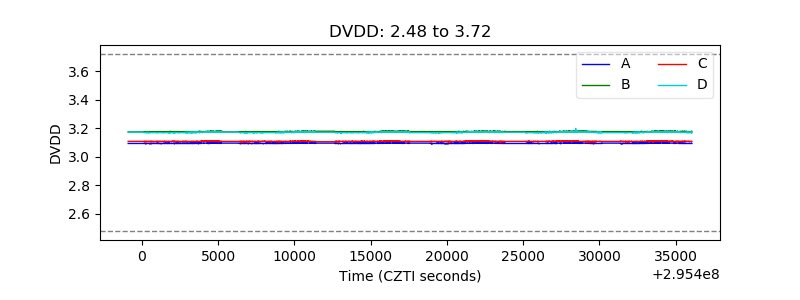 |
| Temperature 1 |  |
| Veto HV Monitor |  |
| Veto LLD |  |
| Alpha Counter | 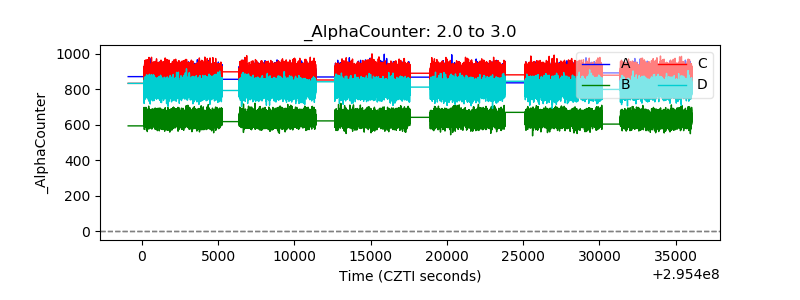 |
| _CPM_Rate | 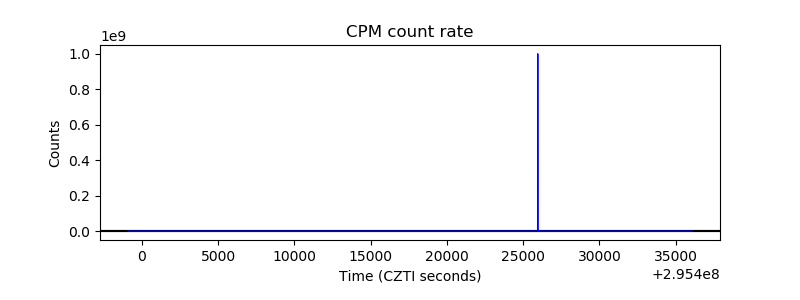 |
| CZT Counter | 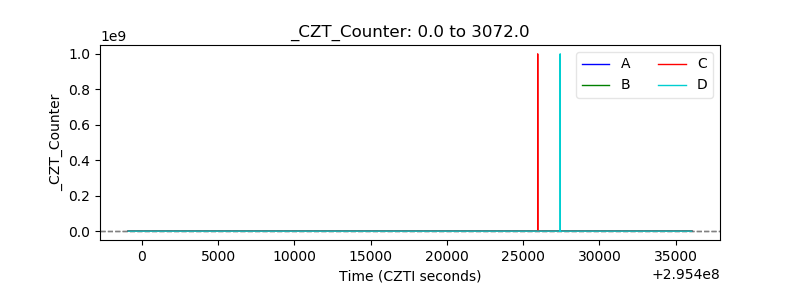 |
| +2.5 Volts monitor |  |
| +5 Volts monitor |  |
| _ROLL_ROT | 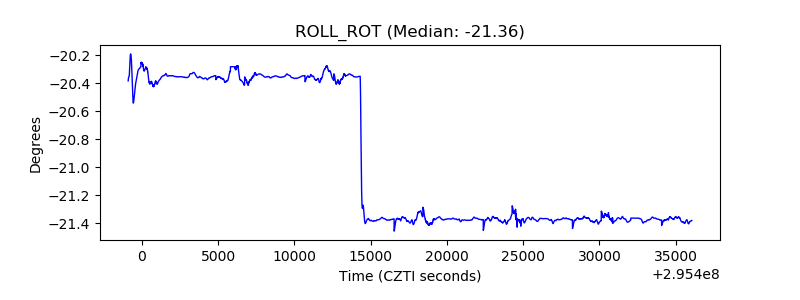 |
| _Roll_DEC |  |
| _Roll_RA | 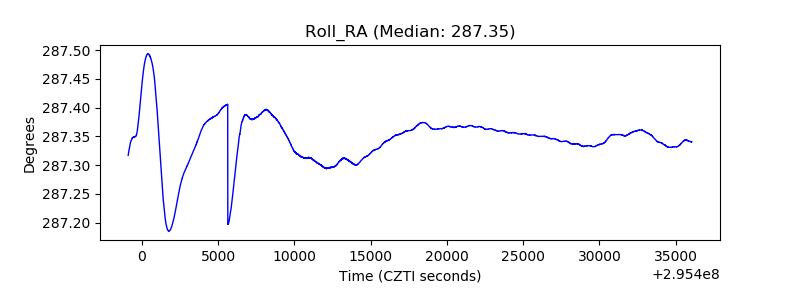 |
| Veto Counter | 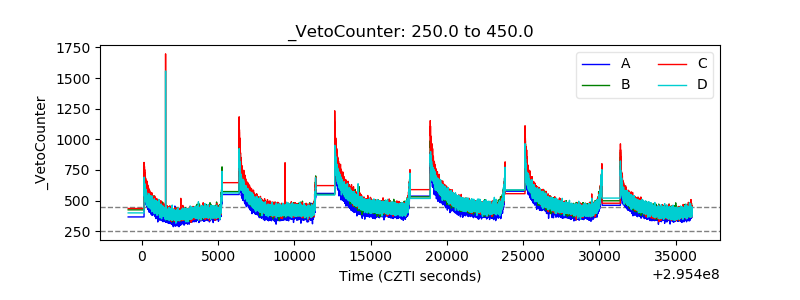 |