| Param | Original file | Final file |
|---|---|---|
| Filename | modeM0/AS1T03_037T01_9000002912_19581cztM0_level2.evt | modeM0/AS1T03_037T01_9000002912_19581cztM0_level2_quad_clean.evt |
| Size (bytes) | 487,117,440 | 104,077,440 |
| Size | 464.6 MB | 99.3 MB |
| Events in quadrant A | 3,049,098 | 683,345 |
| Events in quadrant B | 3,241,729 | 703,923 |
| Events in quadrant C | 3,274,800 | 671,455 |
| Events in quadrant D | 4,746,963 | 641,514 |
| Mode M9 | |||
|---|---|---|---|
| Quadrant | BADHDUFLAG | Total packets | Discarded packets |
| A | 0 | 21 | 0 |
| B | 0 | 21 | 0 |
| C | 0 | 21 | 0 |
| D | 0 | 21 | 0 |
| Mode M0 | |||
|---|---|---|---|
| Quadrant | BADHDUFLAG | Total packets | Discarded packets |
| A | 0 | 13242 | 2 |
| B | 0 | 13801 | 2 |
| C | 0 | 13653 | 2 |
| D | 0 | 18402 | 2 |
| Mode SS | |||
|---|---|---|---|
| Quadrant | BADHDUFLAG | Total packets | Discarded packets |
| A | 0 | 134 | 0 |
| B | 0 | 134 | 0 |
| C | 0 | 134 | 0 |
| D | 0 | 134 | 0 |
| Quadrant | Total seconds | Saturated seconds | Saturation percentage |
|---|---|---|---|
| A | 6477 | 22 | 0.339663% |
| B | 6476 | 53 | 0.818406% |
| C | 6476 | 77 | 1.189006% |
| D | 6476 | 376 | 5.806053% |
Noise dominated data is calculated using 1-second bins in cleaned event files. If a bin has >2000 counts, and if more than 50% of those come from <1% of pixels, then it is considered to be noise-dominated and hence unusable.
| Quadrant | # 1 sec bins | Bins with >0 counts | Bins with >2000 counts | High rate bins dominated by noise | Noise dominated (total time) | Noise dominated (detector-on time) | Marked lightcurve |
|---|---|---|---|---|---|---|---|
| A | 8637 | 6479 | 0 | 0 | 0.00% | 0.00% | 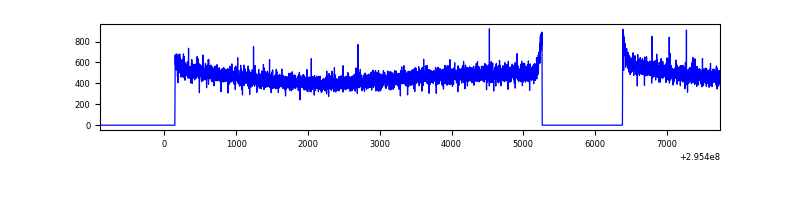 |
| B | 8636 | 6478 | 3 | 3 | 0.03% | 0.05% | 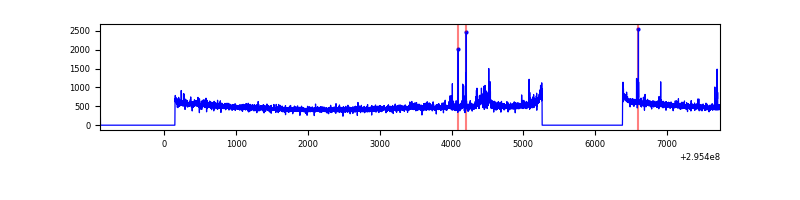 |
| C | 8636 | 6477 | 4 | 4 | 0.05% | 0.06% | 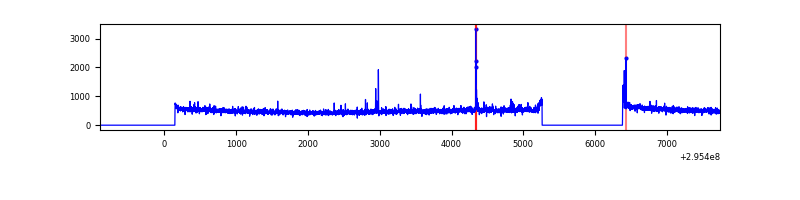 |
| D | 8636 | 6478 | 279 | 279 | 3.23% | 4.31% | 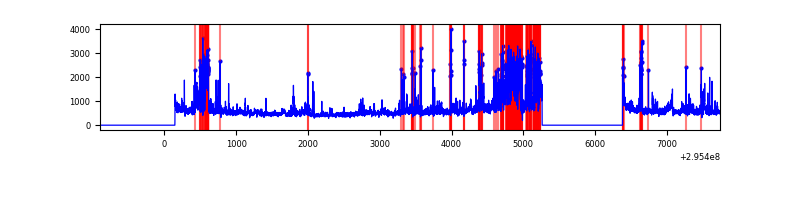 |
Top three noisy pixels from each quadrant. If the there are fewer than three noisy pixels in the level2.evt file, extra rows are filled as -1
| Pixel properties | Quadrant properties | ||||||
|---|---|---|---|---|---|---|---|
| Quadrant | DetID | PixID | Counts | Sigma | Mean | Median | Sigma |
| A | 13 | 254 | 9337 | 53.79 | 791 | 774 | 159.2 |
| A | 0 | 226 | 6898 | 38.47 | 791 | 774 | 159.2 |
| A | 3 | 137 | 5999 | 32.82 | 791 | 774 | 159.2 |
| B | 4 | 216 | 50515 | 330.47 | 798 | 777 | 150.5 |
| B | 12 | 111 | 18144 | 115.39 | 798 | 777 | 150.5 |
| B | 15 | 32 | 17419 | 110.57 | 798 | 777 | 150.5 |
| C | 14 | 238 | 121941 | 671.03 | 777 | 783 | 180.6 |
| C | 3 | 233 | 70852 | 388.07 | 777 | 783 | 180.6 |
| C | 5 | 112 | 25613 | 137.52 | 777 | 783 | 180.6 |
| D | 1 | 52 | 985187 | 5349.76 | 764 | 744 | 184.0 |
| D | 13 | 104 | 338148 | 1833.55 | 764 | 744 | 184.0 |
| D | 2 | 16 | 194206 | 1051.33 | 764 | 744 | 184.0 |
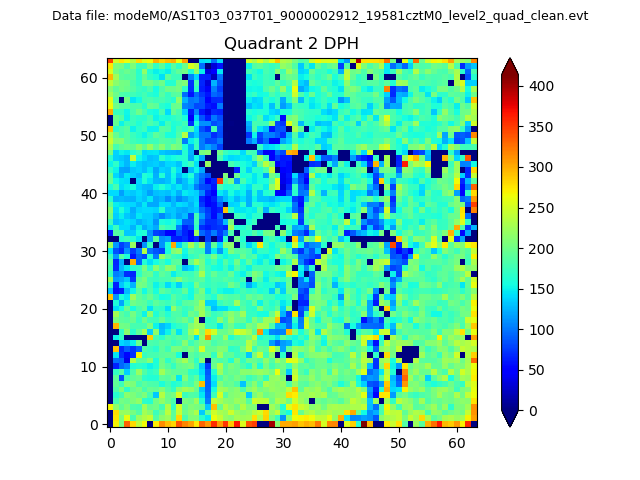
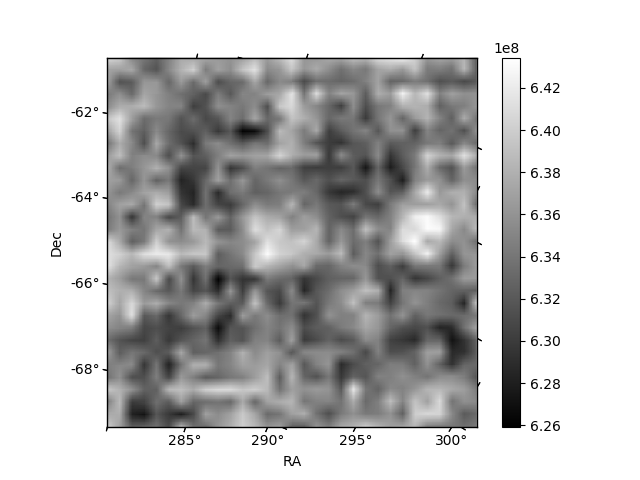
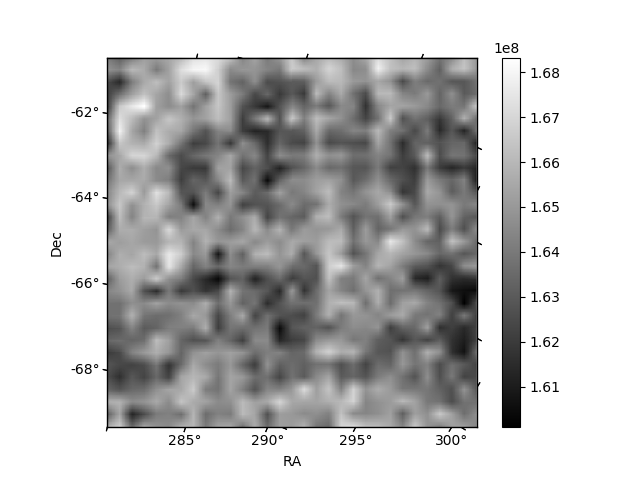
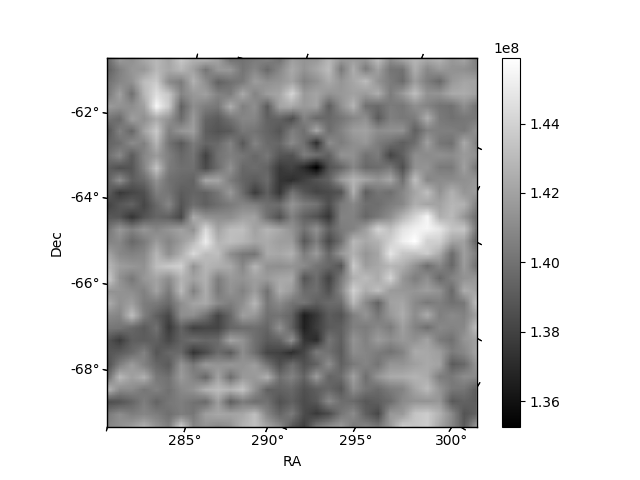
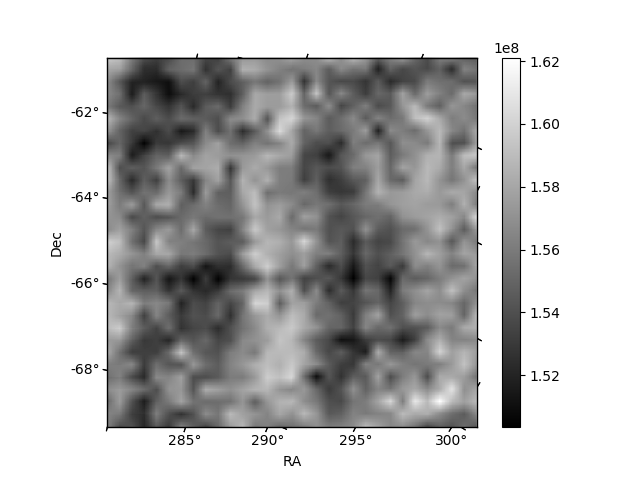
Histogram calculated using DETX and DETY for each event in the final _common_clean file
| Quadrant A | 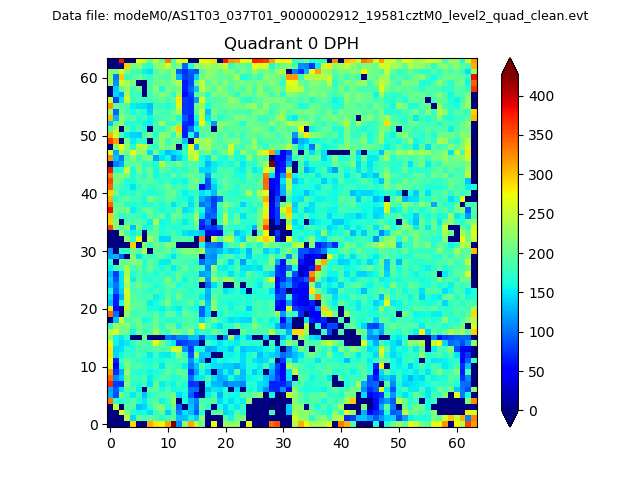 |
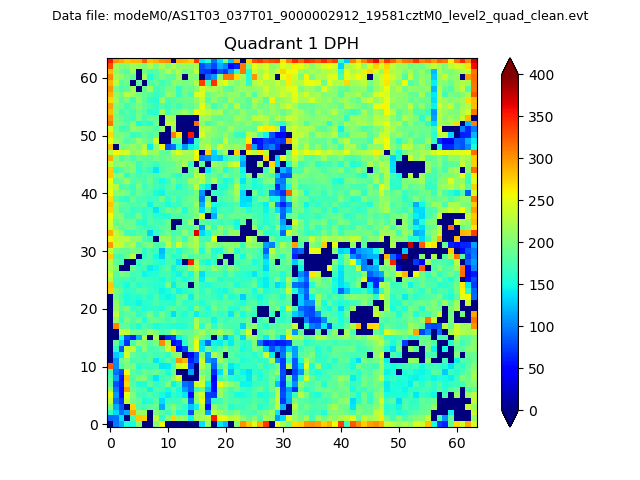 |
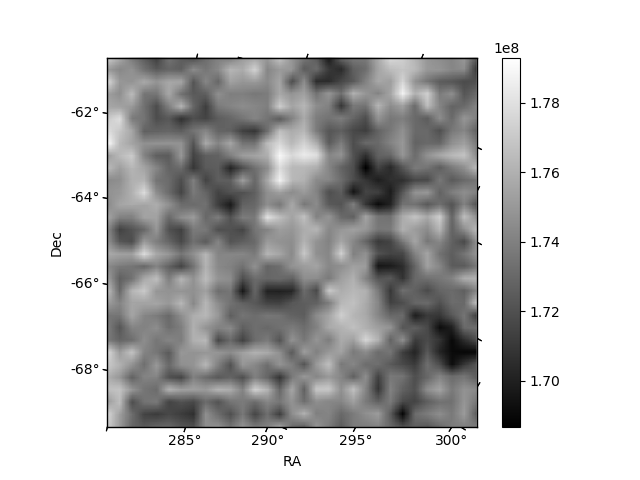
Quadrant B |
|---|---|---|---|
| Quadrant D | 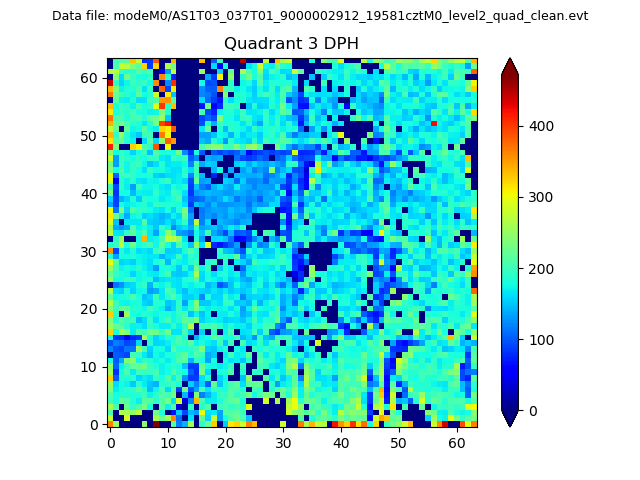 |
 |
Quadrant C |
| Plot type | Count rate plots | Images |
|---|---|---|
| Comparison with Poisson distribution Blue bars denote a histogram of data divided into 1 sec bins. Red curve is a Poisson curve with rate = median count rate of data. |
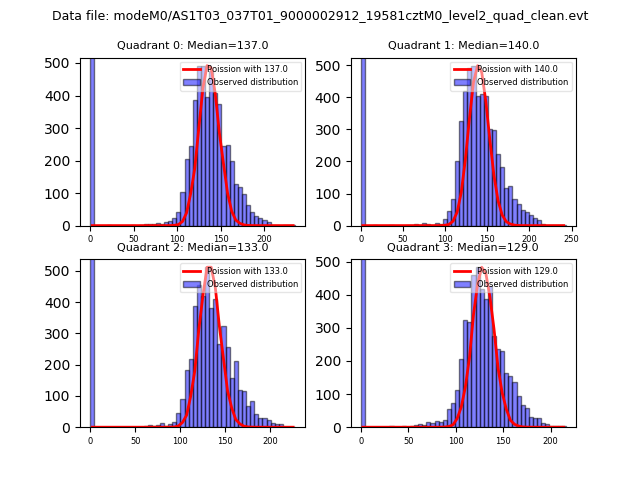 |
 |
| Quadrant-wise count rates Data is divided into 100 sec bins |
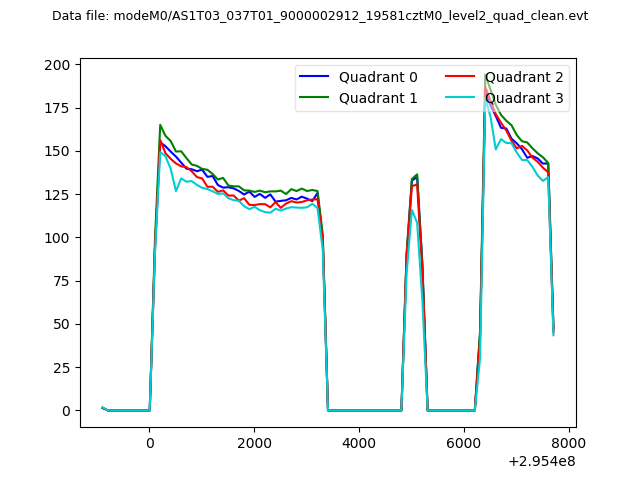 |
|
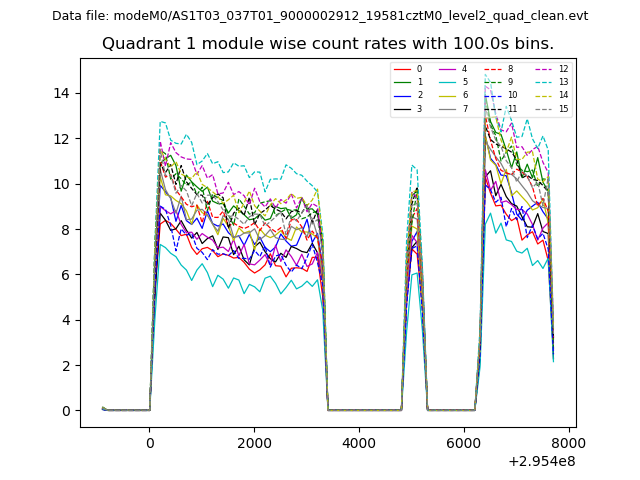
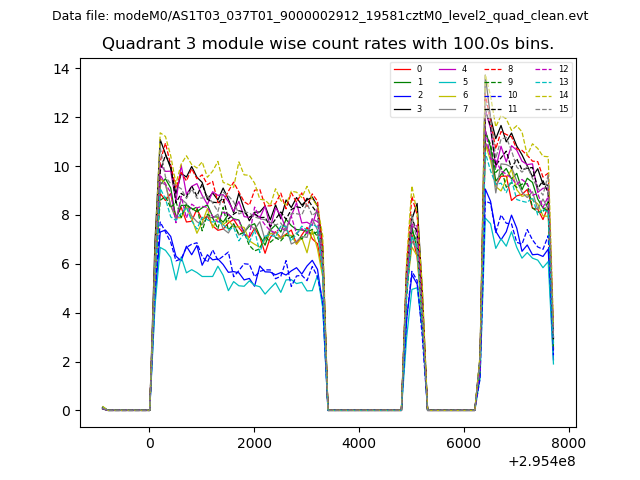
| Module-wise count rates for Quadrant A Data is divided into 100 sec bins |
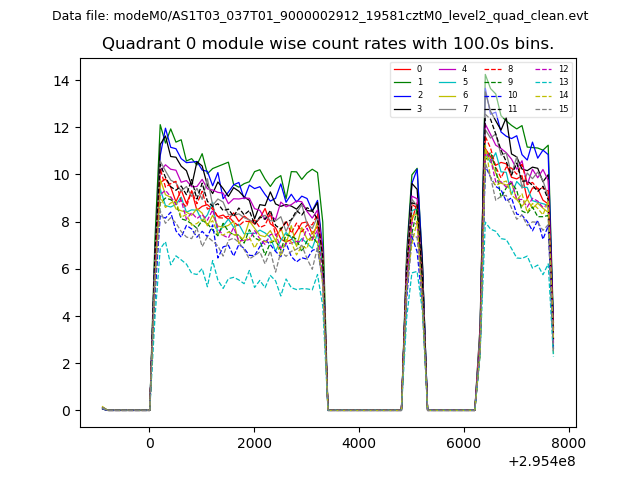 |
 |
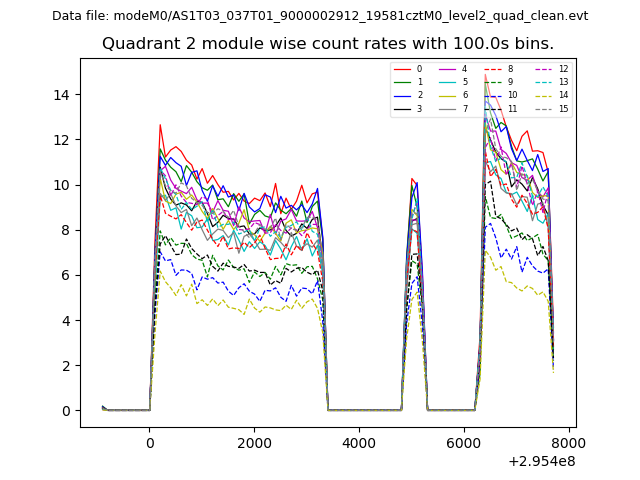
| Module-wise count rates for Quadrant B Data is divided into 100 sec bins |
 |
 |
| Module-wise count rates for Quadrant C Data is divided into 100 sec bins |
 |
 |
| Module-wise count rates for Quadrant D Data is divided into 100 sec bins |
 |
 |
| Parameter | Plot |
|---|---|
| CZT HV Monitor | 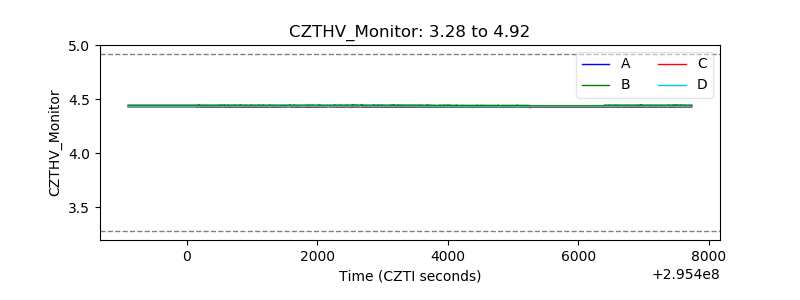 |
| D_VDD | 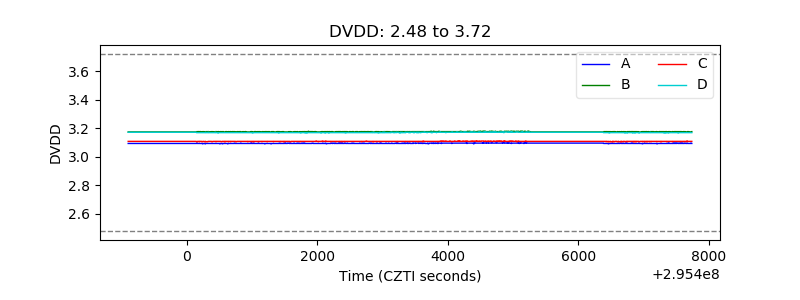 |
| Temperature 1 | 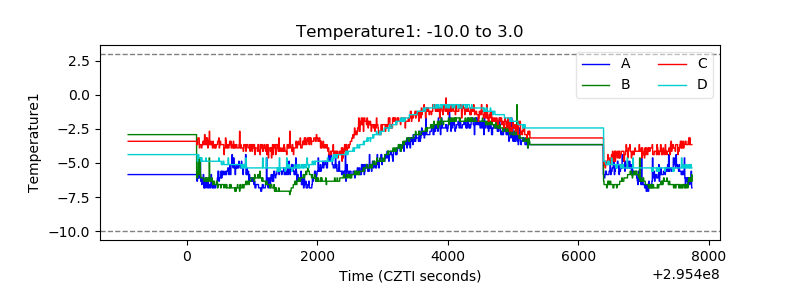 |
| Veto HV Monitor | 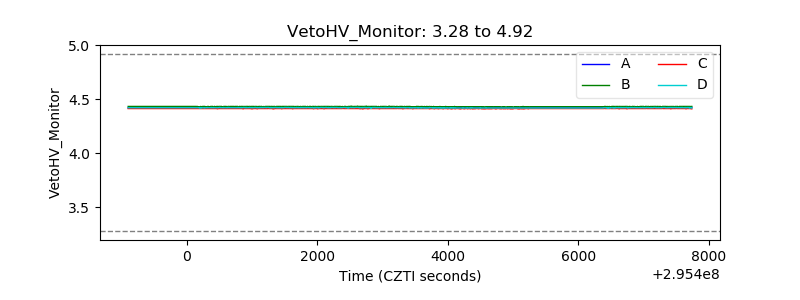 |
| Veto LLD | 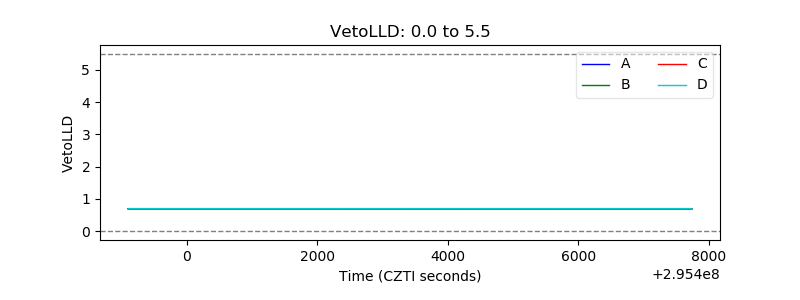 |
| Alpha Counter | 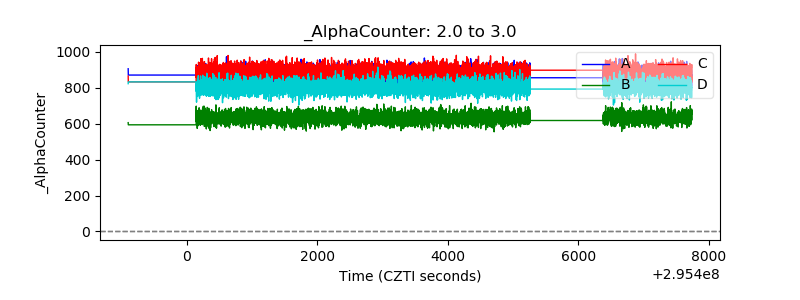 |
| _CPM_Rate | 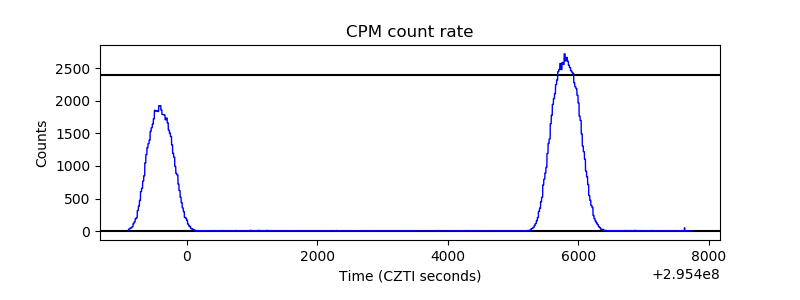 |
| CZT Counter | 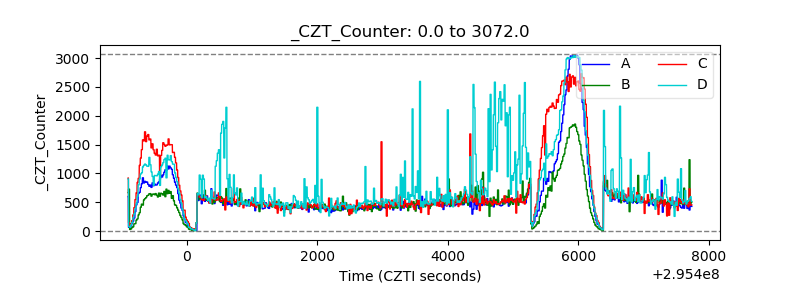 |
| +2.5 Volts monitor | 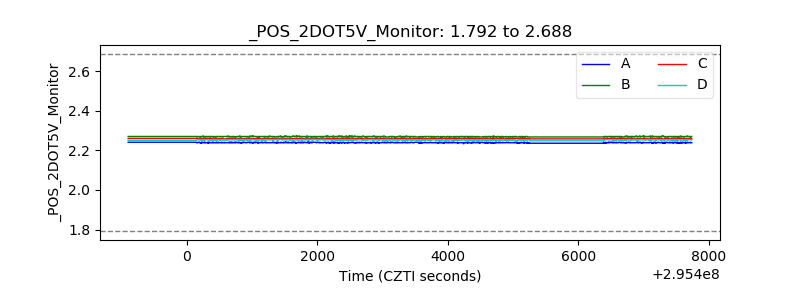 |
| +5 Volts monitor | 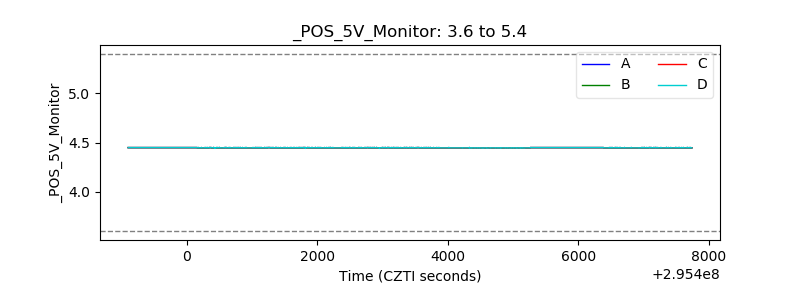 |
| _ROLL_ROT | 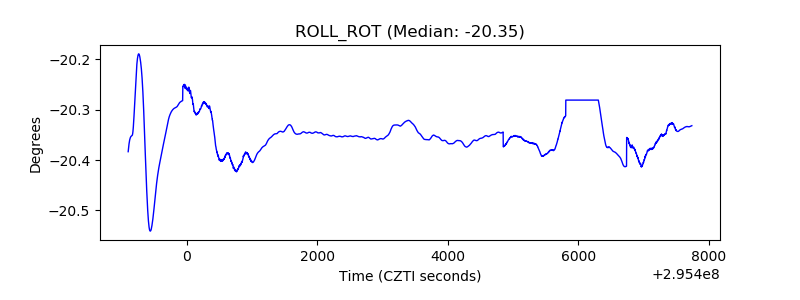 |
| _Roll_DEC | 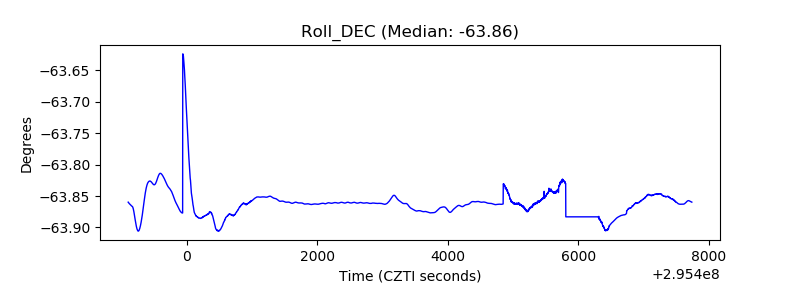 |
| _Roll_RA | 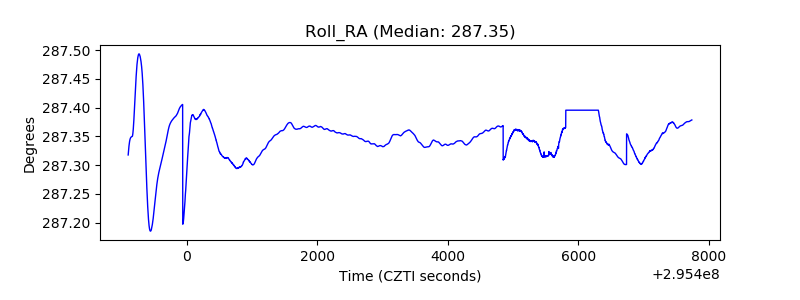 |
| Veto Counter | 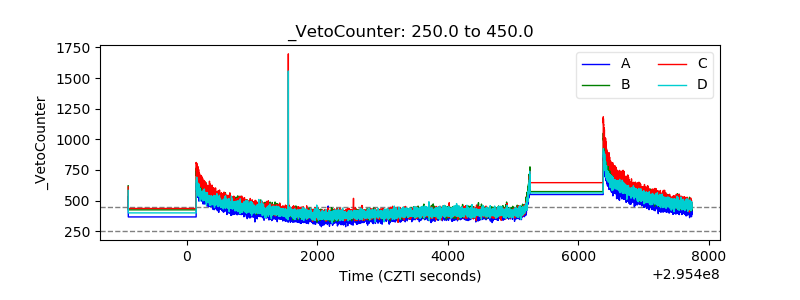 |