| Param | Original file | Final file |
|---|---|---|
| Filename | modeM0/AS1T03_037T01_9000002912_19582cztM0_level2.evt | modeM0/AS1T03_037T01_9000002912_19582cztM0_level2_quad_clean.evt |
| Size (bytes) | 512,164,800 | 111,602,880 |
| Size | 488.4 MB | 106.4 MB |
| Events in quadrant A | 3,168,726 | 737,165 |
| Events in quadrant B | 3,310,928 | 760,119 |
| Events in quadrant C | 3,382,996 | 732,448 |
| Events in quadrant D | 5,208,624 | 698,290 |
| Mode M9 | |||
|---|---|---|---|
| Quadrant | BADHDUFLAG | Total packets | Discarded packets |
| A | 0 | 14 | 0 |
| B | 0 | 15 | 0 |
| C | 0 | 15 | 0 |
| D | 0 | 15 | 0 |
| Mode M0 | |||
|---|---|---|---|
| Quadrant | BADHDUFLAG | Total packets | Discarded packets |
| A | 0 | 13437 | 2 |
| B | 0 | 13900 | 2 |
| C | 0 | 13962 | 2 |
| D | 0 | 19790 | 2 |
| Mode SS | |||
|---|---|---|---|
| Quadrant | BADHDUFLAG | Total packets | Discarded packets |
| A | 0 | 134 | 0 |
| B | 0 | 134 | 0 |
| C | 0 | 134 | 0 |
| D | 0 | 134 | 0 |
| Quadrant | Total seconds | Saturated seconds | Saturation percentage |
|---|---|---|---|
| A | 6472 | 13 | 0.200865% |
| B | 6472 | 44 | 0.679852% |
| C | 6472 | 75 | 1.158838% |
| D | 6472 | 442 | 6.829419% |
Noise dominated data is calculated using 1-second bins in cleaned event files. If a bin has >2000 counts, and if more than 50% of those come from <1% of pixels, then it is considered to be noise-dominated and hence unusable.
| Quadrant | # 1 sec bins | Bins with >0 counts | Bins with >2000 counts | High rate bins dominated by noise | Noise dominated (total time) | Noise dominated (detector-on time) | Marked lightcurve |
|---|---|---|---|---|---|---|---|
| A | 7717 | 6473 | 0 | 0 | 0.00% | 0.00% | 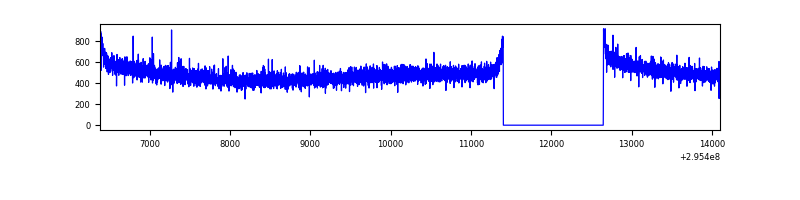 |
| B | 7717 | 6473 | 2 | 2 | 0.03% | 0.03% | 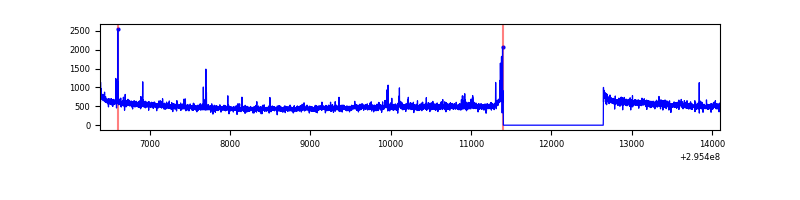 |
| C | 7717 | 6472 | 1 | 1 | 0.01% | 0.02% |  |
| D | 7717 | 6473 | 358 | 358 | 4.64% | 5.53% | 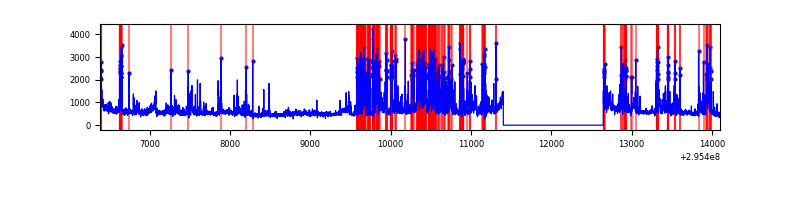 |
Top three noisy pixels from each quadrant. If the there are fewer than three noisy pixels in the level2.evt file, extra rows are filled as -1
| Pixel properties | Quadrant properties | ||||||
|---|---|---|---|---|---|---|---|
| Quadrant | DetID | PixID | Counts | Sigma | Mean | Median | Sigma |
| A | 13 | 254 | 9238 | 51.53 | 822 | 806 | 163.6 |
| A | 0 | 226 | 7079 | 38.34 | 822 | 806 | 163.6 |
| A | 3 | 137 | 6159 | 32.72 | 822 | 806 | 163.6 |
| B | 0 | 198 | 27408 | 173.13 | 828 | 809 | 153.6 |
| B | 12 | 111 | 17702 | 109.96 | 828 | 809 | 153.6 |
| B | 11 | 111 | 15543 | 95.9 | 828 | 809 | 153.6 |
| C | 14 | 238 | 127934 | 682.01 | 813 | 823 | 186.4 |
| C | 3 | 233 | 41428 | 217.86 | 813 | 823 | 186.4 |
| C | 5 | 112 | 26633 | 138.48 | 813 | 823 | 186.4 |
| D | 1 | 52 | 1618743 | 8422.9 | 797 | 776 | 192.1 |
| D | 12 | 218 | 219413 | 1138.19 | 797 | 776 | 192.1 |
| D | 7 | 238 | 173470 | 899.02 | 797 | 776 | 192.1 |
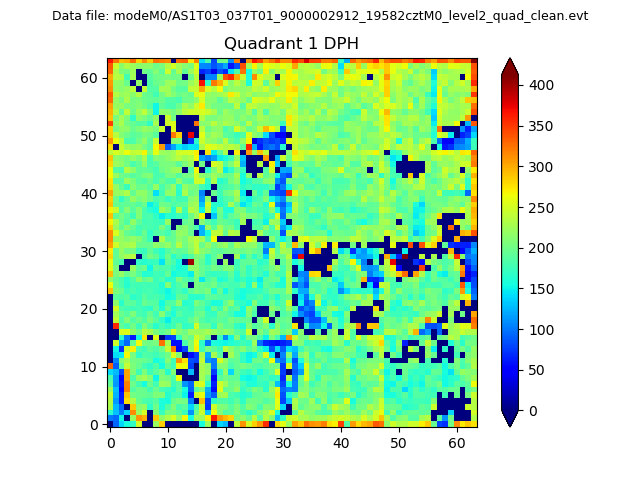
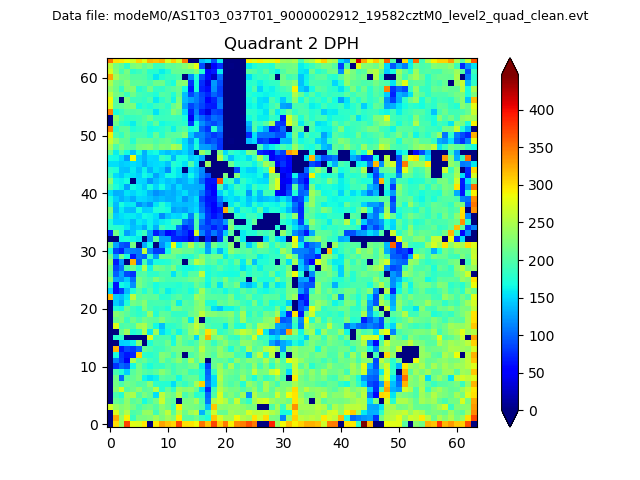
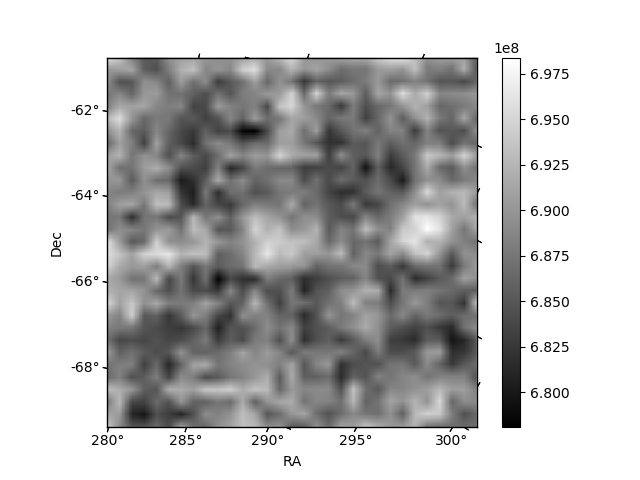
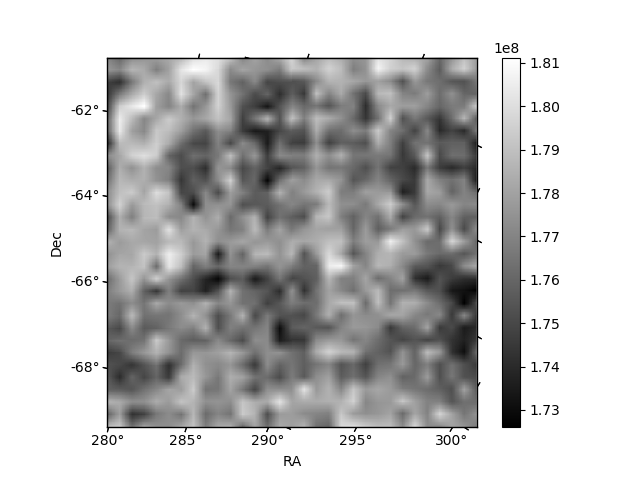
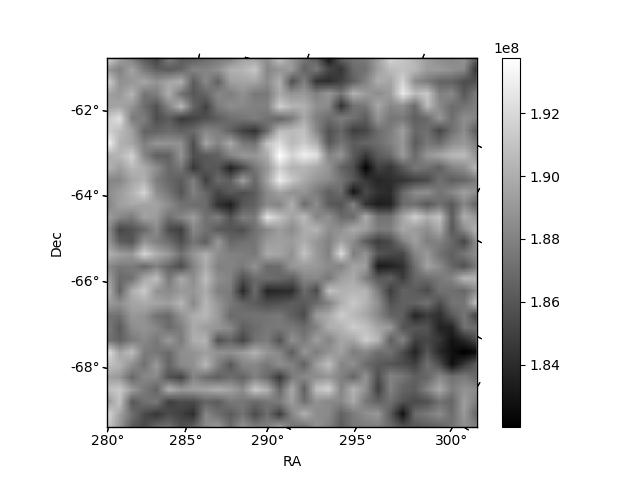
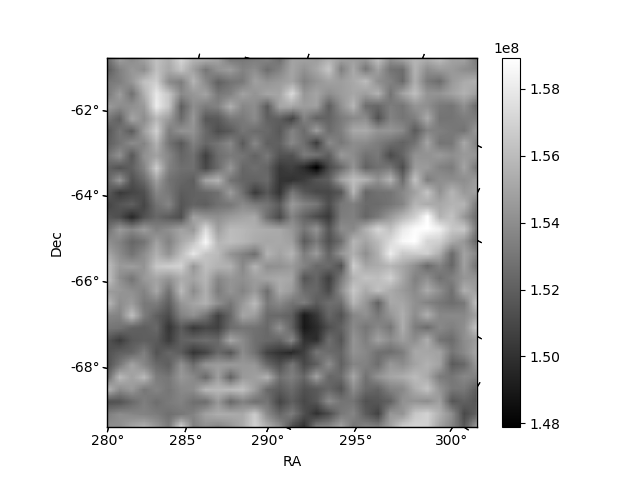
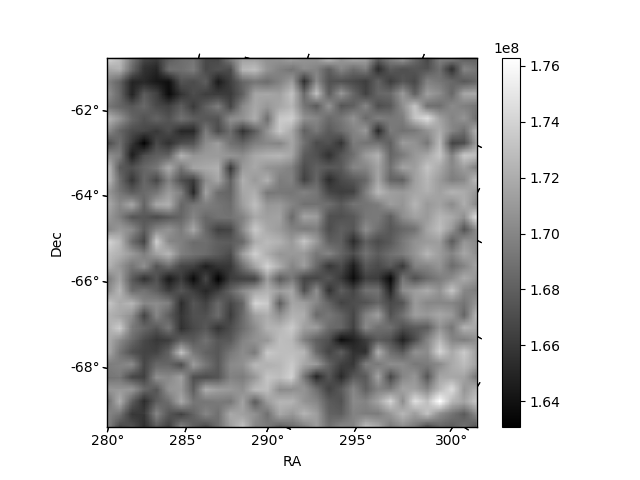
Histogram calculated using DETX and DETY for each event in the final _common_clean file
| Quadrant A | 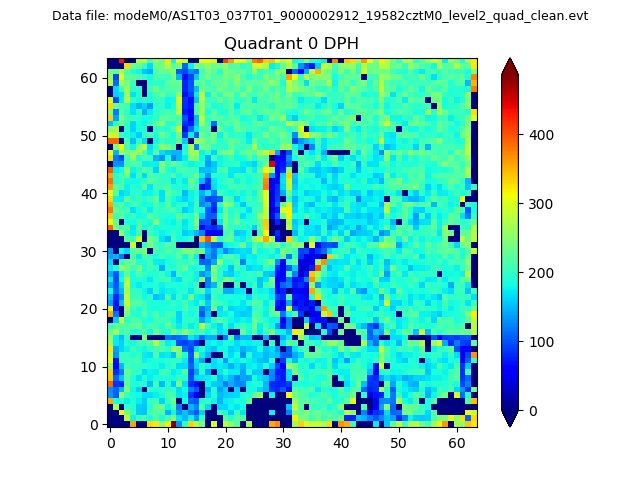 |
 |
Quadrant B |
|---|---|---|---|
| Quadrant D | 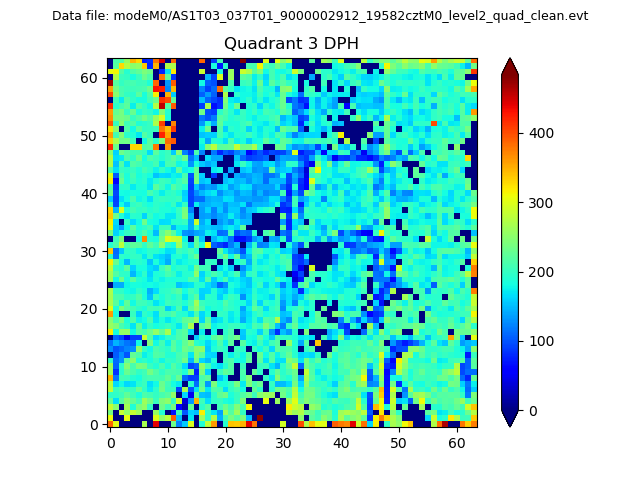 |
 |
Quadrant C |
| Plot type | Count rate plots | Images |
|---|---|---|
| Comparison with Poisson distribution Blue bars denote a histogram of data divided into 1 sec bins. Red curve is a Poisson curve with rate = median count rate of data. |
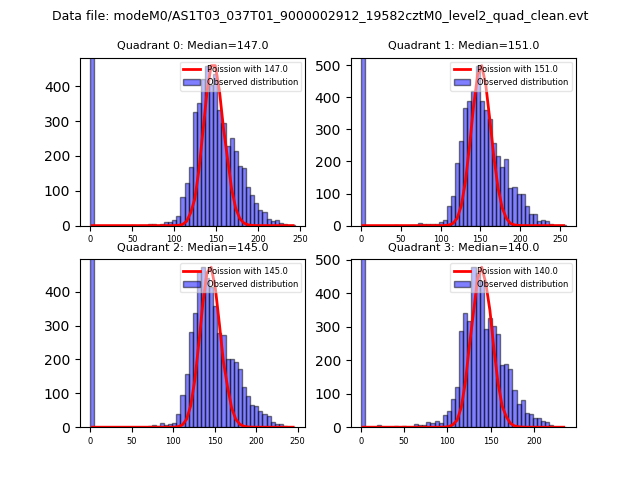 |
 |
| Quadrant-wise count rates Data is divided into 100 sec bins |
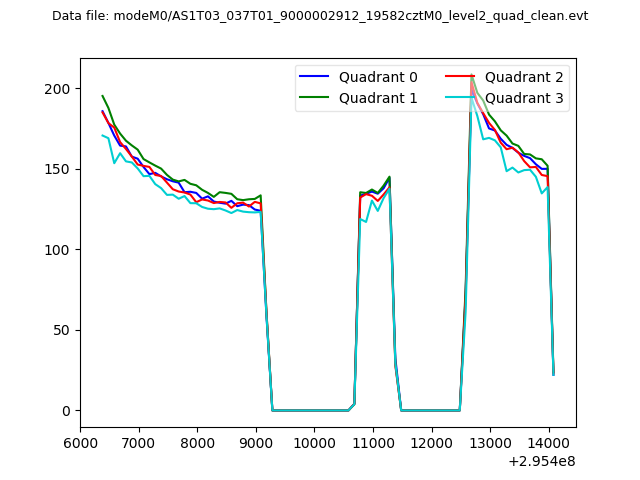 |
|
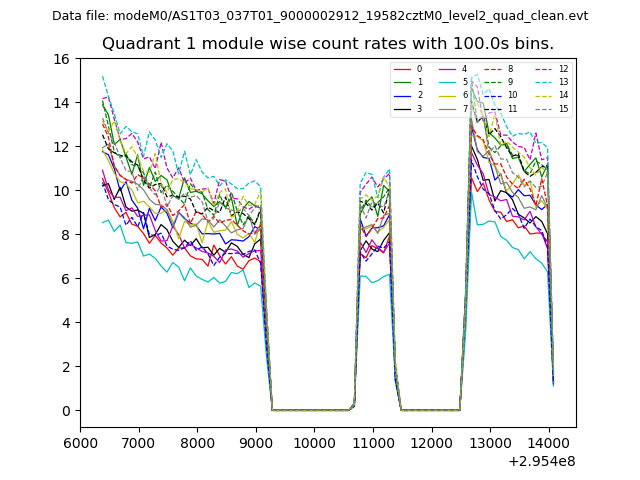
| Module-wise count rates for Quadrant A Data is divided into 100 sec bins |
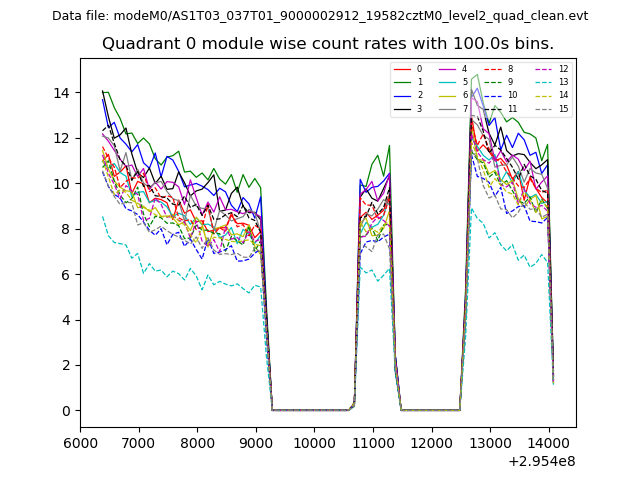 |
 |
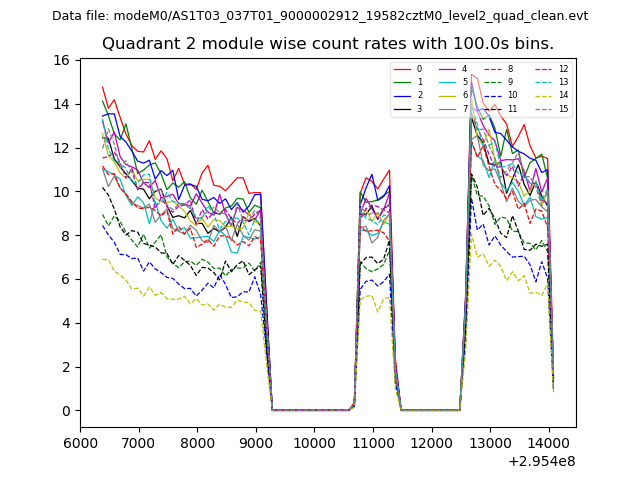
| Module-wise count rates for Quadrant B Data is divided into 100 sec bins |
 |
 |
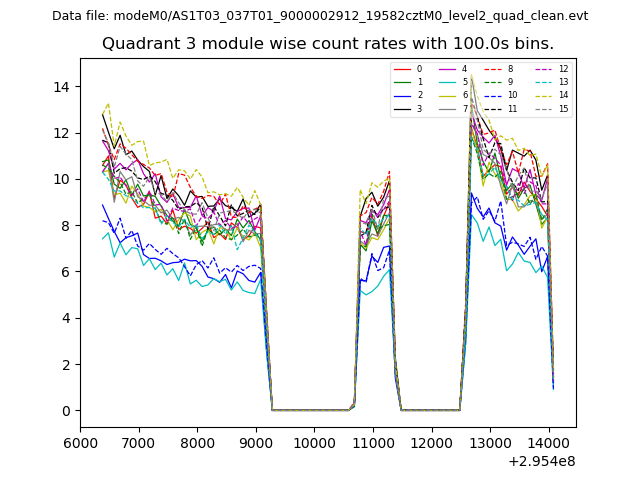
| Module-wise count rates for Quadrant C Data is divided into 100 sec bins |
 |
 |
| Module-wise count rates for Quadrant D Data is divided into 100 sec bins |
 |
 |
| Parameter | Plot |
|---|---|
| CZT HV Monitor | 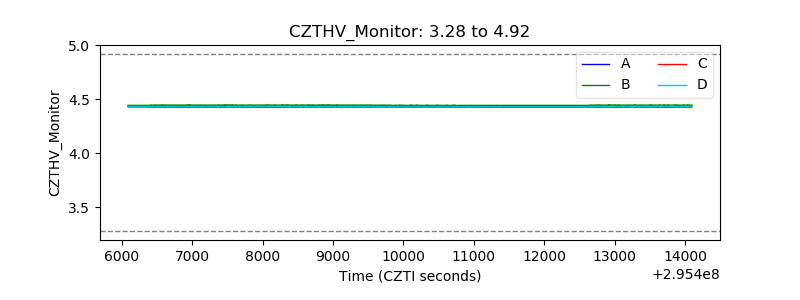 |
| D_VDD | 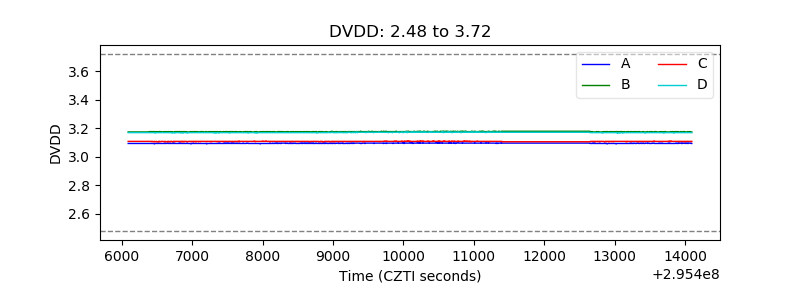 |
| Temperature 1 | 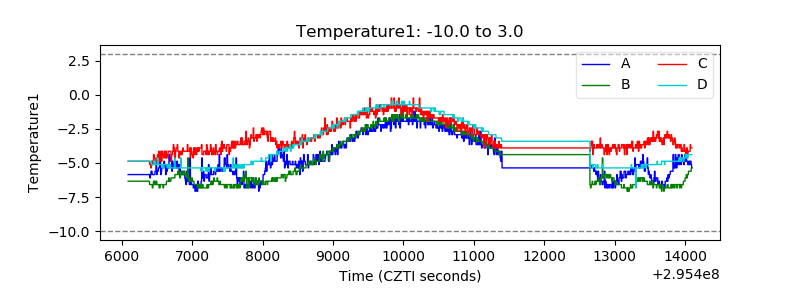 |
| Veto HV Monitor | 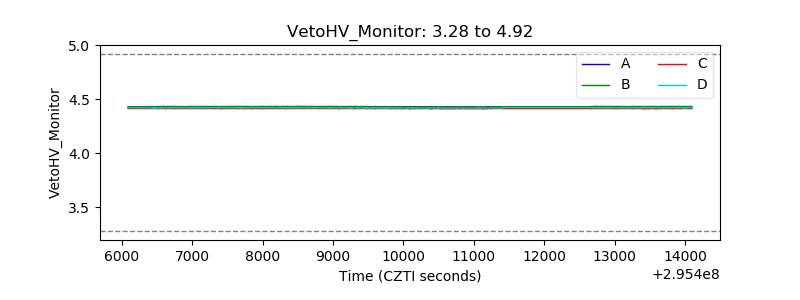 |
| Veto LLD | 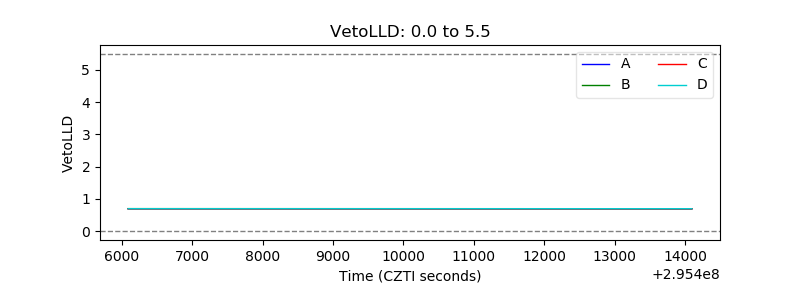 |
| Alpha Counter | 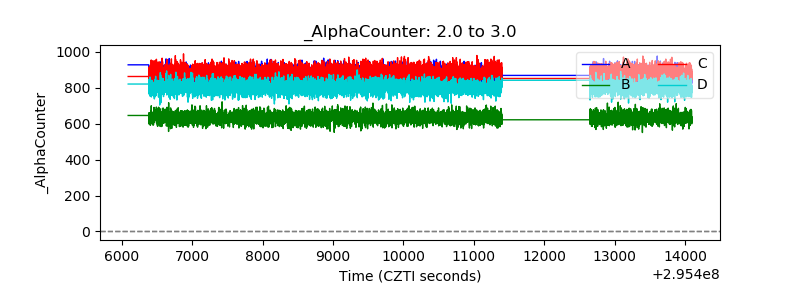 |
| _CPM_Rate | 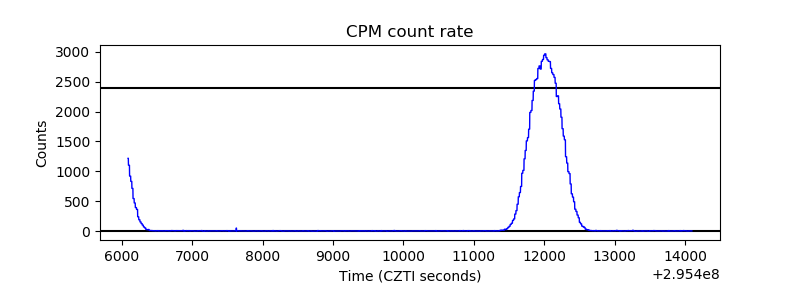 |
| CZT Counter |  |
| +2.5 Volts monitor |  |
| +5 Volts monitor |  |
| _ROLL_ROT | 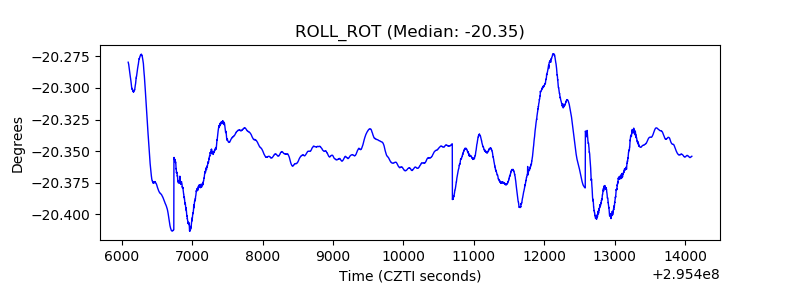 |
| _Roll_DEC | 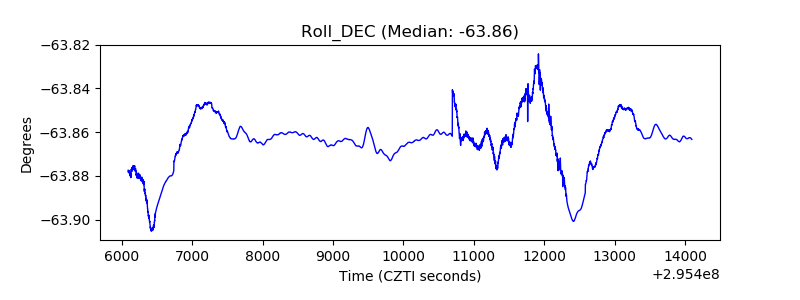 |
| _Roll_RA | 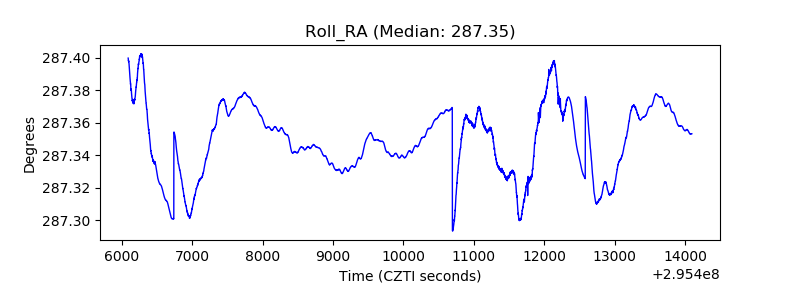 |
| Veto Counter | 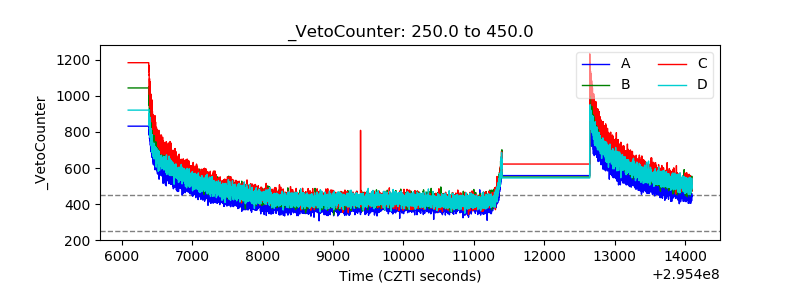 |