| Param | Original file | Final file |
|---|---|---|
| Filename | modeM0/AS1T03_037T01_9000002912_19583cztM0_level2.evt | modeM0/AS1T03_037T01_9000002912_19583cztM0_level2_quad_clean.evt |
| Size (bytes) | 464,722,560 | 96,099,840 |
| Size | 443.2 MB | 91.6 MB |
| Events in quadrant A | 2,846,737 | 640,887 |
| Events in quadrant B | 3,062,519 | 653,917 |
| Events in quadrant C | 3,062,020 | 632,918 |
| Events in quadrant D | 4,714,964 | 583,085 |
| Mode M9 | |||
|---|---|---|---|
| Quadrant | BADHDUFLAG | Total packets | Discarded packets |
| A | 0 | 14 | 0 |
| B | 0 | 14 | 0 |
| C | 0 | 14 | 0 |
| D | 0 | 14 | 0 |
| Mode M0 | |||
|---|---|---|---|
| Quadrant | BADHDUFLAG | Total packets | Discarded packets |
| A | 0 | 11889 | 1 |
| B | 0 | 12546 | 2 |
| C | 0 | 12407 | 1 |
| D | 0 | 17676 | 1 |
| Mode SS | |||
|---|---|---|---|
| Quadrant | BADHDUFLAG | Total packets | Discarded packets |
| A | 0 | 114 | 0 |
| B | 0 | 114 | 0 |
| C | 0 | 114 | 0 |
| D | 0 | 114 | 0 |
| Quadrant | Total seconds | Saturated seconds | Saturation percentage |
|---|---|---|---|
| A | 5720 | 14 | 0.244755% |
| B | 5719 | 58 | 1.014163% |
| C | 5719 | 74 | 1.293933% |
| D | 5719 | 595 | 10.403917% |
Noise dominated data is calculated using 1-second bins in cleaned event files. If a bin has >2000 counts, and if more than 50% of those come from <1% of pixels, then it is considered to be noise-dominated and hence unusable.
| Quadrant | # 1 sec bins | Bins with >0 counts | Bins with >2000 counts | High rate bins dominated by noise | Noise dominated (total time) | Noise dominated (detector-on time) | Marked lightcurve |
|---|---|---|---|---|---|---|---|
| A | 7045 | 5721 | 2 | 2 | 0.03% | 0.03% | 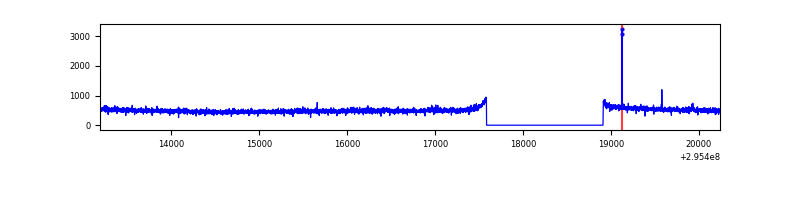 |
| B | 7044 | 5720 | 12 | 12 | 0.17% | 0.21% | 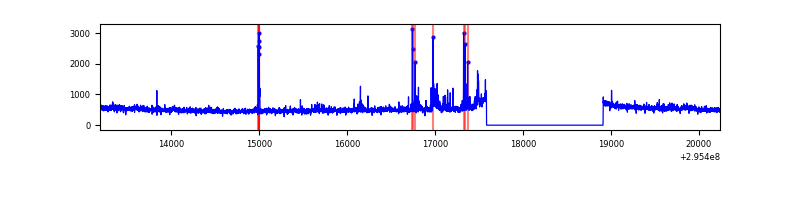 |
| C | 7044 | 5719 | 11 | 11 | 0.16% | 0.19% | 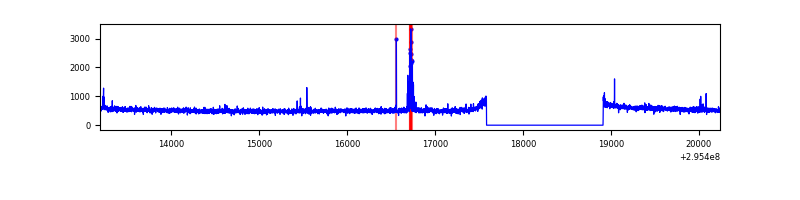 |
| D | 7044 | 5720 | 502 | 502 | 7.13% | 8.78% | 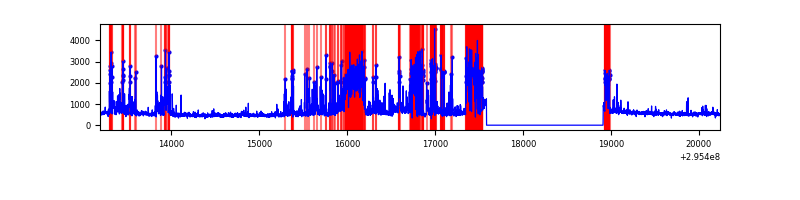 |
Top three noisy pixels from each quadrant. If the there are fewer than three noisy pixels in the level2.evt file, extra rows are filled as -1
| Pixel properties | Quadrant properties | ||||||
|---|---|---|---|---|---|---|---|
| Quadrant | DetID | PixID | Counts | Sigma | Mean | Median | Sigma |
| A | 9 | 143 | 9182 | 57.9 | 736 | 723 | 146.1 |
| A | 13 | 254 | 7933 | 49.35 | 736 | 723 | 146.1 |
| A | 0 | 226 | 6486 | 39.44 | 736 | 723 | 146.1 |
| B | 0 | 198 | 43735 | 319.99 | 735 | 718 | 134.4 |
| B | 6 | 36 | 35619 | 259.61 | 735 | 718 | 134.4 |
| B | 15 | 32 | 31436 | 228.5 | 735 | 718 | 134.4 |
| C | 14 | 238 | 114244 | 678.11 | 728 | 734 | 167.4 |
| C | 0 | 207 | 54187 | 319.33 | 728 | 734 | 167.4 |
| C | 3 | 233 | 36812 | 215.53 | 728 | 734 | 167.4 |
| D | 1 | 52 | 1390446 | 8258.76 | 700 | 681 | 168.3 |
| D | 13 | 104 | 321872 | 1908.7 | 700 | 681 | 168.3 |
| D | 7 | 238 | 190392 | 1127.37 | 700 | 681 | 168.3 |
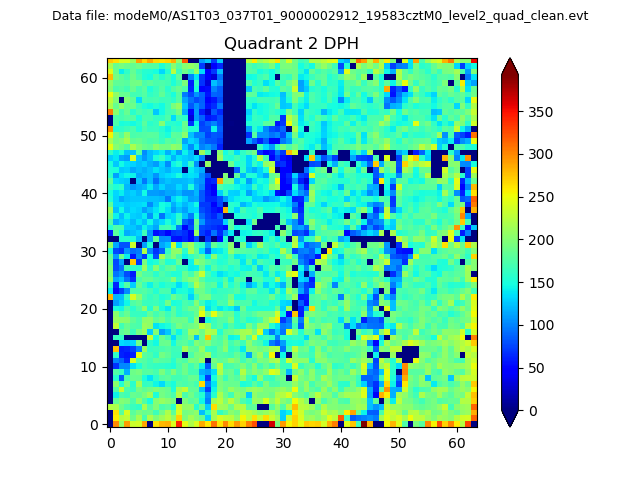
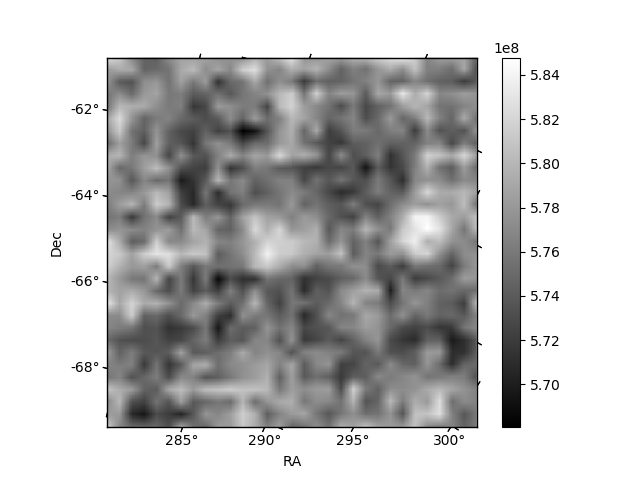
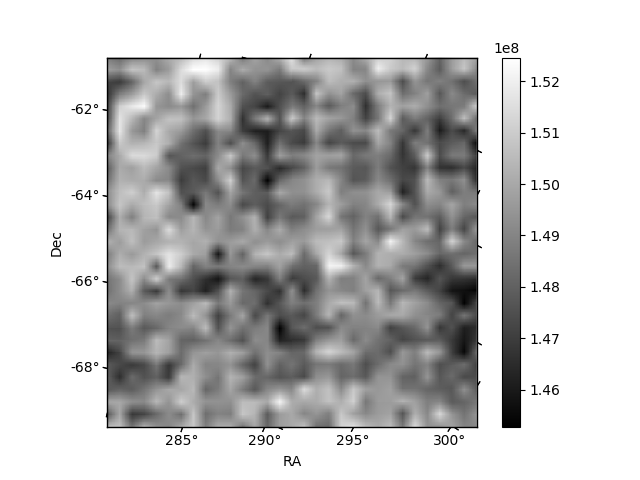
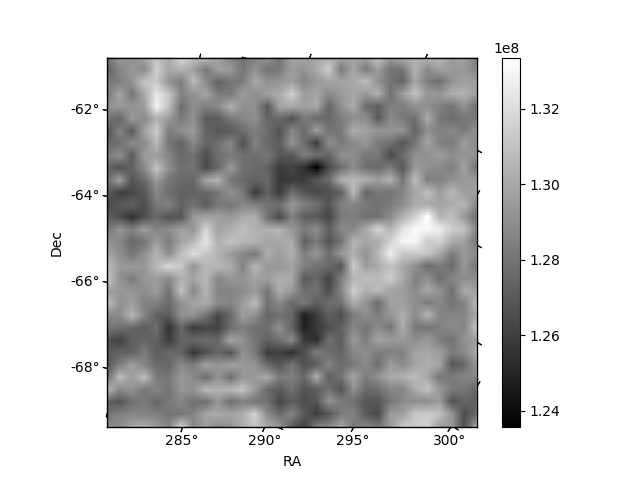
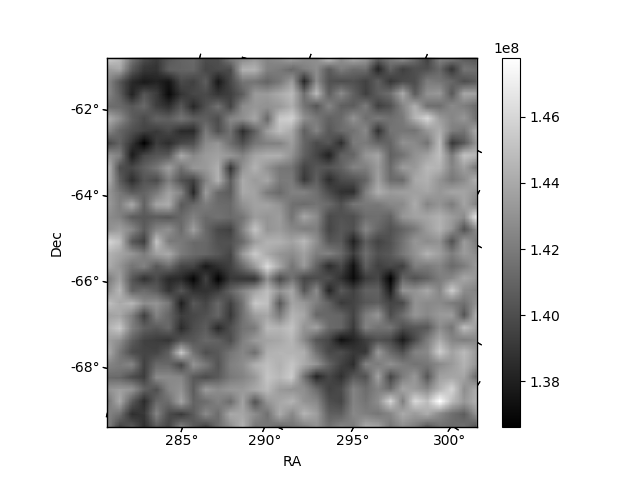
Histogram calculated using DETX and DETY for each event in the final _common_clean file
| Quadrant A | 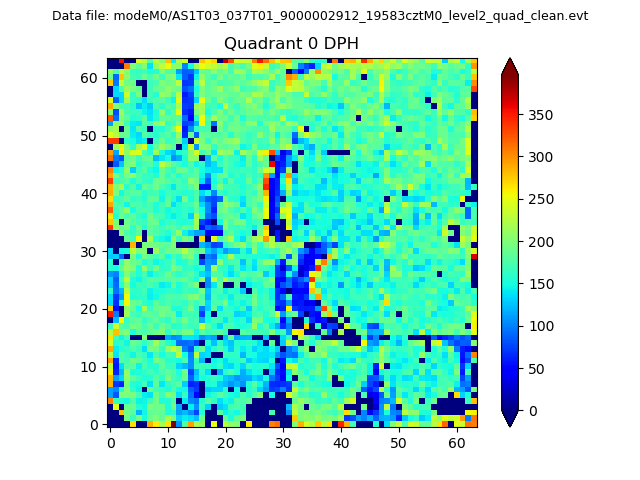 |
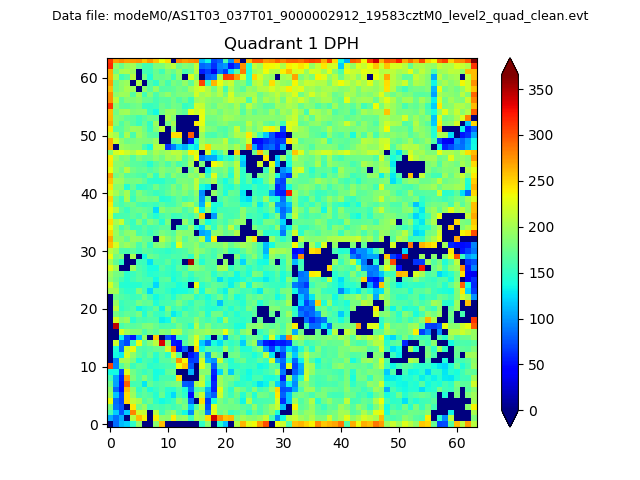 |
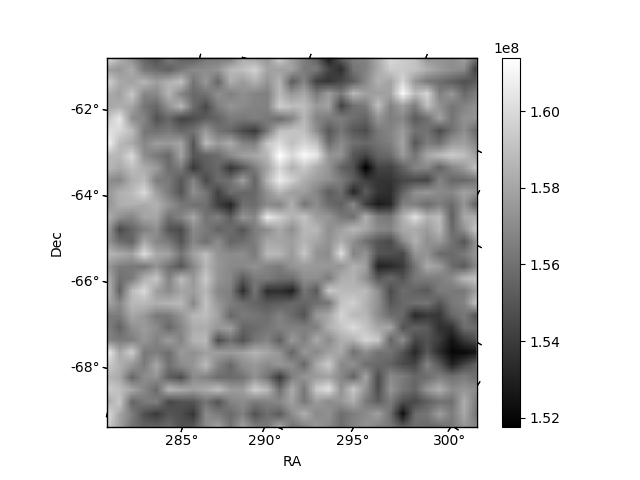
Quadrant B |
|---|---|---|---|
| Quadrant D | 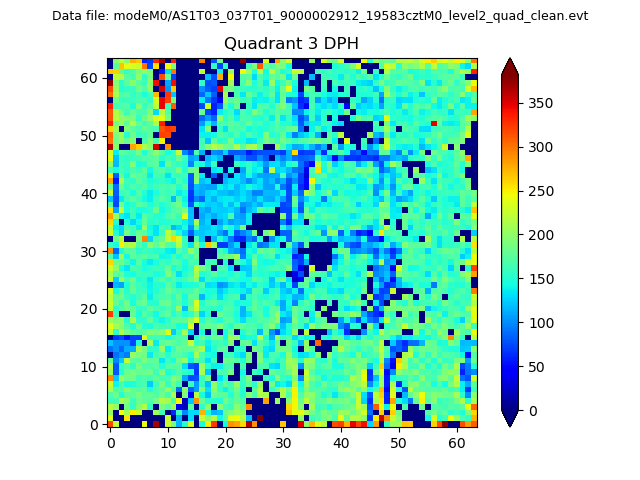 |
 |
Quadrant C |
| Plot type | Count rate plots | Images |
|---|---|---|
| Comparison with Poisson distribution Blue bars denote a histogram of data divided into 1 sec bins. Red curve is a Poisson curve with rate = median count rate of data. |
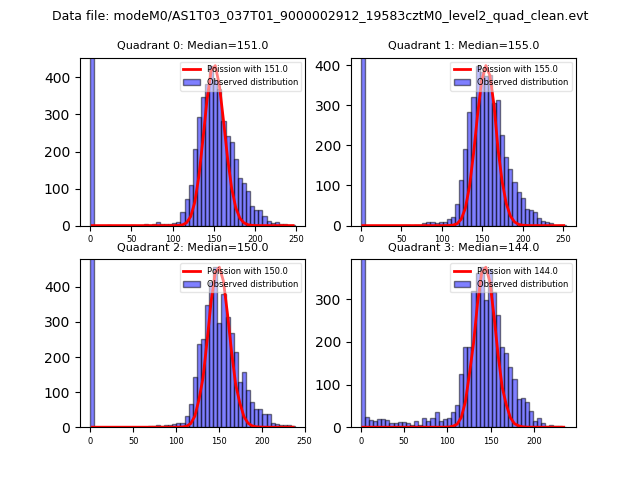 |
 |
| Quadrant-wise count rates Data is divided into 100 sec bins |
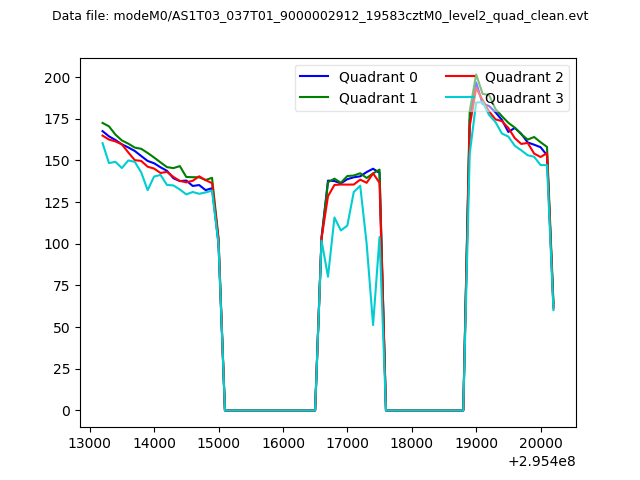 |
|
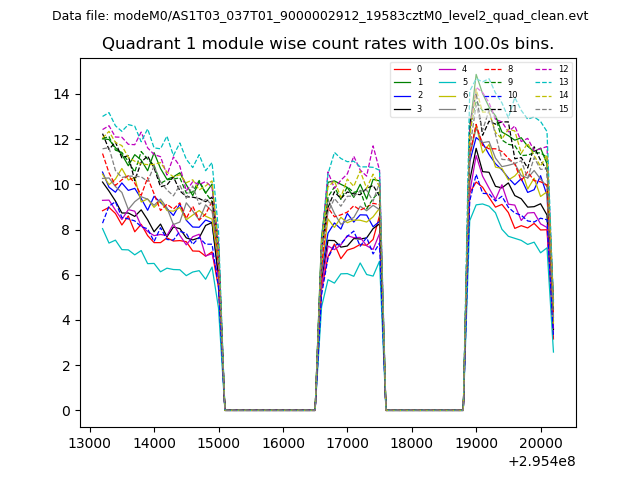
| Module-wise count rates for Quadrant A Data is divided into 100 sec bins |
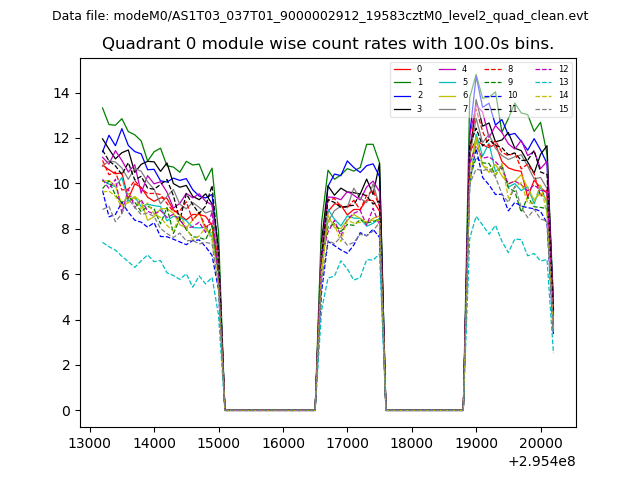 |
 |
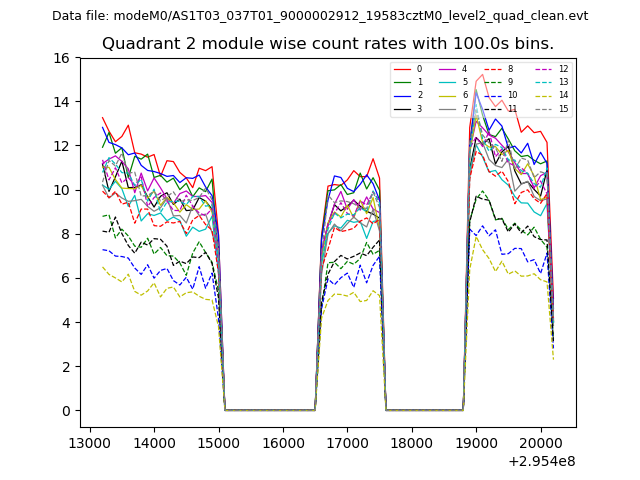
| Module-wise count rates for Quadrant B Data is divided into 100 sec bins |
 |
 |
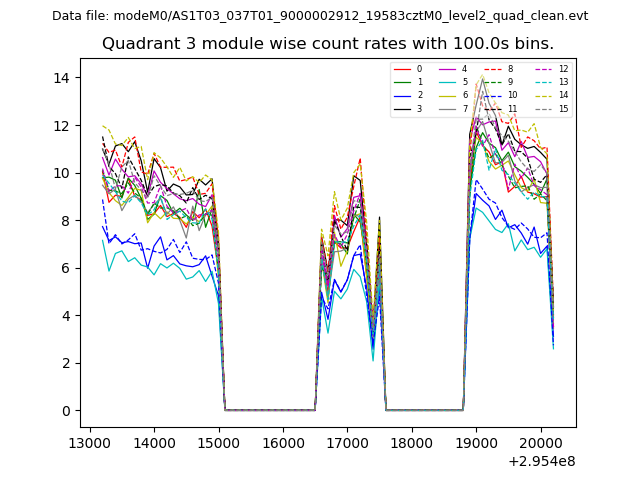
| Module-wise count rates for Quadrant C Data is divided into 100 sec bins |
 |
 |
| Module-wise count rates for Quadrant D Data is divided into 100 sec bins |
 |
 |
| Parameter | Plot |
|---|---|
| CZT HV Monitor | 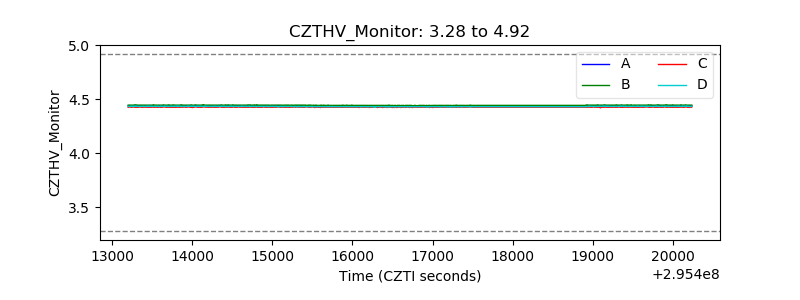 |
| D_VDD | 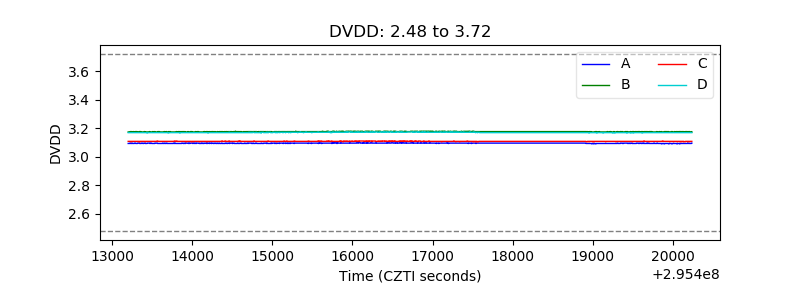 |
| Temperature 1 | 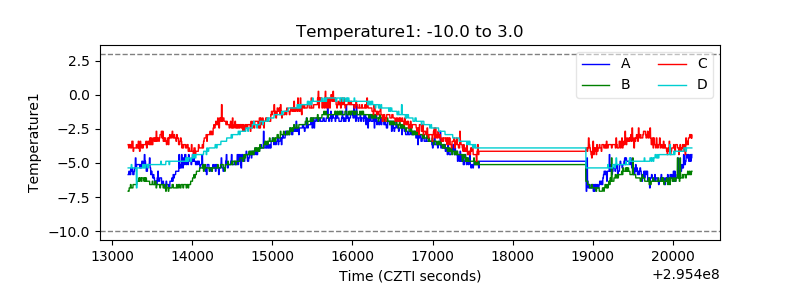 |
| Veto HV Monitor | 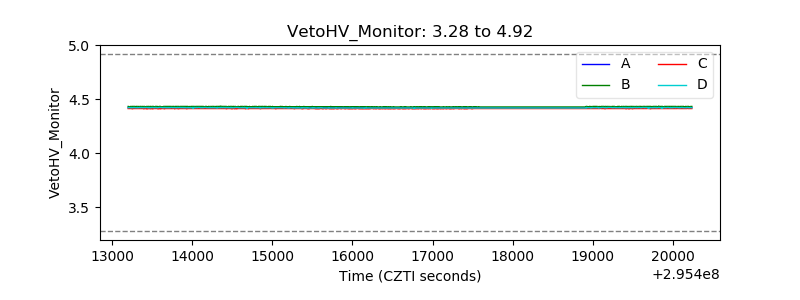 |
| Veto LLD | 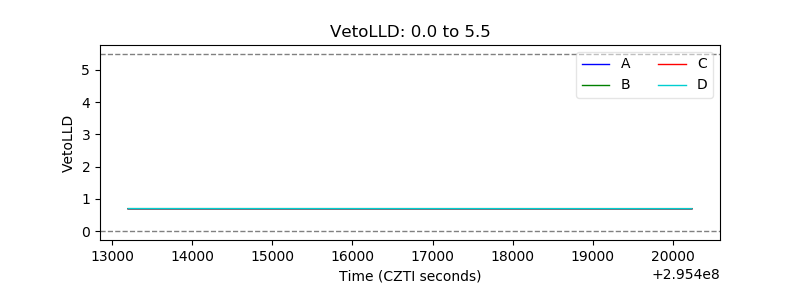 |
| Alpha Counter | 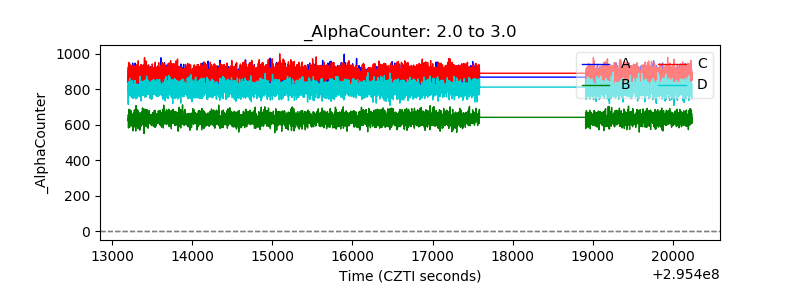 |
| _CPM_Rate | 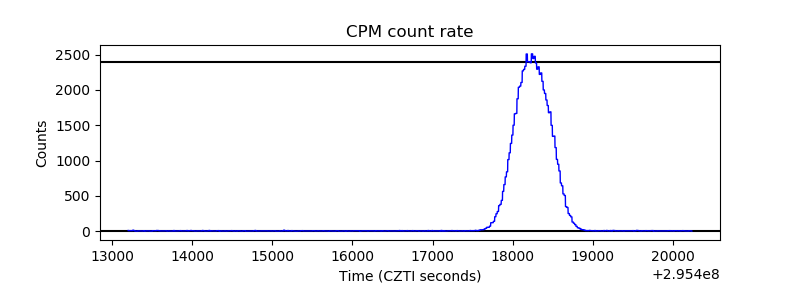 |
| CZT Counter | 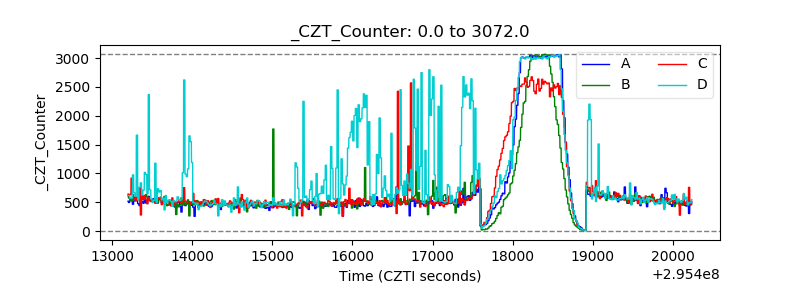 |
| +2.5 Volts monitor | 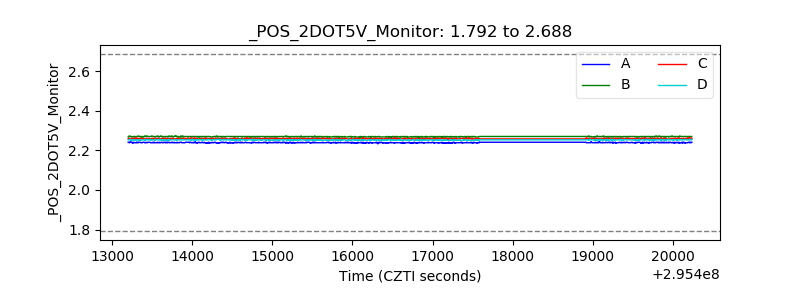 |
| +5 Volts monitor | 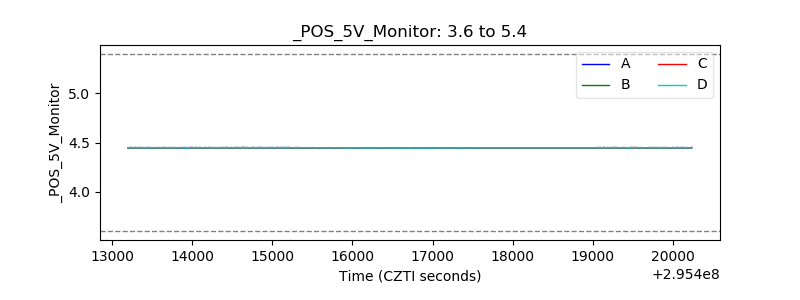 |
| _ROLL_ROT | 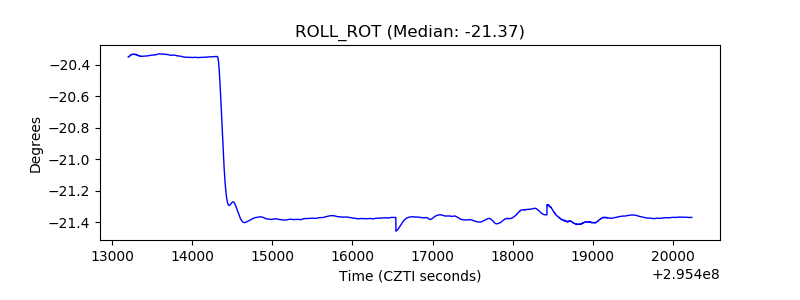 |
| _Roll_DEC | 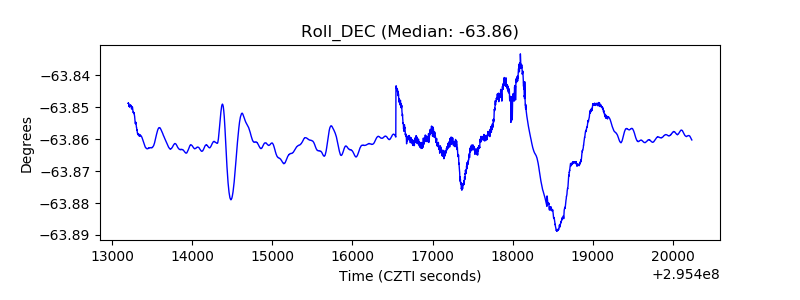 |
| _Roll_RA | 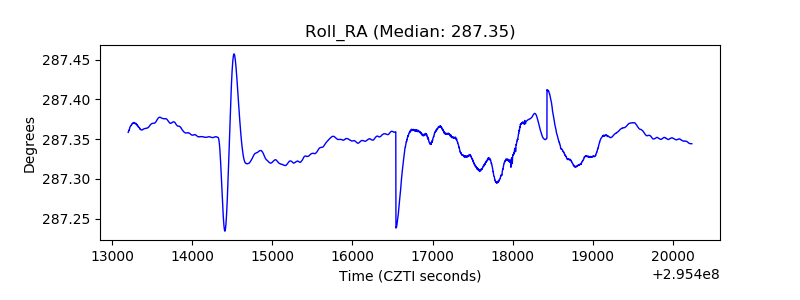 |
| Veto Counter | 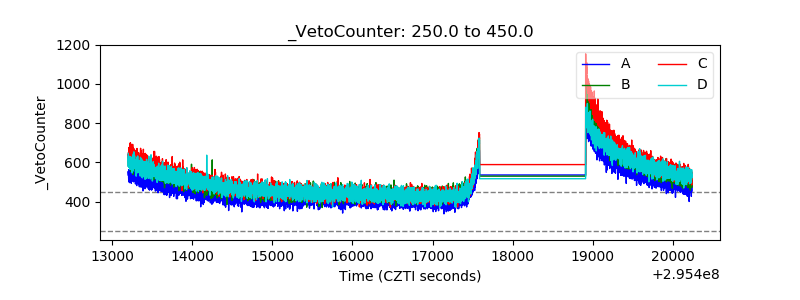 |